Lewis and Clark County, Montana
Lewis and Clark County is a county located in the U.S. state of Montana. As of the 2010 United States Census, the population was 63,395.[1] Its county seat is Helena,[2] the state capital. The numerical designation for Lewis and Clark County (used in the issuance of the state's license plates) is 5. The county was established on June 2, 1865 as one of the nine original counties of the Territory of Montana named Edgerton County in honor of Sidney Edgerton, first Governor of the Territory of Montana, and was renamed Lewis and Clark County on March 1, 1868 in honor of explorers Meriwether Lewis and William Clark.[3][4]
Lewis and Clark County | |
|---|---|
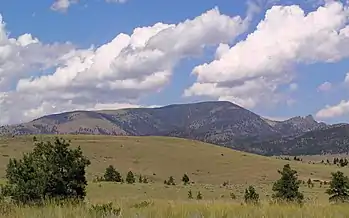 The "Sleeping Giant" formation north of Helena | |
 Seal | |
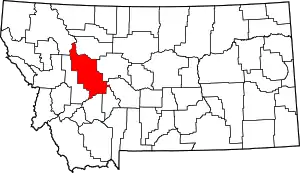 Location within the U.S. state of Montana | |
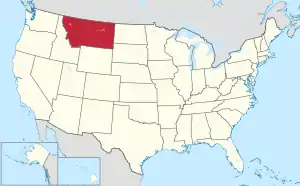 Montana's location within the U.S. | |
| Coordinates: 47°07′N 112°23′W | |
| Country | |
| State | |
| Founded | June 2, 1865 |
| Named for | Meriwether Lewis and William Clark |
| Seat | Helena |
| Largest city | Helena |
| Area | |
| • Total | 3,498 sq mi (9,060 km2) |
| • Land | 3,459 sq mi (8,960 km2) |
| • Water | 39 sq mi (100 km2) 1.1% |
| Population (2010) | |
| • Total | 63,395 |
| • Estimate (2019) | 69,432 |
| • Density | 18/sq mi (7.0/km2) |
| Time zone | UTC−7 (Mountain) |
| • Summer (DST) | UTC−6 (MDT) |
| Congressional district | At-large |
| Website | www |
| |
Lewis and Clark County is part of the Helena, Montana Micropolitan Statistical Area.
Geography
According to the U.S. Census Bureau, the county has a total area of 3,948 square miles (10,230 km2), of which 3,459 square miles (8,960 km2) is land and 39 square miles (100 km2) (1.1%) is water.[5]
Adjacent counties
- Teton County - north
- Cascade County - east
- Meagher County - east
- Broadwater County - southeast
- Jefferson County - south
- Powell County - west
- Flathead County - northwest
National protected areas
- Flathead National Forest (part)
- Helena National Forest (part)
- Lewis and Clark National Forest (part)
- Lolo National Forest (part)
- Rocky Mountain Front Conservation Area (part)
Politics
Lewis and Clark County leans slightly Republican, but it has voted for Democratic candidates three times since 1964. Bill Clinton won by nearly seven percentage points in 1992, but Bob Dole won by 130 votes in 1996. Barack Obama carried the county in 2008 but lost it to Mitt Romney in 2012.
| Year | Republican | Democratic | Third parties |
|---|---|---|---|
| 2020 | 50.7% 21,409 | 46.7% 19,743 | 2.6% 1,113 |
| 2016 | 47.9% 16,895 | 41.0% 14,478 | 11.1% 3,923 |
| 2012 | 50.4% 16,803 | 46.9% 15,620 | 2.7% 895 |
| 2008 | 45.3% 14,966 | 51.8% 17,114 | 2.9% 949 |
| 2004 | 55.3% 16,494 | 42.6% 12,717 | 2.1% 632 |
| 2000 | 55.3% 15,091 | 36.6% 9,982 | 8.1% 2,196 |
| 1996 | 43.9% 11,665 | 43.5% 11,535 | 12.6% 3,347 |
| 1992 | 35.7% 9,351 | 42.5% 11,117 | 21.8% 5,711 |
| 1988 | 46.9% 10,946 | 51.1% 11,932 | 2.0% 456 |
| 1984 | 60.0% 13,569 | 38.8% 8,768 | 1.3% 289 |
| 1980 | 57.2% 12,128 | 32.1% 6,815 | 10.7% 2,269 |
| 1976 | 54.8% 10,155 | 43.8% 8,118 | 1.3% 244 |
| 1972 | 61.9% 10,719 | 35.1% 6,081 | 3.0% 516 |
| 1968 | 56.5% 7,979 | 38.1% 5,379 | 5.4% 757 |
| 1964 | 45.0% 6,155 | 54.8% 7,506 | 0.2% 26 |
| 1960 | 54.7% 7,260 | 45.2% 6,008 | 0.1% 17 |
| 1956 | 64.4% 7,959 | 35.6% 4,397 | 0.0% 0 |
| 1952 | 62.6% 7,663 | 37.3% 4,563 | 0.2% 20 |
| 1948 | 50.9% 5,174 | 46.6% 4,745 | 2.5% 257 |
| 1944 | 48.4% 4,482 | 51.2% 4,737 | 0.4% 39 |
| 1940 | 44.6% 4,762 | 54.4% 5,814 | 1.0% 107 |
| 1936 | 33.8% 2,951 | 64.3% 5,614 | 1.8% 160 |
| 1932 | 42.7% 3,671 | 54.8% 4,714 | 2.5% 211 |
| 1928 | 57.4% 4,441 | 42.3% 3,278 | 0.3% 25 |
| 1924 | 49.9% 3,433 | 27.2% 1,869 | 22.9% 1,573 |
| 1920 | 62.9% 4,348 | 34.9% 2,413 | 2.2% 152 |
| 1916 | 43.0% 3,423 | 54.5% 4,337 | 2.5% 202 |
| 1912 | 24.5% 1,062 | 34.7% 1,505 | 40.8% 1,768[7] |
| 1908 | 45.9% 2,033 | 46.6% 2,062 | 7.6% 335 |
| 1904 | 54.6% 2,505 | 33.6% 1,543 | 11.8% 540 |
Demographics
| Historical population | |||
|---|---|---|---|
| Census | Pop. | %± | |
| 1870 | 5,040 | — | |
| 1880 | 6,521 | 29.4% | |
| 1890 | 19,145 | 193.6% | |
| 1900 | 19,171 | 0.1% | |
| 1910 | 21,853 | 14.0% | |
| 1920 | 18,660 | −14.6% | |
| 1930 | 18,224 | −2.3% | |
| 1940 | 22,131 | 21.4% | |
| 1950 | 24,540 | 10.9% | |
| 1960 | 28,006 | 14.1% | |
| 1970 | 33,281 | 18.8% | |
| 1980 | 43,039 | 29.3% | |
| 1990 | 47,495 | 10.4% | |
| 2000 | 55,716 | 17.3% | |
| 2010 | 63,395 | 13.8% | |
| 2019 (est.) | 69,432 | [8] | 9.5% |
| US Decennial Census[9] 1790-1960[10] 1900-1990[11] 1990-2000[12] 2010-2019[1] | |||
2000 census
As of 2000,[13] there were 55,716 people, 22,850 households, and 14,966 families in the county. The population density was 16 people per square mile (6/km2). There were 25,672 housing units at an average density of 7 per square mile (3/km2). The racial makeup of the county was 95.21% white, 0.20% Black or African American, 2.04% Native American, 0.52% Asian American, 0.05% Pacific Islander American, 0.38% from other races, and 1.61% from two or more races. 1.51% of the population were Hispanic or Latino of any race. 22.6% were of German, 15.5% Irish, 10.9% English, 9.5% Norwegian and 6.1% American ancestry.
There were 22,850 households, out of which 32.20% had children under the age of 18 living with them, 52.40% were married couples living together, 9.20% had a female householder with no husband present, and 34.50% were non-families. 29.10% of all households were made up of individuals, and 8.90% had someone living alone who was 65 years of age or older. The average household size was 2.38 and the average family size was 2.95.
The county population contained 25.60% under the age of 18, 8.50% from 18 to 24, 27.90% from 25 to 44, 26.20% from 45 to 64, and 11.70% who were 65 years of age or older. The median age was 38 years. For every 100 females, there were 96.50 males. For every 100 females age 18 and over, there were 94.00 males.
The median income for a household in the county was $37,360, and the median income for a family was $46,766. Males had a median income of $33,515 versus $23,961 for females. The per capita income for the county was $18,763. About 7.30% of families and 10.90% of the population were below the poverty line, including 12.60% of those under age 18 and 6.50% of those age 65 or over.
In the county of the population that's 25 years old and over 91.4% of them have a High school diploma, 31.6% of that population has a Bachelor's degree or higher, 17.2% of the population is disabled, 1.6% of them are foreign born, and only 4.0% of the population can speak another language at home. According to the 2000 Census 59.7% of the population (male) is married but, now separated. For the women it is only 3% lower at 56.7%. The average family size is 2.95. In the county, there are 25,672 homes, 2,822 of which are vacant.
2010 census
As of the 2010 United States Census, there were 63,395 people, 26,694 households, and 16,705 families in the county.[14] The population density was 18.3 inhabitants per square mile (7.1/km2). There were 30,180 housing units at an average density of 8.7 per square mile (3.4/km2).[15] The racial makeup of the county was 94.0% white, 2.1% American Indian, 0.6% Asian, 0.3% black or African American, 0.1% Pacific islander, 0.5% from other races, and 2.4% from two or more races. Those of Hispanic or Latino origin made up 2.5% of the population.[14] In terms of ancestry, 29.2% were German, 19.3% were Irish, 15.0% were English, 8.9% were Norwegian, and 5.1% were American.[16]
Of the 26,694 households, 28.8% had children under the age of 18 living with them, 49.0% were married couples living together, 9.4% had a female householder with no husband present, 37.4% were non-families, and 30.7% of all households were made up of individuals. The average household size was 2.30 and the average family size was 2.87. The median age was 40.9 years.[14]
The median income for a household in the county was $50,238 and the median income for a family was $65,573. Males had a median income of $44,476 versus $34,893 for females. The per capita income for the county was $25,894. About 5.8% of families and 9.7% of the population were below the poverty line, including 10.2% of those under age 18 and 4.1% of those age 65 or over.[17]
Communities
City
- Helena (county seat)
Town
Census-designated places
Unincorporated communities
- Austin[18]
- Bald Butte[19]
- Birdseye[20]
- Canyon Creek
- Canyon Ferry[21]
- Dearborn (partially within Cascade County)[22]
- Fort Harrison Army Air Park[23]
- Four Range[24]
- Frontier Town[25]
- Gearing[26]
- La Chapelle Place[27]
- Milford Colony[28]
- Nelson[29]
- Rimini[30]
- Silver City[31]
- Stoner Place[32]
- Unionville
- Weed[33]
- Wilborn[34]
- Winston[35]
- Wolf Creek
- York[36]
Notable people
- Seth Bullock, sheriff of Lewis and Clark County, later sheriff of Deadwood, South Dakota.
- Ted Kaczynski, known as the Unabomber, lived in a cabin in Lincoln from 1971 to 1996, during which time he conducted his infamous bombing campaign.
- Mike McGrath, Chief Justice of the Montana Supreme Court, former Montana Attorney General, former County Attorney of Lewis and Clark County.
- Johnny Miljus, major league baseball pitcher, retired to Fort Harrison in Lewis and Clark County.
- W. A. Boyle, president of the UMW, was born in Bald Butte, approximately two miles southwest of Marysville.
- Brian Knight, Major League Baseball umpire
- The governor of Montana, whose official residence is in the state capital of Helena.
See also
- List of lakes in Lewis and Clark County, Montana
- List of mountains in Lewis and Clark County, Montana
- List of counties in Montana
- National Register of Historic Places listings in Lewis and Clark County, Montana
References
- "State & County QuickFacts". US Census Bureau. Archived from the original on June 27, 2011. Retrieved September 15, 2013.
- "Find a County". National Association of Counties. Retrieved June 7, 2011.
- "Montana Place Names Companion". Montana Place Names From Alzada to Zortman. Montana Historical Society Research Center. Retrieved December 1, 2014.
- Gannett, Henry (1905). The Origin of Certain Place Names in the United States. U.S. Government Printing Office. p. 185.
- "2010 Census Gazetteer Files". US Census Bureau. August 22, 2012. Archived from the original on December 5, 2014. Retrieved November 28, 2014.
- Leip, David. "Atlas of US Presidential Elections". uselectionatlas.org. Retrieved April 3, 2018.
- The leading "other" candidate, Progressive Theodore Roosevelt, received 1,375 votes, while Socialist candidate Eugene Debs received 391 votes and Write-in candidate Eugene Chafin received 2 votes.
- "Population and Housing Unit Estimates". Retrieved July 13, 2020.
- "US Decennial Census". US Census Bureau. Retrieved November 28, 2014.
- "Historical Census Browser". University of Virginia Library. Retrieved November 28, 2014.
- "Population of Counties by Decennial Census: 1900 to 1990". US Census Bureau. Retrieved November 28, 2014.
- "Census 2000 PHC-T-4. Ranking Tables for Counties: 1990 and 2000" (PDF). US Census Bureau. Retrieved November 28, 2014.
- "U.S. Census website". US Census Bureau. Retrieved January 31, 2008.
- "Profile of General Population and Housing Characteristics: 2010 Demographic Profile Data". US Census Bureau. Archived from the original on February 13, 2020. Retrieved January 10, 2016.
- "Population, Housing Units, Area, and Density: 2010 - County". US Census Bureau. Archived from the original on February 13, 2020. Retrieved January 10, 2016.
- "Selected Social Characteristics in the US – 2006-2010 American Community Survey 5-Year Estimates". US Census Bureau. Archived from the original on February 13, 2020. Retrieved January 10, 2016.
- "Selected Economic Characteristics – 2006-2010 American Community Survey 5-Year Estimates". US Census Bureau. Archived from the original on February 13, 2020. Retrieved January 10, 2016.
- Austin MT Google Maps (accessed January 2, 2019)
- Bald Butte MT Google Maps (accessed 2 January 2019)
- Birdseye MT Google Maps (accessed January 2, 2019)
- Canyon Ferry MT Google Maps (accessed January 2, 2019)
- Dearborn, Lewis & Clark County MT Google Maps (accessed September 4th, 2019)
- Fort Harrison Army Air Park MT Google Maps (accessed January 2, 2019)
- Four Range MT Google Maps (accessed January 2, 2019)
- Frontier Town MT Google Maps (accessed January 2, 2019)
- Gearing MT (accessed 2 January 2019)
- La Chapelle Place MT Google Maps (accessed January 2, 2019)
- Milford Colony MT Google Maps (accessed January 2, 2019)
- Nelson MT Google Maps (accessed January 2, 2019)
- Rimini MT Google Maps (accessed January 2, 2019)
- Silver City MT Google Maps (accessed January 2, 2019)
- Stoner Place MT Google Maps (accessed January 2, 2019)
- Weed MT Google Maps (accessed January 2, 2019)
- Wilborn MT Google Maps (accessed January 2, 2019)
- Winston MT Google Maps (accessed January 2, 2019)
- York MT Google Maps (accessed January 2, 2019)
External links
Places adjacent to Lewis and Clark County, Montana | ||||||||||
|---|---|---|---|---|---|---|---|---|---|---|
| ||||||||||
Municipalities and communities of Lewis and Clark County, Montana, United States | ||
|---|---|---|
| City | Lewis and Clark County map | |
| Town | ||
| CDPs | ||
| Other unincorporated communities | ||
| Ghost town | ||
| ||
| Authority control |
|---|