Richland County, Montana
Richland County is a county in the U.S. state of Montana. As of the 2010 United States Census, the population was 9,746.[1] Its county seat is Sidney.[2]
Richland County | |
|---|---|
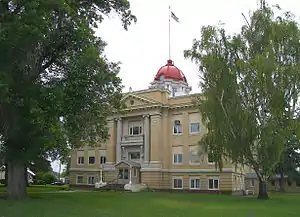 Richland County Courthouse in Sidney | |
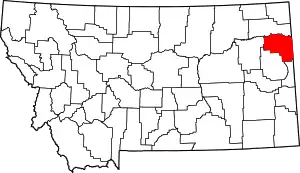 Location within the U.S. state of Montana | |
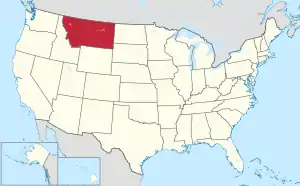 Montana's location within the U.S. | |
| Coordinates: 47°47′N 104°34′W | |
| Country | |
| State | |
| Founded | May 27, 1914 |
| Seat | Sidney |
| Largest city | Sidney |
| Area | |
| • Total | 2,103 sq mi (5,450 km2) |
| • Land | 2,084 sq mi (5,400 km2) |
| • Water | 19 sq mi (50 km2) 0.9% |
| Population (2010) | |
| • Total | 9,746 |
| • Estimate (2019) | 10,803 |
| • Density | 4.6/sq mi (1.8/km2) |
| Time zone | UTC−7 (Mountain) |
| • Summer (DST) | UTC−6 (MDT) |
| Congressional district | At-large |
| Website | www |
| |
Richland County was created by the Montana Legislature in 1914 from part of Dawson County. An early proposed name for the county was Gate, but Richland was decided upon instead as a way to entice new settlers.[3]
Geography
According to the U.S. Census Bureau, the county has a total area of 2,103 square miles (5,450 km2), of which 2,084 square miles (5,400 km2) is land and 19 square miles (49 km2) (0.9%) is water.[4]
Major highways
 Montana Highway 16
 Montana Highway 23
 Montana Highway 200
Adjacent counties
- Roosevelt County – north
- Williams County, North Dakota – northeast
- McKenzie County, North Dakota – east
- Wibaux County - south
- Dawson County – southwest
- McCone County - west
Demographics
| Historical population | |||
|---|---|---|---|
| Census | Pop. | %± | |
| 1920 | 8,989 | — | |
| 1930 | 9,633 | 7.2% | |
| 1940 | 10,209 | 6.0% | |
| 1950 | 10,366 | 1.5% | |
| 1960 | 10,504 | 1.3% | |
| 1970 | 9,837 | −6.3% | |
| 1980 | 12,243 | 24.5% | |
| 1990 | 10,716 | −12.5% | |
| 2000 | 9,667 | −9.8% | |
| 2010 | 9,746 | 0.8% | |
| 2019 (est.) | 10,803 | [5] | 10.8% |
| US Decennial Census[6] 1790-1960[7] 1900-1990[8] 1990-2000[9] 2010-2019[1] | |||
2000 census
As of the 2000 United States Census, there were 9,667 people, 3,878 households, and 2,652 families in the county. The population density was 5 people per square mile (2/km2). There were 4,557 housing units at an average density of 2 per square mile (1/km2). The racial makeup of the county was 96.57% White, 0.09% Black or African American, 1.46% Native American, 0.18% Asian, 0.01% Pacific Islander, 0.85% from other races, and 0.85% from two or more races. 2.16% of the population were Hispanic or Latino of any race. 32.3% were of German, 22.4% Norwegian, 7.2% Irish, 6.2% English and 5.4% American ancestry.
There were 3,878 households, out of which 33.60% had children under the age of 18 living with them, 57.30% were married couples living together, 7.40% had a female householder with no husband present, and 31.60% were non-families. 28.80% of all households were made up of individuals, and 12.90% had someone living alone who was 65 years of age or older. The average household size was 2.46 and the average family size was 3.04.
The county population contained 27.50% under the age of 18, 6.40% from 18 to 24, 26.80% from 25 to 44, 23.80% from 45 to 64, and 15.60% who were 65 years of age or older. The median age was 39 years. For every 100 females there were 98.70 males. For every 100 females age 18 and over, there were 94.90 males.
The median income for a household in the county was $32,110, and the median income for a family was $39,348. Males had a median income of $29,069 versus $19,203 for females. The per capita income for the county was $16,006. About 8.10% of families and 12.20% of the population were below the poverty line, including 13.90% of those under age 18 and 9.00% of those age 65 or over.
2010 census
As of the 2010 United States Census, there were 9,746 people, 4,167 households, and 2,698 families in the county.[10] The population density was 4.7 inhabitants per square mile (1.8/km2). There were 4,550 housing units at an average density of 2.2 per square mile (0.85/km2).[11] The racial makeup of the county was 95.0% white, 1.7% American Indian, 0.2% Asian, 0.1% black or African American, 0.8% from other races, and 2.1% from two or more races. Those of Hispanic or Latino origin made up 3.0% of the population.[10] In terms of ancestry, 37.8% were German, 23.1% were Norwegian, 13.0% were Irish, 8.7% were American, and 6.5% were English.[12]
Of the 4,167 households, 28.9% had children under the age of 18 living with them, 51.9% were married couples living together, 7.6% had a female householder with no husband present, 35.3% were non-families, and 29.8% of all households were made up of individuals. The average household size was 2.33 and the average family size was 2.88. The median age was 41.3 years.[10]
The median income for a household in the county was $52,516 and the median income for a family was $60,236. Males had a median income of $44,788 versus $23,135 for females. The per capita income for the county was $26,888. About 10.2% of families and 13.5% of the population were below the poverty line, including 16.6% of those under age 18 and 14.4% of those age 65 or over.[13]
Economy
Although most of the surface land of the county is devoted to ranching, oil exploration and production became important elements of the county's economy beginning with the discovery in 2000 of Elm Coulee Oil Field, part of the Bakken formation.[14]
Politics
Richland County voters have been reliably Republican, opting only one time for the Democratic Party candidate in national elections since 1948 (as of 2016).
| Year | Republican | Democratic | Third parties |
|---|---|---|---|
| 2020 | 82.8% 4,800 | 15.1% 875 | 2.1% 123 |
| 2016 | 80.2% 3,908 | 13.8% 671 | 6.0% 292 |
| 2012 | 75.5% 3,510 | 21.6% 1,002 | 2.9% 136 |
| 2008 | 70.5% 3,184 | 26.6% 1,203 | 2.9% 129 |
| 2004 | 72.2% 3,110 | 26.0% 1,120 | 1.8% 78 |
| 2000 | 70.9% 2,858 | 25.2% 1,018 | 3.9% 157 |
| 1996 | 44.2% 2,021 | 35.3% 1,614 | 20.4% 933 |
| 1992 | 37.1% 1,760 | 30.3% 1,440 | 32.6% 1,548 |
| 1988 | 57.8% 2,628 | 40.1% 1,824 | 2.1% 94 |
| 1984 | 72.9% 3,847 | 26.2% 1,382 | 1.0% 52 |
| 1980 | 66.5% 3,348 | 24.9% 1,252 | 8.7% 438 |
| 1976 | 51.4% 2,189 | 46.0% 1,961 | 2.7% 113 |
| 1972 | 61.5% 2,645 | 33.4% 1,438 | 5.1% 217 |
| 1968 | 59.3% 2,381 | 34.8% 1,399 | 5.9% 236 |
| 1964 | 43.2% 1,784 | 56.2% 2,320 | 0.7% 27 |
| 1960 | 56.1% 2,395 | 43.6% 1,863 | 0.3% 11 |
| 1956 | 55.7% 2,366 | 44.3% 1,884 | 0.0% 0 |
| 1952 | 67.3% 2,506 | 32.1% 1,196 | 0.6% 23 |
| 1948 | 43.1% 1,332 | 54.1% 1,673 | 2.8% 85 |
| 1944 | 42.6% 1,347 | 56.2% 1,777 | 1.2% 37 |
| 1940 | 41.1% 1,497 | 57.5% 2,095 | 1.5% 53 |
| 1936 | 29.0% 1,066 | 68.4% 2,516 | 2.6% 95 |
| 1932 | 39.0% 1,216 | 56.7% 1,768 | 4.2% 132 |
| 1928 | 63.5% 1,648 | 35.4% 917 | 1.1% 29 |
| 1924 | 50.0% 926 | 12.8% 238 | 37.2% 690 |
| 1920 | 65.5% 1,759 | 27.7% 744 | 6.9% 184 |
| 1916 | 36.5% 1,223 | 58.1% 1,947 | 5.4% 180 |
See also
- List of lakes in Richland County, Montana
- List of mountains in Richland County, Montana
- National Register of Historic Places listings in Richland County MT
References
- "State & County QuickFacts". US Census Bureau. Retrieved September 16, 2013.
- "Find a County". National Association of Counties. Archived from the original on May 31, 2011. Retrieved June 7, 2011.
- "Montana Place Names Companion". Montana Place Names From Alzada to Zortman. Montana Historical Society Research Center. Retrieved May 9, 2011.
- "2010 Census Gazetteer Files". US Census Bureau. August 22, 2012. Archived from the original on December 5, 2014. Retrieved November 29, 2014.
- "Population and Housing Unit Estimates". Retrieved October 25, 2020.
- "US Decennial Census". US Census Bureau. Retrieved November 29, 2014.
- "Historical Census Browser". University of Virginia Library. Retrieved November 29, 2014.
- "Population of Counties by Decennial Census: 1900 to 1990". US Census Bureau. Retrieved November 29, 2014.
- "Census 2000 PHC-T-4. Ranking Tables for Counties: 1990 and 2000" (PDF). US Census Bureau. Retrieved November 29, 2014.
- "Profile of General Population and Housing Characteristics: 2010 Demographic Profile Data". US Census Bureau. Archived from the original on February 13, 2020. Retrieved January 10, 2016.
- "Population, Housing Units, Area, and Density: 2010 - County". US Census Bureau. Archived from the original on February 13, 2020. Retrieved January 10, 2016.
- "Selected Social Characteristics in the US – 2006-2010 American Community Survey 5-Year Estimates". US Census Bureau. Archived from the original on February 13, 2020. Retrieved January 10, 2016.
- "Selected Economic Characteristics – 2006-2010 American Community Survey 5-Year Estimates". US Census Bureau. Archived from the original on February 13, 2020. Retrieved January 10, 2016.
- Browning, Gil. "Montana's Vast Untapped Oil Reserves". Archived from the original on February 23, 2014. Retrieved February 10, 2014.
- Leip, David. "US Presidential Elections". uselectionatlas.org. Retrieved April 3, 2018.
- Andes MT Google Maps (accessed January 5, 2019)
- Enid MT Google Maps (accessed January 5, 2019)
- Nohly MT Google Maps (accessed January 5, 2019)
- Ridgelawn MT Google Maps (accessed January 5, 2019)
- Sioux Pass MT Google Maps (accessed January 5, 2019)
Places adjacent to Richland County, Montana | ||||||||||
|---|---|---|---|---|---|---|---|---|---|---|
| ||||||||||
Municipalities and communities of Richland County, Montana, United States | ||
|---|---|---|
| City | Richland County map | |
| Town | ||
| CDPs | ||
| Unincorporated communities | ||
| Ghost town | ||
| Indian reservation | ||
| Footnotes | ‡This populated place also has portions in an adjacent county or counties | |
| ||
| Authority control |
|---|