Missoula County, Montana
Missoula County /mɪˈzuːlə/ (![]() listen) is located in the State of Montana. As of the 2010 United States Census, the population was 109,426,[1] making it Montana's second-most populous county. Its county seat and largest city is Missoula.[2] The county was founded in 1860.[3]
listen) is located in the State of Montana. As of the 2010 United States Census, the population was 109,426,[1] making it Montana's second-most populous county. Its county seat and largest city is Missoula.[2] The county was founded in 1860.[3]
Missoula County | |
|---|---|
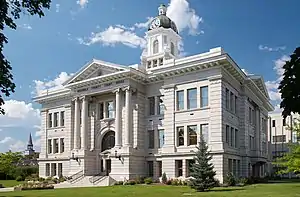 Missoula County Courthouse | |
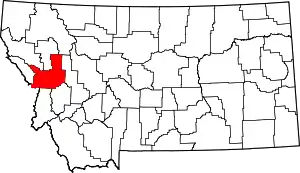 Location within the U.S. state of Montana | |
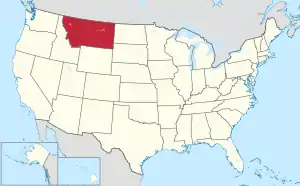 Montana's location within the U.S. | |
| Coordinates: 47°02′N 113°56′W | |
| Country | |
| State | |
| Founded | December 14, 1860 |
| Seat | Missoula |
| Largest city | Missoula |
| Area | |
| • Total | 2,618 sq mi (6,780 km2) |
| • Land | 2,593 sq mi (6,720 km2) |
| • Water | 25 sq mi (60 km2) 1.0% |
| Population (2010) | |
| • Total | 109,426 |
| • Estimate (2019) | 119,600 |
| • Density | 42/sq mi (16/km2) |
| Time zone | UTC−7 (Mountain) |
| • Summer (DST) | UTC−6 (MDT) |
| Congressional district | At-large |
| Website | www |
| |
Missoula County comprises the Missoula, MT Metropolitan Statistical Area.
History
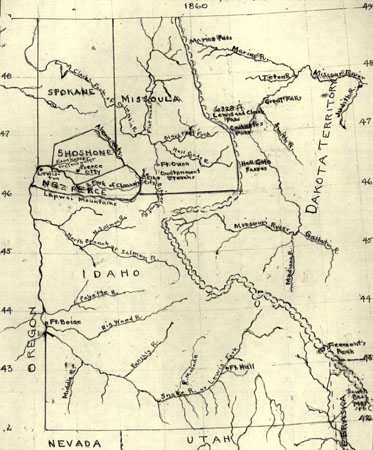
Missoula County, Washington Territory was incorporated in 1860, when this area was still part of Washington Territory.[4][3] Missoula County encompassed present-day Missoula and Deer Lodge Counties, as well as a large area of land north and south of present-day Missoula County. Hell Gate Town, the county seat, was at the confluence of the Clark Fork and Bitterroot Rivers.
The area encompassing today's Missoula County became part of the United States as a result of Oregon Treaty of June 14, 1846. It was part of the Oregon Territory's Clark County, which replaced the District of Vancouver September 3, 1844. The territory was divided on March 2, 1853 with Clark County becoming part of the new Washington Territory. Clark County was divided the next year to create Skamania County, which a month later was divided to create Walla Walla County, which was further divided in 1858 to create Spokane County.[5] On December 14, 1860, Missoula County was carved out of Spokane County with the first county seat at Hell Gate. The county made up the region between modern-day Idaho and the Continental Divide north of the 46th parallel.[6] When Idaho Territory was created in 1863 it adopted Missoula County as the territory's 3rd county on January 16, 1864 with more or less the same boundaries and Wordensville (present Missoula) established as the county seat.[7][8] This first county consisted of all or part of current Ravalli, Missoula, Granite, Deer Lodge, Silver Bow, Powell, Mineral, Lake, Sanders, Lincoln, Flathead, and Glacier Counties.
Missoula County became a part of Montana Territory when the territory was organized out of the existing Idaho Territory by Act of Congress and signed into law by President Abraham Lincoln on May 26, 1864. At this time Deer Lodge County (today Deer Lodge, Granite, Silver Bow, and Powell Counties) was cut out of Missoula.[9] The creation of Flathead (today Flathead and Lincoln Counties) and Ravalli Counties in 1893, Powell in 1901, Sanders in 1905, Mineral in 1914 and finally Lake County in 1923 gave Missoula its present borders.[10]
Geography
According to the US Census Bureau, the county has a total area of 2,618 square miles (6,780 km2), of which 2,593 square miles (6,720 km2) is land and 25 square miles (65 km2) (1.0%) is water.[11] It is the 24th largest county in Montana.
Geographic features
Five large valleys and two major rivers wind through this mountainous region.
Flora and fauna
Located in the Northern Rockies, Missoula County has a typical Rocky Mountain ecology. Local wildlife includes white-tailed deer, black bears, osprey, and bald eagles. During the winter months, rapid snow melt on Mount Jumbo due to its steep slope leaves grass available for grazing elk and mule deer. The rivers around Missoula provide nesting habitats for bank swallows, northern rough-winged swallows and belted kingfishers. Killdeer and spotted sandpipers can be seen foraging insects along the gravel bars. Other species include song sparrows, catbirds, several species of warblers, and the pileated woodpecker. The rivers also provide cold, clean water for native fish such as westslope cutthroat trout and bull trout. The meandering streams also attract beaver and wood ducks.[12]
Native riparian plant life includes sandbar willows and cottonwoods, and Montana's state tree, the ponderosa pine. Other native plants include wetland species such as cattails and beaked-sedge as well as shrubs and berry plants like Douglas hawthorn, chokecherry, and western snowberries.[12] Missoula is also home to several noxious weeds which multiple programs have tried to eliminate. Notable ones include Dalmatian toadflax, spotted knapweed, leafy spurge, St. John's wort, and sulfur cinquefoil.[13] The Norway maples that line many of Missoula's older streets have also been declared an invasive species.[14]
Climate
Missoula County has a semi-arid climate (Köppen climate classification BSk), with cold and moderately snowy winters, hot and dry summers, and spring and autumn are short and crisp in between. Winter conditions are usually far milder than much of the rest of the state due to its western position within the state. However the mildness is also induced by the dampness, as unlike much of the rest of the state, precipitation is not at a strong minimum during winter. Winter snowfall averages 43 inches (109 cm), with most years seeing very little of it from April to October. Summers see very sunny conditions, with highs peaking at 84 °F (28.9 °C) in July. However, temperature differences between day and night are large during this time and from April to October, due to the relative aridity.[15][16]
| Climate data for Missoula, Montana (Missoula Airport) | |||||||||||||
|---|---|---|---|---|---|---|---|---|---|---|---|---|---|
| Month | Jan | Feb | Mar | Apr | May | Jun | Jul | Aug | Sep | Oct | Nov | Dec | Year |
| Record high °F (°C) | 60 (16) |
66 (19) |
78 (26) |
90 (32) |
95 (35) |
102 (39) |
107 (42) |
105 (41) |
99 (37) |
85 (29) |
73 (23) |
60 (16) |
107 (42) |
| Average high °F (°C) | 33.2 (0.7) |
38.8 (3.8) |
49.8 (9.9) |
58.5 (14.7) |
67.3 (19.6) |
75.2 (24.0) |
85.9 (29.9) |
84.9 (29.4) |
73.1 (22.8) |
57.8 (14.3) |
41.5 (5.3) |
31.0 (−0.6) |
58.2 (14.6) |
| Average low °F (°C) | 18.3 (−7.6) |
21.2 (−6.0) |
27.7 (−2.4) |
32.8 (0.4) |
39.8 (4.3) |
46.6 (8.1) |
51.4 (10.8) |
50.1 (10.1) |
41.8 (5.4) |
32.4 (0.2) |
24.9 (−3.9) |
16.7 (−8.5) |
33.7 (0.9) |
| Record low °F (°C) | −33 (−36) |
−28 (−33) |
−13 (−25) |
2 (−17) |
21 (−6) |
26 (−3) |
31 (−1) |
29 (−2) |
15 (−9) |
−4 (−20) |
−23 (−31) |
−30 (−34) |
−33 (−36) |
| Average precipitation inches (mm) | 0.85 (22) |
0.70 (18) |
1.00 (25) |
1.22 (31) |
2.01 (51) |
2.07 (53) |
0.99 (25) |
1.19 (30) |
1.17 (30) |
0.88 (22) |
1.01 (26) |
1.04 (26) |
14.13 (359) |
| Average snowfall inches (cm) | 8.3 (21) |
6.1 (15) |
5.1 (13) |
1.2 (3.0) |
0.2 (0.51) |
— | 0.0 (0.0) |
0.0 (0.0) |
— | 0.6 (1.5) |
5.4 (14) |
11.0 (28) |
37.9 (96) |
| Average precipitation days (≥ 0.01 in) | 11.8 | 9.4 | 11.4 | 11.1 | 12.3 | 12.1 | 7.1 | 7.5 | 8.2 | 8.4 | 11.1 | 12.3 | 122.7 |
| Average snowy days (≥ 0.1 in) | 9.4 | 6.8 | 5.1 | 1.6 | 0.3 | 0.1 | 0.0 | 0.0 | 0.0 | 0.9 | 5.4 | 9.8 | 39.4 |
| Average relative humidity (%) | 81.3 | 78.1 | 70.3 | 61.2 | 61.7 | 61.1 | 51.7 | 52.5 | 62.8 | 70.8 | 80.2 | 83.5 | 67.9 |
| Mean monthly sunshine hours | 95.8 | 133.0 | 209.3 | 245.0 | 280.5 | 311.1 | 389.3 | 334.8 | 264.7 | 194.3 | 99.5 | 82.9 | 2,640.2 |
| Percent possible sunshine | 34 | 46 | 57 | 60 | 60 | 66 | 81 | 76 | 70 | 58 | 35 | 31 | 59 |
| Source: NOAA (normals 1981−2010, relative humidity and sun 1961–1990)[17][18][19] | |||||||||||||
National protected areas
Adjacent counties
- Mineral County - west
- Sanders County - northwest
- Lake County - north
- Flathead County - northeast
- Powell County - east
- Granite County - southeast
- Ravalli County - south
- Idaho County, Idaho - southwest/Pacific Time Border
- Clearwater County, Idaho - southwest/Pacific Time Border
Demographics
| Historical population | |||
|---|---|---|---|
| Census | Pop. | %± | |
| 1870 | 2,554 | — | |
| 1880 | 2,537 | −0.7% | |
| 1890 | 14,427 | 468.7% | |
| 1900 | 13,964 | −3.2% | |
| 1910 | 23,596 | 69.0% | |
| 1920 | 24,041 | 1.9% | |
| 1930 | 21,782 | −9.4% | |
| 1940 | 29,038 | 33.3% | |
| 1950 | 35,493 | 22.2% | |
| 1960 | 44,663 | 25.8% | |
| 1970 | 58,263 | 30.5% | |
| 1980 | 76,016 | 30.5% | |
| 1990 | 78,687 | 3.5% | |
| 2000 | 95,802 | 21.8% | |
| 2010 | 109,426 | 14.2% | |
| 2019 (est.) | 119,600 | [20] | 9.3% |
| US Decennial Census[21] 1790-1960[22] 1900-1990[23] 1990-2000[24] 2010-2019[1] | |||
2000 census
As of the 2000 United States Census,[25] there were 95,802 people, 38,439 households, and 23,140 families in Missoula County. The population density was 37 people per square mile (14/km2). There were 41,319 housing units at an average density of 16 per square mile (6/km2). The racial makeup of the county was:
- 94.02% White
- 0.27% Black or African American
- 2.29% Native American
- 1.02% Asian
- 0.08% Pacific Islander
- 0.45% from other races
- 1.86% from two or more races.
1.61% of the population were Hispanic or Latino of any race. 22.7% were of German, 13.0% Irish, 10.4% English, 8.5% Norwegian and 5.6% American ancestry.
There were 38,439 households, out of which 29.20% had children under the age of 18 living with them, 47.40% were married couples living together, 9.20% had a female householder with no husband present, and 39.80% were non-families. 28.00% of all households were made up of individuals, and 7.50% had someone living alone who was 65 years of age or older. The average household size was 2.40 and the average family size was 2.96.
The county population contained 22.90% under the age of 18, 15.40% from 18 to 24, 29.20% from 25 to 44, 22.60% from 45 to 64, and 10.00% who were 65 years of age or older. The median age was 33 years. For every 100 females there were 99.90 males. For every 100 females age 18 and over, there were 98.00 males.
The median income for a household in the county was $34,454, and the median income for a family was $44,865. Males had a median income of $31,605 versus $21,720 for females. The per capita income for the county was $17,808. About 8.80% of families and 14.80% of the population were below the poverty line, including 14.60% of those under age 18 and 8.20% of those age 65 or over.
2010 census
As of the 2010 United States Census, there were 109,299 people, 45,926 households, and 25,931 families residing in the county.[26] The population density was 42.1 inhabitants per square mile (16.3/km2). There were 50,106 housing units at an average density of 19.3 per square mile (7.5/km2).[27] The racial makeup of the county was 92.7% white, 2.6% American Indian, 1.1% Asian, 0.4% black or African American, 0.1% Pacific islander, 0.4% from other races, and 2.6% from two or more races. Those of Hispanic or Latino origin made up 2.6% of the population.[26] In terms of ancestry, 26.1% were German, 17.8% were Irish, 12.3% were English, 7.3% were Norwegian, and 5.4% were American.[28]
Of the 45,926 households, 26.5% had children under the age of 18 living with them, 42.9% were married couples living together, 9.2% had a female householder with no husband present, 43.5% were non-families, and 30.3% of all households were made up of individuals. The average household size was 2.30 and the average family size was 2.88. The median age was 34.3 years.[26]
The median income for a household in the county was $42,887 and the median income for a family was $58,302. Males had a median income of $39,603 versus $30,069 for females. The per capita income for the county was $24,343. About 8.8% of families and 17.3% of the population were below the poverty line, including 14.9% of those under age 18 and 8.8% of those age 65 or over.[29]
Economy
Missoula County has a diverse economy as a growing regional trade center with several major employers such as the University of Montana, regional hospitals, and the U.S. Forest Service each employing thousands. However, 90% of wage and salary workers work for small businesses with under 20 workers with a quarter of them self-employed.[30]
Law and government
Missoula County is governed by a Board of County Commissioners of three members; each serving six-year terms staggered so as to have one election every two years. The commission has authority over all legislative, executive, and administrative issues throughout the county not specifically reserved by law or ordinance to other elected officials.[31]
Originally a swing county, Missoula County has voted reliably Democratic since 2004. In fact, it has only voted Republican only once since 1988 (although it was by a surprising 9% margin thanks to Ralph Nader getting 10% of the vote). This is most likely thanks to the city of Missoula being home to the University of Montana.
| Year | Republican | Democratic | Third parties |
|---|---|---|---|
| 2020 | 36.9% 26,347 | 60.6% 43,357 | 2.5% 1,795 |
| 2016 | 36.6% 22,250 | 52.0% 31,543 | 11.4% 6,929 |
| 2012 | 39.6% 22,652 | 57.4% 32,824 | 3.1% 1,756 |
| 2008 | 35.0% 20,743 | 61.6% 36,531 | 3.4% 2,003 |
| 2004 | 45.7% 23,989 | 51.4% 26,983 | 2.8% 1,482 |
| 2000 | 46.1% 21,474 | 37.0% 17,241 | 16.9% 7,861 |
| 1996 | 36.1% 16,034 | 49.3% 21,874 | 14.6% 6,474 |
| 1992 | 29.8% 12,898 | 47.0% 20,347 | 23.2% 10,054 |
| 1988 | 44.8% 15,965 | 53.8% 19,178 | 1.5% 526 |
| 1984 | 53.5% 19,777 | 44.8% 16,540 | 1.7% 620 |
| 1980 | 46.7% 16,161 | 37.9% 13,115 | 15.4% 5,318 |
| 1976 | 51.4% 16,350 | 47.4% 15,099 | 1.2% 388 |
| 1972 | 51.8% 15,557 | 45.9% 13,784 | 2.4% 708 |
| 1968 | 48.0% 9,745 | 41.4% 8,398 | 10.6% 2,149 |
| 1964 | 38.4% 8,065 | 61.4% 12,900 | 0.2% 39 |
| 1960 | 53.8% 10,396 | 45.9% 8,876 | 0.3% 65 |
| 1956 | 61.1% 10,627 | 38.9% 6,760 | 0.0% 0 |
| 1952 | 59.0% 10,053 | 40.5% 6,901 | 0.5% 87 |
| 1948 | 46.3% 6,426 | 50.5% 7,005 | 3.2% 442 |
| 1944 | 48.7% 5,371 | 50.4% 5,558 | 0.9% 99 |
| 1940 | 41.7% 5,640 | 57.2% 7,747 | 1.1% 150 |
| 1936 | 25.0% 2,697 | 71.2% 7,690 | 3.9% 416 |
| 1932 | 39.7% 3,819 | 54.5% 5,242 | 5.8% 555 |
| 1928 | 59.7% 5,056 | 38.9% 3,291 | 1.4% 120 |
| 1924 | 29.4% 2,386 | 12.5% 1,012 | 58.1% 4,706 |
| 1920 | 52.6% 4,374 | 39.6% 3,292 | 7.8% 648 |
| 1916 | 38.7% 2,926 | 53.8% 4,069 | 7.5% 568 |
| 1912 | 12.6% 589 | 32.7% 1,523 | 54.7% 2,546 |
| 1908 | 46.2% 1,856 | 44.3% 1,780 | 9.6% 386 |
| 1904 | 59.9% 2,239 | 26.7% 996 | 13.5% 503 |
| 1900 | 41.9% 1,392 | 56.9% 1,893 | 1.2% 41 |
| 1896 | 13.9% 365 | 85.9% 2,259 | 0.2% 6 |
| 1892 | 39.8% 2,045 | 45.6% 2,340 | 14.6% 751 |
Education
School districts
Missoula County is home to 18 school districts (13 Elementary, 2 Secondary, and 3 Unified).[34]
|
Elementary
|
Secondary
Unified
|
Colleges and universities
Missoula County is home to the University of Montana and the University of Montana College of Technology.
See also
- List of lakes in Missoula County, Montana
- List of mountains in Missoula County, Montana
- National Register of Historic Places listings in Missoula County, Montana
References
- "State & County QuickFacts". US Census Bureau. Archived from the original on July 3, 2011. Retrieved September 15, 2013.
- "Find a County". National Association of Counties. Retrieved June 7, 2011.
- "Montana Place Names Companion". Montana Place Names From Alzada to Zortman. Montana Historical Society Research Center. Retrieved December 1, 2014.
- "Act of Congress Admitting Oregon to the Union". Oregon Blue Book. February 14, 1859.
- Contributions, with transactions, Volume (1895)2. "Sketch by Judge Frank H. Woody". Montana Historical Society.
- Missoula County 1860
- "An Act Establishing Counties, County Boundaries, and County Seats East of the Bitter Root Mountains" Idaho Territory Session Laws: 1863-1864 pp. 674-677
- Washington, Oregon and Idaho Map 1863
- LLC., Historic Map Works. "Montana 1865 Wall Map 17x22, Atlas: Montana 1865 Wall Map, Montana Historical Map". www.historicmapworks.com. Retrieved April 3, 2018.
- "Montana History Wiki". Archived from the original on April 27, 2012. Retrieved February 4, 2012.
- "2010 Census Gazetteer Files". US Census Bureau. August 22, 2012. Archived from the original on December 5, 2014. Retrieved November 29, 2014.
- "Missoula Conservation Lands Management Plan". Missoula Parks and Recreation. June 1, 2010. Retrieved February 8, 2012.
- UM Natural Areas: Integrated Plant Management Program Archived June 5, 2010, at the Wayback Machine
- Chaney, Rob (September 28, 2011). "City sees some success removing Norway maples from Greenough Park". Missoulian.com. Retrieved January 28, 2012.
- "Station Information Data Sheet - Missoula, Montana". NOAA. January 1998. Archived from NOAA the original Check
|url=value (help) on July 24, 2014. Retrieved January 28, 2012. - "Climatography of the United States No. 20 1971–2000" (PDF). NOAA. February 2004. Archived from the original (PDF) on February 12, 2015. Retrieved January 28, 2012.
- "NowData-NOAA Online Weather Data". National Oceanic and Atmospheric Administration (NOAA). Retrieved September 10, 2015.
- "MT Missoula INTL AP". NOAA. Retrieved September 10, 2015.
- "WMO Climate Normals for Missoula/Johnson–Bell Field, MT 1961–1990". NOAA. Retrieved September 10, 2015.
- "Population and Housing Unit Estimates". Retrieved May 21, 2020.
- "US Decennial Census". US Census Bureau. Retrieved November 29, 2014.
- "Historical Census Browser". University of Virginia Library. Retrieved November 29, 2014.
- "Population of Counties by Decennial Census: 1900 to 1990". US Census Bureau. Retrieved November 29, 2014.
- "Census 2000 PHC-T-4. Ranking Tables for Counties: 1990 and 2000" (PDF). US Census Bureau. Retrieved November 29, 2014.
- "U.S. Census website". US Census Bureau]]. Retrieved January 31, 2008.
- "Profile of General Population and Housing Characteristics: 2010 Demographic Profile Data". US Census Bureau. Archived from the original on February 13, 2020. Retrieved January 10, 2016.
- "Population, Housing Units, Area, and Density: 2010 - County". US Census Bureau. Archived from the original on February 13, 2020. Retrieved January 10, 2016.
- "Selected Social Characteristics in the US – 2006-2010 American Community Survey 5-Year Estimates". US Census Bureau. Archived from the original on February 13, 2020. Retrieved January 10, 2016.
- "Selected Economic Characteristics – 2006-2010 American Community Survey 5-Year Estimates". US Census Bureau. Archived from the original on February 13, 2020. Retrieved January 10, 2016.
- The People, Economy, Land, and Resources of Missoula County and Potential Vulnerabilities to Climate Change
- Missoula County Board of County Commissioners
- Leip, David. "Atlas of US Presidential Elections". uselectionatlas.org. Retrieved April 3, 2018.
- Burnham, Walter Dean. "Presidential ballots, 1836-1892". archive.org. Retrieved January 16, 2021.
- School District Reference Maps (2010 Census) - Montana
- Clearwater MT Google Maps (accessed 3 January 2019)
- Coloma MT Google Maps (accessed 3 January 2019)
- Greenough MT Google Maps (accessed 3 January 2019)
- Nagos MT Google MT (accessed 3 January 2019)
- Ninemile MT Google Maps (accessed 3 January 2019)
- Potomac MT Google Maps (accessed 3 January 2019)
- Sunset MT Google Maps (accessed 3 January 2019)
- Twin Creeks MT Google Maps (accessed 3 January 2019)
- Westview Park MT Google Maps (accessed 3 January 2019)
- Yreka MT Google Maps (accessed 3 January 2019)
External links
| Wikisource has the text of the 1879 American Cyclopædia article Missoula. |
- Missoula County official website
- Missoula County (Mont.) Records, 1888-1963 (University of Montana Archives)
Places adjacent to Missoula County, Montana | ||||||||||
|---|---|---|---|---|---|---|---|---|---|---|
| ||||||||||
Municipalities and communities of Missoula County, Montana, United States | ||
|---|---|---|
| City | Missoula County map | |
| CDPs | ||
| Unincorporated communities | ||
| Ghost towns | ||
| Indian reservation | ||
| Footnotes | ‡This populated place also has portions in an adjacent county or counties | |
| ||
| Authority control |
|---|