2000 Japanese general election
Elections to the Shugi-In (House of Representatives) of the Japanese Diet were held on 25 June 2000.
| |||||||||||||||||||||||||||||||||||||||||||||||||||||||||||||||||||||||||||||||||||||||||||||||||||||||||||||||||||||||||||||||||||||||||||||
All 480 seats to the House of Representatives of Japan 241 seats needed for a majority | |||||||||||||||||||||||||||||||||||||||||||||||||||||||||||||||||||||||||||||||||||||||||||||||||||||||||||||||||||||||||||||||||||||||||||||
|---|---|---|---|---|---|---|---|---|---|---|---|---|---|---|---|---|---|---|---|---|---|---|---|---|---|---|---|---|---|---|---|---|---|---|---|---|---|---|---|---|---|---|---|---|---|---|---|---|---|---|---|---|---|---|---|---|---|---|---|---|---|---|---|---|---|---|---|---|---|---|---|---|---|---|---|---|---|---|---|---|---|---|---|---|---|---|---|---|---|---|---|---|---|---|---|---|---|---|---|---|---|---|---|---|---|---|---|---|---|---|---|---|---|---|---|---|---|---|---|---|---|---|---|---|---|---|---|---|---|---|---|---|---|---|---|---|---|---|---|---|---|
| Turnout | 64.45% ( | ||||||||||||||||||||||||||||||||||||||||||||||||||||||||||||||||||||||||||||||||||||||||||||||||||||||||||||||||||||||||||||||||||||||||||||
| |||||||||||||||||||||||||||||||||||||||||||||||||||||||||||||||||||||||||||||||||||||||||||||||||||||||||||||||||||||||||||||||||||||||||||||
.svg.png.webp) Parliamentary districts won by ■ - LDP
■ - DPJ
■ - Kōmeitō
■ - LP
■ - CP
■ - SDP | |||||||||||||||||||||||||||||||||||||||||||||||||||||||||||||||||||||||||||||||||||||||||||||||||||||||||||||||||||||||||||||||||||||||||||||
| |||||||||||||||||||||||||||||||||||||||||||||||||||||||||||||||||||||||||||||||||||||||||||||||||||||||||||||||||||||||||||||||||||||||||||||

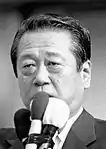


The ruling Liberal Democratic Party (LDP) maintained a majority in the House of Representatives, but its total percentage of seats shrank from 65% to 56%, and its two coalition partners also lost several seats. Two cabinet members, Takashi Fukaya and Tokuichiro Tamazawa, lost their seats. The Democratic Party made major gains under the leadership of Yukio Hatoyama.[1]
Background
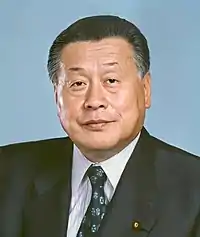
Prime Minister Keizo Obuchi suffered a stroke in April 2000 and was replaced by Yoshiro Mori. Although the term limit for the House of Representatives would have been reached in October 2000, Mori dissolved the House on June 2 in what became popularly known as the Divine Nation Dissolution (神の国解散) due to a controversial statement by Mori prior to the election, which preceded a slump in government approval ratings from 40% to 20%. The LDP government advocated continued public works spending while the opposition advocated less spending and more governmental reforms.[2]
The Social Democratic Party left the coalition in 1998 and re-join the opposition after years of coalition with the ideologically contrasting LDP.
Meanwhile, the Komeito Party, a centrist party with roots from the Soka Gakkai based on the Nichiren Buddhist movement and despite almost decades of opposition against the LDP, shifted from centre towards conservatism. An electoral alliance between the once rivals of the Komeito and the LDP has been in affect since the Japanese General election in 2000. For the LDP, despite not being able to win an absolute majority of votes by itself in further elections (especially for the House of Councillors which the LDP lost majority since 1989), the Komeito party has been counted on since then to ensure a stable governing majority rule.
Results
The House of Representatives consisted of 480 members, 300 elected from single-member constituencies and 180 elected on a proportional basis from eleven multi-member constituencies known as Block constituencies.
| Alliances and parties | Local constituency vote | PR block vote | Total seats | +/− | |||||
|---|---|---|---|---|---|---|---|---|---|
| Votes[5] | % | Seats | Votes | % | Seats | ||||
| Liberal Democratic Party (LDP) | 24,945,806 | 40.97% | 177 | 16,943,425 | 28.31% | 56 | 233 | ||
| Kōmeitō | 1,231,753 | 2.02% | 7 | 7,762,032 | 12.97% | 24 | 31 | ||
| Conservative Party | 1,230,464 | 2.02% | 7 | 247,334 | 0.41% | 0 | 7 | ||
| Reform Club | 203,736 | 0.33% | 0 | – | 0 | ||||
| Ruling coalition | 27,611,760 | 45.35% | 191 | 24,952,791 | 41.70% | 80 | 271 | ||
| Democratic Party (DPJ) | 16,811,732 | 27.61% | 80 | 15,067,990 | 25.18% | 47 | 127 | ||
| Liberal Party | 2,053,736 | 3.37% | 4 | 6,589,490 | 11.01% | 18 | 22 | ||
| Japan Communist Party (JCP) | 7,352,844 | 12.08% | 0 | 6,719,016 | 11.23% | 20 | 20 | ||
| Social Democratic Party (SDP) | 2,315,235 | 3.80% | 4 | 5,603,680 | 9.36% | 15 | 19 | ||
| Assembly of Independents | 652,138 | 1.07% | 5 | 151,345 | 0.25% | 0 | 5 | ||
| Liberal League (LL) | 1,071,012 | 1.76% | 1 | 660,724 | 1.10% | 0 | 1 | ||
| Others | 46,945 | 0.08% | 0 | 99,565[6] | 0.17% | 0 | 0 | ||
| Opposition parties | 30,243,642 | 49.78% | 94 | 34,891,810 | 58.30% | 100 | 194 | ||
| Independents | 2,967,069 | 4.87% | 15 | – | 15 | ||||
| Totals | 60,822,471 | 100.00% | 300 | 59,844,601 | 100.00% | 180 | 480 | (PR blocks: -20, 1 vacant seat) | |
| Turnout | 64.45% (+4.8) | 62.49% (+2.87) | – | ||||||
References
- French, Howard (26 June 2000). "GOVERNING PARTY IN JAPAN SUFFERS ELECTION SETBACK". New York Times. Retrieved 27 January 2014.
- "JAPAN Parliamentary Chamber: Shugiin ELECTIONS HELD IN 2000". IPU.org. Retrieved 27 January 2014.
- Ministry of Internal Affairs and Communications (MIC), Statistics Department, Long-term statistics, chapter 27: Public servants and elections, sections 27-7 to 27-10 Elections for the House of Representatives
- National Diet Library/MIC: Results of the 42nd House of Representatives election
- Fractional votes rounded to full numbers
- Socialist Party
| General elections | |
|---|---|
| Councillors elections | |
| Unified local elections | |
| Supreme Court retention elections |
|
| |