1990 Japanese general election
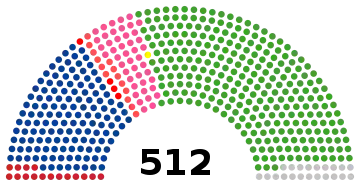
Japan held a nationwide election for the House of Representatives, the more powerful lower house of the National Diet than the upper house, on February 18, 1990.
| ||||||||||||||||||||||||||||||||||||||||||||||||||||||||||||||||||||||||||||||||||||||||||||||||||||||||||||||||||||
All 512 seats to the House of Representatives of Japan 257 seats needed for a majority | ||||||||||||||||||||||||||||||||||||||||||||||||||||||||||||||||||||||||||||||||||||||||||||||||||||||||||||||||||||
|---|---|---|---|---|---|---|---|---|---|---|---|---|---|---|---|---|---|---|---|---|---|---|---|---|---|---|---|---|---|---|---|---|---|---|---|---|---|---|---|---|---|---|---|---|---|---|---|---|---|---|---|---|---|---|---|---|---|---|---|---|---|---|---|---|---|---|---|---|---|---|---|---|---|---|---|---|---|---|---|---|---|---|---|---|---|---|---|---|---|---|---|---|---|---|---|---|---|---|---|---|---|---|---|---|---|---|---|---|---|---|---|---|---|---|---|---|
| Turnout | 73.31% ( | |||||||||||||||||||||||||||||||||||||||||||||||||||||||||||||||||||||||||||||||||||||||||||||||||||||||||||||||||||
| ||||||||||||||||||||||||||||||||||||||||||||||||||||||||||||||||||||||||||||||||||||||||||||||||||||||||||||||||||||
.svg.png.webp) | ||||||||||||||||||||||||||||||||||||||||||||||||||||||||||||||||||||||||||||||||||||||||||||||||||||||||||||||||||||
| ||||||||||||||||||||||||||||||||||||||||||||||||||||||||||||||||||||||||||||||||||||||||||||||||||||||||||||||||||||
 |
|---|
| This article is part of a series on the politics and government of Japan |
|
|
Results
| Alliances and parties | Votes | % | +/- | Total seats | +/- | ||
|---|---|---|---|---|---|---|---|
| Liberal Democratic Party (LDP) Jiyū Minshutō | 30,315,417 | 46.14% | 275 | -25 | |||
| Socialist Party of Japan (JSP) Nihon Shakai-to | 16,025,473 | 24.35% | 136 | +51 | |||
| Komeito Kōmeitō | 5,242,675 | 7.98% | 45 | -9 | |||
| Japanese Communist Party (JCP) Nihon Kyōsantō | 5,226,987 | 7.96% | 16 | -10 | |||
| Japan Democratic Socialist Party (DSP) Minsha-tō | 3,178,949 | 4.84% | 14 | -12 | |||
| Socialist Democratic Federation | 566,957 | 0.86% | 4 | 0 | |||
| Progressive Party | 281,793 | 0.43% | 1 | +1 | |||
| Independents | 4,807,524 | 7.32% | 21 | +12 | |||
| Other Parties | 58,536 | 0.09% | 0 | -6 | |||
| Total (turnout 73.3%) | 66,215,906 | 100.0 | 512 | ||||
| Source: Inter Parliamentary Union | |||||||

This article is issued from Wikipedia. The text is licensed under Creative Commons - Attribution - Sharealike. Additional terms may apply for the media files.
.jpg.webp)


