Bonavista—Gander—Grand Falls—Windsor
Bonavista—Gander—Grand Falls—Windsor (formerly Bonavista—Exploits) was a federal electoral district in Newfoundland and Labrador, Canada, that was represented in the House of Commons of Canada from 2004 until 2015.
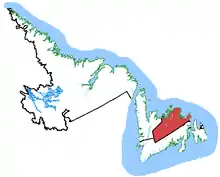 Bonavista—Gander—Grand Falls—Windsor in relation to other Newfoundland and Labrador ridings | |
| Defunct federal electoral district | |
| Legislature | House of Commons |
| District created | 2003 |
| District abolished | 2013 |
| First contested | 2004 |
| Last contested | 2011 |
| District webpage | profile, map |
| Demographics | |
| Population (2011)[1] | 84,735 |
| Electors (2011) | 69,828 |
| Area (km²)[2] | 27,140.84 |
| Census division(s) | Division No. 3, Division No. 6, Division No. 7, Division No. 8 |
| Census subdivision(s) | Grand Falls-Windsor, Gander, Bonavista, Bishop's Falls, Lewisporte, Botwood, New-Wes-Valley, Twillingate, Gambo, Glovertown |
81.0% of its population was Protestant, the highest proportion in Canada. In the 2011 federal election, this riding had the highest percentage of Liberal votes in the nation, with nearly 60% of voters backing Liberal candidate Scott Simms.
Demographics
Ethnic groups:
- 98.4% White¹
- 1.6% First Peoples
Immigrant population: 0.92%
Languages:²
Religions:
- 81.0% Protestant
- 16.4% Catholic
- 1.9% No affiliation
- 0.6% other Christian
The riding had the highest proportion of Protestants in Canada.
Post-secondary Education: 31.3%
Average individual income: $19 829
Average household income: $40 677
Unemployment: 28.9%
¹ Statistics Canada's category of "Non-visible minority" includes First Peoples (First Nations, Métis and Inuit), and has been reduced accordingly.
² Based on ability to speak.
Geography
The neighbouring ridings were Avalon, Random—Burin—St. George's, and Humber—St. Barbe—Baie Verte.
According to Elections Canada, the geographic definition of this riding was:
- "All that area consisting of that part of the Island of Newfoundland lying generally easterly and northerly of a line described as follows: commencing at a point midway between the towns of Triton and Leading Tickles in Notre Dame Bay; thence southerly in said bay to Seal Bay; thence southerly in a straight line to Frozen Ocean Lake at approximate latitude 49°11'N and approximate longitude 55°41'W; thence westerly in a straight line to Hinds Lake; thence southerly in a straight line to the mouth of Lloyds River at the westernmost extremity of Red Indian Lake; thence southerly in a straight line to a point in Victoria Lake at latitude 48°15'N and approximate longitude 57°21'W; thence easterly to the intersection of the Trans-Canada Highway (Route No. 1) with Route No. 230; thence easterly along Route No. 230 to Route No. 230A; thence easterly in a straight line to Ocean Pond; thence southeasterly in a straight line to British Harbour at the entrance of Smith Sound on the north shoreline of Trinity Bay; thence southeasterly to said bay. Including Exploits Islands, North and South Twillingate Islands, New World Island, Change Islands, Fogo Island, Funk Island, Cottel Island and all other islands adjacent to the shoreline of the above-described area."
History
The electoral district was created in 2003: 68.6% from Gander—Grand Falls and 31.4% from Bonavista—Trinity—Conception. Following the 2012 electoral redistribution, this riding was dissolved and divided between Coast of Bays—Central—Notre Dame (67%) and Bonavista—Burin—Trinity (33%), with the new boundaries taking effect at the 2015 federal election.
Member of Parliament
This riding elected the following Members of Parliament:
| Parliament | Years | Member | Party | |
|---|---|---|---|---|
| Bonavista—Exploits Riding created from Gander—Grand Falls and Bonavista—Trinity—Conception |
||||
| 38th | 2004–2006 | Scott Simms | Liberal | |
| Bonavista—Gander—Grand Falls—Windsor | ||||
| 39th | 2006–2008 | Scott Simms | Liberal | |
| 40th | 2008–2011 | |||
| 41st | 2011–2015 | |||
| Riding dissolved into Coast of Bays—Central—Notre Dame and Bonavista—Burin—Trinity |
||||
Election results
Bonavista—Gander—Grand Falls—Windsor, 2003 Representation Order
| 2011 Canadian federal election | ||||||||
|---|---|---|---|---|---|---|---|---|
| Party | Candidate | Votes | % | ±% | Expenditures | |||
| Liberal | Scott Simms | 17,977 | 57.70 | -12.57 | $31,255.40 | |||
| Conservative | Aaron Hynes | 8,595 | 27.59 | +12.36 | $54,357.10 | |||
| New Democratic | Clyde Bridger | 4,306 | 13.82 | +1.31 | $9.50 | |||
| Green | Robyn Kenny | 279 | 0.90 | -1.08 | none listed | |||
| Total valid votes/Expense limit | 31,157 | 100.0 | – | $95,488.47 | ||||
| Total rejected, declined and unmarked ballots | 151 | 0.48 | -0.02 | |||||
| Turnout | 31,308 | 36.24 | -4.91 | |||||
| Eligible voters | 86,394 | |||||||
| Liberal hold | Swing | -12.46 | ||||||
| Sources:[3][4] | ||||||||
| 2008 Canadian federal election | ||||||||
|---|---|---|---|---|---|---|---|---|
| Party | Candidate | Votes | % | ±% | Expenditures | |||
| Liberal | Scott Simms | 20,089 | 70.27 | +18.23 | $24,766.21 | |||
| Conservative | Andrew House | 4,354 | 15.23 | -25.05 | $31,582.25 | |||
| New Democratic | Jason Holley | 3,577 | 12.51 | +5.52 | none listed | |||
| Green | Robert O'Connor | 568 | 1.98 | +1.29 | none listed | |||
| Total valid votes/Expense limit | 28,588 | 100.0 | – | $92,537 | ||||
| Total rejected, declined and unmarked ballots | 145 | 0.50 | ±0 | |||||
| Turnout | 28,733 | 41.15 | -13.05 | |||||
| Eligible voters | 69,828 | |||||||
| Liberal hold | Swing | +21.64 | ||||||
| 2006 Canadian federal election | ||||||||
|---|---|---|---|---|---|---|---|---|
| Party | Candidate | Votes | % | ±% | Expenditures | |||
| Liberal | Scott Simms | 19,866 | 52.04 | +3.84 | $44,893.75 | |||
| Conservative | Aaron Hynes | 15,376 | 40.28 | -1.33 | $70,473.24 | |||
| New Democratic | Sandra Cooze | 2,668 | 6.99 | -1.06 | $960.36 | |||
| Green | Judy Davis | 265 | 0.69 | -0.42 | none listed | |||
| Total valid votes/Expense limit | 38,175 | 100.0 | – | $86,380 | ||||
| Total rejected, declined and unmarked ballots | 190 | 0.50 | -0.03 | |||||
| Turnout | 38,365 | 54.20 | ||||||
| Eligible voters | 70,782 | |||||||
| Liberal hold | Swing | +2.58 | ||||||
Bonavista—Exploits, 2003 Representation Order
| 2004 Canadian federal election | ||||||||
|---|---|---|---|---|---|---|---|---|
| Party | Candidate | Votes | % | ±% | Expenditures | |||
| Liberal | Scott Simms | 15,970 | 48.20 | -7.12 | $45,455.39 | |||
| Conservative | Rex Barnes | 13,786 | 41.61 | +7.11 | $78,934.75 | |||
| New Democratic | Samuel Robert McLean | 2,667 | 8.05 | -2.14 | $1,870.00 | |||
| Green | Ed Sailor White | 367 | 1.11 | – | $275.00 | |||
| Independent | John Lannon | 344 | 1.04 | – | none listed | |||
| Total valid votes/Expense limit | 33,134 | 100.0 | – | $84,760 | ||||
| Total rejected, declined and unmarked ballots | 178 | 0.53 | ||||||
| Turnout | 33,312 | 46.30 | -6.67 | |||||
| Eligible voters | 71,944 | |||||||
| Liberal notional hold | Swing | -7.12 | ||||||
| Changes from 2000 are based on redistributed results. Change for the Conservatives is based on the combined totals from the Progressive Conservatives and the Canadian Alliance. | ||||||||
| 2000 federal election redistributed results | |||
|---|---|---|---|
| Party | Vote | % | |
| Liberal | 21,079 | 55.32 | |
| Progressive Conservative | 11,358 | 29.81 | |
| New Democratic Party | 3,882 | 10.19 | |
| Alliance | 1,788 | 4.69 | |
References
- "(Code 10002) Census Profile". 2011 census. Statistics Canada. 2012. Retrieved 2011-03-03.