Cape Breton—Canso
Cape Breton—Canso is a federal electoral district in Nova Scotia, Canada, that has been represented in the House of Commons of Canada since 2004. Its population in 2011 was 75,247. It is the successor to Bras d'Or (later known as Bras d'Or—Cape Breton), which was represented in the House of Commons from 1997 to 2004.
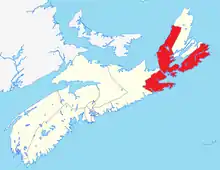 Cape Breton—Canso in relation to the other Nova Scotia federal electoral districts | |||
| Federal electoral district | |||
| Legislature | House of Commons | ||
| MP |
Liberal | ||
| District created | 1996 | ||
| First contested | 1997 | ||
| Last contested | 2015 | ||
| District webpage | profile, map | ||
| Demographics | |||
| Population (2016)[1] | 71,962 | ||
| Electors (2019) | 60,412 | ||
| Area (km²)[1] | 9,308 | ||
| Pop. density (per km²) | 7.7 | ||
| Census subdivision(s) | Cape Breton, Guysborough, Port Hawkesbury | ||
Demographics
| Year | Pop. | ±% |
|---|---|---|
| 2001 | 75,221 | — |
| 2006 | 71,968 | −4.3% |
| 2011 (2003 redist.) | 68,435 | −4.9% |
| 2011 (2015 redist.) | 74,597 | +9.0% |
| 2016 | 71,962 | −3.5% |
From the 2016 census[2]
Languages (mother tongue): 90.8% English, 6.5% French, 1.2% Mi'kmaq, 0.4% German, 0.2% Dutch, 0.1% Mandarin, 0.1% Arabic, 0.1% Scottish Gaelic, 0.1% Tagalog[3]
Average age: 46.4
Average household size: 2.3
Geography
The district includes eastern Guysborough County, and the western, southern and eastern coasts of Cape Breton Island. Communities include Glace Bay, Louisbourg, Inverness, Cheticamp, St. Peters, Port Hawkesbury, Mulgrave, Guysborough, Dominion and Canso. The area is 9,438 km2.
Political geography
In 2008, the Liberals won most of their support on Cape Breton Island, whereas the mainland portion of the riding voted Conservative with a few Liberal and NDP pockets The Conservatives and the NDP both won a small handful of polls on the island, and the Greens won a poll containing Judique.
History
The riding of Bras d'Or was created in 1996 from parts of Cape Breton Highlands—Canso and Cape Breton—East Richmond ridings.
Bras d'Or was renamed "Bras d'Or—Cape Breton" in 1998. It was abolished in 2003. Most of its territory (except for the community of Sydney River) was incorporated into a new riding called "Cape Breton—Canso", and it also added a portion of Pictou—Antigonish—Guysborough on the mainland.
Under the 2012 federal electoral redistribution, this riding gained 9% of its new territory from Central Nova.
Members of Parliament
| Parliament | Years | Member | Party | |
|---|---|---|---|---|
| Bras d'Or Riding created from Cape Breton Highlands—Canso and Cape Breton—East Richmond |
||||
| 36th | 1997–2000 | Michelle Dockrill | New Democratic | |
| Bras d'Or—Cape Breton | ||||
| 37th | 2000–2004 | Rodger Cuzner | Liberal | |
| Cape Breton—Canso | ||||
| 38th | 2004–2006 | Rodger Cuzner | Liberal | |
| 39th | 2006–2008 | |||
| 40th | 2008–2011 | |||
| 41st | 2011–2015 | |||
| 42nd | 2015–2019 | |||
| 43rd | 2019–present | Mike Kelloway | ||
Election results
2019 general election
| 2019 Canadian federal election | ||||||||
|---|---|---|---|---|---|---|---|---|
| Party | Candidate | Votes | % | ±% | Expenditures | |||
| Liberal | Mike Kelloway | 16,694 | 38.9 | -35.49 | none listed | |||
| Conservative | Alfie MacLeod | 14,821 | 34.3 | +19.85 | $99,102.26 | |||
| New Democratic | Laurie Suitor | 6,354 | 14.8 | +6.6 | none listed | |||
| Green | Clive Doucet | 3,321 | 7.7 | +4.74 | $23,886.83 | |||
| People's | Billy Joyce[4] | 925 | 2.2 | - | $0.00 | |||
| Independent | Michelle Dockrill | 685 | 1.6 | - | none listed | |||
| National Citizens Alliance | Darlene Lynn LeBlanc | 140 | 0.3 | - | $0.00 | |||
| Total valid votes/Expense limit | 42,940 | 100.0 | $102,831.89 | |||||
| Total rejected ballots | 601 | |||||||
| Turnout | 43,541 | 72.1 | ||||||
| Eligible voters | 60,412 | |||||||
| Liberal hold | Swing | |||||||
| Source: Elections Canada[5] | ||||||||
2015 general election
| 2015 Canadian federal election | ||||||||
|---|---|---|---|---|---|---|---|---|
| Party | Candidate | Votes | % | ±% | Expenditures | |||
| Liberal | Rodger Cuzner | 32,163 | 74.39 | +30.29 | $69,357.97 | |||
| Conservative | Adam Daniel Rodgers | 6,246 | 14.45 | –18.17 | $36,970.92 | |||
| New Democratic | Michelle Smith | 3,547 | 8.20 | –11.84 | $3,803.75 | |||
| Green | Maria Goretti Coady | 1,281 | 2.96 | –0.28 | – | |||
| Total valid votes/Expense limit | 43,237 | 100.00 | $205,381.80 | |||||
| Total rejected ballots | 274 | 0.63 | ||||||
| Turnout | 43,511 | 71.72 | ||||||
| Eligible voters | 60,666 | |||||||
| Liberal hold | Swing | +24.23 | ||||||
| Source: Elections Canada[6][7] | ||||||||
| 2011 federal election redistributed results[8] | |||
|---|---|---|---|
| Party | Vote | % | |
| Liberal | 17,196 | 44.10 | |
| Conservative | 12,719 | 32.62 | |
| New Democratic | 7,818 | 20.05 | |
| Green | 1,265 | 3.24 | |
2011 general election
| 2011 Canadian federal election | ||||||||
|---|---|---|---|---|---|---|---|---|
| Party | Candidate | Votes | % | ±% | Expenditures | |||
| Liberal | Rodger Cuzner | 16,478 | 46.45 | -1.65 | $63,928.72 | |||
| Conservative | Clarence Derrick Kennedy | 10,873 | 30.65 | +7.15 | $75,474.80 | |||
| New Democratic | Marney Simmons | 6,984 | 19.69 | -1.43 | $2,528.46 | |||
| Green | Glen Carabin | 1,141 | 3.22 | -4.06 | $346.95 | |||
| Total valid votes/Expense limit | 35,476 | 100.0 | $83,274.40 | |||||
| Total rejected, unmarked and declined ballots | 336 | 0.94 | +0.14 | |||||
| Turnout | 35,812 | 62.47 | -0.84 | |||||
| Eligible voters | 57,331 | |||||||
| Liberal hold | Swing | -4.40 | ||||||
| Sources:[9][10] | ||||||||
2008 general election
| 2008 Canadian federal election | ||||||||
|---|---|---|---|---|---|---|---|---|
| Party | Candidate | Votes | % | ±% | Expenditures | |||
| Liberal | Rodger Cuzner | 17,447 | 48.10 | -5.09 | $35,405.44 | |||
| Conservative | Allan Murphy | 8,524 | 23.50 | -0.68 | $51,511.90 | |||
| New Democratic | Mark MacNeill | 7,660 | 21.12 | +0.98 | $6,483.40 | |||
| Green | Dwayne MacEachern | 2,641 | 7.28 | +4.78 | $5,315.05 | |||
| Total valid votes/Expense limit | 36,272 | 100.0 | $80,776 | |||||
| Total rejected, unmarked and declined ballots | 292 | 0.80 | +0.09 | |||||
| Turnout | 36,564 | 63.31 | -3.21 | |||||
| Eligible voters | 57,753 | |||||||
| Liberal hold | Swing | -2.20 | ||||||
2006 general election
| 2006 Canadian federal election | ||||||||
|---|---|---|---|---|---|---|---|---|
| Party | Candidate | Votes | % | ±% | Expenditures | |||
| Liberal | Rodger Cuzner | 21,424 | 53.19 | -0.07 | $62,038.40 | |||
| Conservative | Kenzie MacNeil | 9,740 | 24.18 | +3.94 | $47,590.43 | |||
| New Democratic | Hector Morrison | 8,111 | 20.14 | -4.18 | $7,662.93 | |||
| Green | Rob Hines | 1,006 | 2.50 | +0.33 | $323.17 | |||
| Total valid votes/Expense limit | 40,281 | 100.0 | $76,321 | |||||
| Total rejected, unmarked and declined ballots | 288 | 0.71 | -0.24 | |||||
| Turnout | 40,569 | 66.52 | +2.72 | |||||
| Eligible voters | 60,984 | |||||||
| Liberal hold | Swing | -2.00 | ||||||
2004 general election
| 2004 Canadian federal election | ||||||||
|---|---|---|---|---|---|---|---|---|
| Party | Candidate | Votes | % | ±% | Expenditures | |||
| Liberal | Rodger Cuzner | 20,139 | 53.26 | -0.33 | $63,078.17 | |||
| New Democratic | Shirley Hartery | 9,197 | 24.32 | +5.44 | $21,160.51 | |||
| Conservative | Kenzie MacNeil | 7,654 | 20.24 | -7.19 | $49,919.36 | |||
| Green | Seumas Gibson | 820 | 2.17 | – | none listed | |||
| Total valid votes/Expense limit | 37,810 | 100.0 | $73,856 | |||||
| Total rejected, unmarked and declined ballots | 361 | 0.95 | ||||||
| Turnout | 38,171 | 63.80 | -3.38 | |||||
| Eligible voters | 59,825 | |||||||
| Liberal notional hold | Swing | -2.88 | ||||||
| Changes from 2000 are based on redistributed results. Conservative Party change is based on the combination of Canadian Alliance and Progressive Conservative Party totals. | ||||||||
| 2000 federal election redistributed results | |||
|---|---|---|---|
| Party | Vote | % | |
| Liberal | 21,200 | 53.59 | |
| Progressive Conservative | 9,291 | 23.49 | |
| New Democratic | 7,469 | 18.88 | |
| Alliance | 1,558 | 3.94 | |
| Others | 42 | 0.11 | |
2000 general election
| 2000 Canadian federal election | ||||||||
|---|---|---|---|---|---|---|---|---|
| Party | Candidate | Votes | % | ±% | ||||
| Liberal | Rodger Cuzner | 20,815 | 54.85 | +16.41 | ||||
| Progressive Conservative | Alfie MacLeod | 8,114 | 21.38 | +1.12 | ||||
| New Democratic | Michelle Dockrill | 7,537 | 19.86 | -21.44 | ||||
| Alliance | John Currie | 1,483 | 3.91 | – | ||||
| Total valid votes | 37,949 | 100.00 | ||||||
| Liberal gain from New Democratic | Swing | +18.93 | ||||||
1997 general election
| 1997 Canadian federal election | ||||||||
|---|---|---|---|---|---|---|---|---|
| Party | Candidate | Votes | % | |||||
| New Democratic | Michelle Dockrill | 17,575 | 41.30 | |||||
| Liberal | David Dingwall | 16,358 | 38.44 | |||||
| Progressive Conservative | Frank Crowdis | 8,620 | 20.26 | |||||
| Total valid votes | 42,553 | 100.00 | ||||||
References
- "(Code 12001) Census Profile". 2011 census. Statistics Canada. 2012. Retrieved 2011-03-03.
Notes
- Statistics Canada: 2012
- http://www12.statcan.gc.ca/census-recensement/2016/dp-pd/prof/details/page.cfm?Lang=E&Geo1=FED&Code1=12001&Geo2=PR&Code2=12&Data=Count&SearchText=Cape%20Breton&SearchType=Begins&SearchPR=01&B1=All&TABID=1
- https://www12.statcan.gc.ca/census-recensement/2016/dp-pd/dt-td/Rp-eng.cfm?LANG=E&APATH=3&DETAIL=0&DIM=0&FL=A&FREE=0&GC=0&GID=0&GK=0&GRP=1&PID=109979&PRID=10&PTYPE=109445&S=0&SHOWALL=0&SUB=888&Temporal=2016,2017&THEME=118&VID=0&VNAMEE=&VNAMEF=
- Mack Lamoureux (September 11, 2019). "A QAnon YouTuber Is Running for Office in Canada". Vice. Retrieved November 6, 2019.
- "Election Night Results". Elections Canada. Retrieved November 9, 2019.
- "October 19, 2015 Election Results — Cape Breton—Canso (Validated results)". Elections Canada. 23 October 2015. Retrieved 24 October 2015.
- Elections Canada – Preliminary Election Expenses Limits for Candidates Archived August 15, 2015, at the Wayback Machine
- Pundits' Guide to Canadian Elections
- Elections Canada – Official voting results, Forty-first general election, 2011
- Elections Canada – Candidate's electoral campaign return, 41st general election