Beauséjour (electoral district)
Beauséjour riding (formerly known as Beauséjour—Petitcodiac) is a federal electoral district in southeastern New Brunswick, Canada, which has been represented in the House of Commons of Canada since 1988. It replaced Westmorland—Kent, which was represented from 1968 to 1988.
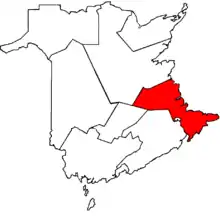 Beauséjour in relation to other New Brunswick federal electoral districts (2003 boundaries) | |||
| Coordinates: | 46.307°N 64.689°W | ||
| Federal electoral district | |||
| Legislature | House of Commons | ||
| MP |
Liberal | ||
| District created | 1966 | ||
| First contested | 1968 | ||
| Last contested | 2019 | ||
| District webpage | profile, map | ||
| Demographics | |||
| Population (2016)[1] | 82,292 | ||
| Electors (2019) | 69,444 | ||
| Area (km²)[2] | 3,995.89 | ||
| Pop. density (per km²) | 20.6 | ||
| Census division(s) | Kent, Westmorland | ||
| Census subdivision(s) | Dieppe, Bouctouche, Richibucto, Sackville, Shediac, Memramcook, Moncton (parish), Dundas, Beaubassin East | ||
Beauséjour is largely Acadian and Francophone, with a significant Anglophone section in the southern section of the riding.
The riding consists of most of Westmorland County to the east and north of Moncton; and almost all of Kent County. Major towns in the riding include Shediac, Cap-Pelé, Sackville, Bouctouche and Richibucto. The neighbouring ridings are Miramichi—Grand Lake, Fundy Royal, Moncton—Riverview—Dieppe, and Cumberland—Colchester in Nova Scotia; it is connected to the riding of Malpeque on Prince Edward Island by the Confederation Bridge.
Political geography
Westmorland—Kent was created in 1966 from Kent, and part of Westmorland that was not included in the Moncton riding. It was abolished when it was incorporated into the new riding of Beauséjour in 1987.
Beauséjour was created in 1987 primarily from Westmorland—Kent, incorporating parts of Moncton and Northumberland—Miramichi ridings.
In 1997, it was renamed "Beauséjour—Petitcodiac", and expanded to include most of Albert County and the Petitcodiac area of western Westmorland County. This created a "doughnut" around Greater Moncton, which was a separate district.
In 2003, Beauséjour—Petitcodiac was abolished when it was redistributed into a new Beauséjour riding and into Fundy riding.
The new Beauséjour riding was created primarily from Beauséjour—Petitcodiac, incorporating parts of Miramichi and Moncton—Riverview—Dieppe ridings.
As per the 2012 federal electoral redistribution, this riding will lose small territories to Miramichi—Grand Lake and Fundy Royal, but will gain territory from Moncton—Riverview—Dieppe.
Political history
| Year | Pop. | ±% |
|---|---|---|
| 2001 | 73,871 | — |
| 2006 | 76,279 | +3.3% |
| 2011 | 78,076 | +2.4% |
| 2016 | 82,292 | +5.4% |
Future Governor General of Canada Roméo LeBlanc represented Beauséjour from 1972 to 1984. His son, Dominic LeBlanc, is its current MP.
Future Prime Minister Jean Chrétien represented Beauséjour for a short time in the early 1990s after he won the Liberal leadership. Chrétien did not have a seat in the House of Commons at the time, and the sitting MP stepped down to allow him to run in a by-election.
Since its creation, the riding has voted Liberal in every election except 1997, when it elected Angela Vautour of the New Democratic Party. Vautour switched to the Progressive Conservatives midway through her term, and was defeated in 2000.
Federal riding associations
Riding associations are the local branches of the national political parties:
| Party | Association Name | CEO | HQ Address | HQ City | |
| Green Party of Canada | Beauséjour Green Party Association | Guy Gautreau | 308 la Vallée Route | Memramcook | |
| People's Party of Canada | Beauséjour People's Party Association | Michael Milne | 12 Westshore Dr | Pointe-du-Chêne | |
| Conservative Party of Canada | Beauséjour Conservative Association | open | |||
| Liberal Party of Canada | Beauséjour Federal Liberal Association | Roland Cormier | 69 Harbour View Drive | Scoudouc Road | |
| New Democratic Party | Beauséjour Federal NDP Riding Association | Daniel Légère | 248 Memramcook Road East | Memramcook | |
Members of Parliament
This riding has elected the following Members of Parliament:
| Parliament | Years | Member | Party | |
|---|---|---|---|---|
| Westmorland—Kent Riding created from Kent and Westmorland |
||||
| 28th | 1968–1972 | Guy Crossman | Liberal | |
| 29th | 1972–1974 | Roméo LeBlanc | ||
| 30th | 1974–1979 | |||
| 31st | 1979–1980 | |||
| 32nd | 1980–1984 | |||
| 33rd | 1984–1988 | Fernand Robichaud | ||
| Beauséjour | ||||
| 34th | 1988–1990 | Fernand Robichaud | Liberal | |
| 1990–1993 | Jean Chrétien | |||
| 35th | 1993–1997 | Fernand Robichaud | ||
| Beauséjour—Petitcodiac | ||||
| 36th | 1997–1999 | Angela Vautour | New Democratic | |
| 1999–2000 | Progressive Conservative | |||
| 37th | 2000–2004 | Dominic LeBlanc | Liberal | |
| Beauséjour | ||||
| 38th | 2004–2006 | Dominic LeBlanc | Liberal | |
| 39th | 2006–2008 | |||
| 40th | 2008–2011 | |||
| 41st | 2011–2015 | |||
| 42nd | 2015–2019 | |||
| 43rd | 2019–present | |||
Election results
2019 general election
| 2019 Canadian federal election | ||||||||
|---|---|---|---|---|---|---|---|---|
| Party | Candidate | Votes | % | ±% | Expenditures | |||
| Liberal | Dominic LeBlanc | 24,948 | 46.47 | −22.54 | $83,393.36 | |||
| Green | Laura Reinsborough | 14,305 | 26.65 | +22.16 | $74,321.26 | |||
| Conservative | Vincent Cormier | 9,438 | 17.58 | +6.21 | $39,043.98 | |||
| New Democratic | Jean-Marc Bélanger | 3,940 | 7.34 | −7.79 | none listed | |||
| People's | Nancy Mercier | 1,054 | 1.96 | New | $6,338.64 | |||
| Total valid votes/Expense limit | 53,685 | 100.0 | $101,392.80 | |||||
| Total rejected ballots | 475 | 0.88 | +0.28 | |||||
| Turnout | 54,160 | 77.99 | −2.49 | |||||
| Eligible voters | 69,444 | |||||||
| Liberal hold | Swing | −22.35 | ||||||
| Source: Elections Canada[3][4] | ||||||||
2015 general election
| 2015 Canadian federal election | ||||||||
|---|---|---|---|---|---|---|---|---|
| Party | Candidate | Votes | % | ±% | Expenditures | |||
| Liberal | Dominic LeBlanc | 36,534 | 69.02 | +28.33 | $77,614.48 | |||
| New Democratic | Hélène Boudreau | 8,009 | 15.13 | –8.30 | $24,161.02 | |||
| Conservative | Ann Bastarache | 6,017 | 11.37 | –20.35 | – | |||
| Green | Kevin King | 2,376 | 4.49 | +0.32 | $1,009.07 | |||
| Total valid votes/Expense limit | 52,936 | 99.40 | $200,494.19 | |||||
| Total rejected ballots | 320 | 0.60 | ||||||
| Turnout | 53,256 | 80.48 | ||||||
| Eligible voters | 66,170 | |||||||
| Liberal notional hold | Swing | +18.31 | ||||||
| Source: Elections Canada[5][6] | ||||||||
| 2011 federal election redistributed results[7] | |||
|---|---|---|---|
| Party | Vote | % | |
| Liberal | 18,507 | 40.69 | |
| Conservative | 14,425 | 31.71 | |
| New Democratic | 10,655 | 23.43 | |
| Green | 1,896 | 4.17 | |
2011 general election
| 2011 Canadian federal election | ||||||||
|---|---|---|---|---|---|---|---|---|
| Party | Candidate | Votes | % | ±% | Expenditures | |||
| Liberal | Dominic LeBlanc | 17,399 | 39.08 | -7.68 | $60,854.20 | |||
| Conservative | Evelyn Chapman | 14,811 | 33.27 | +4.12 | $75,052.19 | |||
| New Democratic | Susan Levi-Peters | 10,397 | 23.35 | +6.47 | $13,825.57 | |||
| Green | Natalie Arsenault | 1,913 | 4.30 | -2.89 | $0.00 | |||
| Total valid votes/Expense limit | 44,520 | 100.0 | $84,184.30 | |||||
| Total rejected, unmarked and declined ballots | 534 | 1.19 | -0.16 | |||||
| Turnout | 45,054 | 71.21 | +1.96 | |||||
| Eligible voters | 63,267 | |||||||
| Liberal hold | Swing | -5.90 | ||||||
| Sources:[8][9] | ||||||||
2008 general election
| 2008 Canadian federal election | ||||||||
|---|---|---|---|---|---|---|---|---|
| Party | Candidate | Votes | % | ±% | Expenditures | |||
| Liberal | Dominic LeBlanc | 20,059 | 46.76 | -0.95 | $56,379.70 | |||
| Conservative | Omer Léger | 12,506 | 29.15 | -3.03 | $54,871.67 | |||
| New Democratic | Chris Durrant | 7,242 | 16.88 | +0.13 | $7,113.77 | |||
| Green | Mike Milligan | 3,087 | 7.19 | +4.79 | $1,748.46 | |||
| Total valid votes/Expense limit | 42,894 | 100.0 | $81,263 | |||||
| Total rejected, unmarked and declined ballots | 586 | 1.35 | +0.15 | |||||
| Turnout | 43,480 | 69.25 | -5.97 | |||||
| Eligible voters | 62,790 | |||||||
| Liberal hold | Swing | +1.04 | ||||||
2006 general election
| 2006 Canadian federal election | ||||||||
|---|---|---|---|---|---|---|---|---|
| Party | Candidate | Votes | % | ±% | Expenditures | |||
| Liberal | Dominic LeBlanc | 22,012 | 47.55 | -5.73 | $58,009.11 | |||
| Conservative | Omer Léger | 14,919 | 32.23 | +4.04 | $54,029.29 | |||
| New Democratic | Neil Gardner | 7,717 | 16.67 | +1.96 | $10,068.80 | |||
| Green | Anna Girouard | 1,290 | 2.79 | -1.03 | $1,869.49 | |||
| Independent | Frank Comeau | 357 | 0.77 | – | $460.29 | |||
| Total valid votes/Expense limit | 46,295 | 100.0 | $75,255 | |||||
| Total rejected, unmarked and declined ballots | 561 | 1.20 | -0.50 | |||||
| Turnout | 46,856 | 75.22 | +8.62 | |||||
| Eligible voters | 62,291 | |||||||
| Liberal hold | Swing | -4.88 | ||||||
2004 general election
| 2004 Canadian federal election | ||||||||
|---|---|---|---|---|---|---|---|---|
| Party | Candidate | Votes | % | ±% | Expenditures | |||
| Liberal | Dominic LeBlanc | 21,934 | 53.28 | +0.59 | $51,654.26 | |||
| Conservative | Angela Vautour | 11,604 | 28.19 | -11.64 | $51,129.02 | |||
| New Democratic | Omer Bourque | 6,056 | 14.71 | +7.24 | $7,476.46 | |||
| Green | Anna Girouard | 1,574 | 3.82 | – | $1,201.17 | |||
| Total valid votes/Expense limit | 41,168 | 100.0 | $73,195 | |||||
| Total rejected, unmarked and declined ballots | 712 | 1.70 | ||||||
| Turnout | 41,880 | 68.29 | -2.28 | |||||
| Eligible voters | 61,327 | |||||||
| Liberal notional hold | Swing | +6.12 | ||||||
| Changes from 2000 are based on redistributed results. Conservative Party change is based on the combination of Canadian Alliance and Progressive Conservative Party totals. | ||||||||
| 2000 federal election redistributed results | |||
|---|---|---|---|
| Party | Vote | % | |
| Liberal | 21,533 | 52.69 | |
| Progressive Conservative | 12,663 | 30.98 | |
| Alliance | 3,616 | 8.85 | |
| New Democratic | 3,053 | 7.47 | |
| Others | 5 | 0.01 | |
Beauséjour—Petitcodiac, 1997–2003
| 2000 Canadian federal election | ||||||||
|---|---|---|---|---|---|---|---|---|
| Party | Candidate | Votes | % | ±% | ||||
| Liberal | Dominic LeBlanc | 21,465 | 47.10 | +12.27 | ||||
| Progressive Conservative | Angela Vautour | 14,631 | 32.11 | +16.11 | ||||
| Alliance | Tom Taylor | 6,256 | 13.73 | +3.55 | ||||
| New Democratic | Inka Milewski | 3,217 | 7.06 | -31.93 | ||||
| Total valid votes | 45,569 | 100.00 | ||||||
Change for Progressive Conservative candidate Angela Vautour are based on the party's results in 1997. She personally received 6.88% fewer votes based on her results as an NDP candidate. Change for the Canadian Alliance for 1997 are based on the results of its predecessor, the Reform Party.
| 1997 Canadian federal election | ||||||||
|---|---|---|---|---|---|---|---|---|
| Party | Candidate | Votes | % | ±% | ||||
| New Democratic | Angela Vautour | 18,504 | 38.99 | +33.25 | ||||
| Liberal | Dominic LeBlanc | 16,529 | 34.83 | -41.20 | ||||
| Progressive Conservative | Ian Hamilton | 7,592 | 16.00 | +0.78 | ||||
| Reform | Raymond Braun | 4,833 | 10.18 | |||||
| Total valid votes | 47,458 | 100.00 | ||||||
Beauséjour, 1987–1997
| 1993 Canadian federal election | ||||||||
|---|---|---|---|---|---|---|---|---|
| Party | Candidate | Votes | % | ±% | ||||
| Liberal | Fernand Robichaud | 29,830 | 76.03 | +24.58 | ||||
| Progressive Conservative | Ian Hamilton | 5,970 | 15.22 | -12.02 | ||||
| New Democratic | David Bailie | 2,253 | 5.74 | -31.62 | ||||
| National | James Bannister | 738 | 1.88 | |||||
| Christian Heritage | Mae Boudreau-Pedersen | 445 | 1.13 | +0.28 | ||||
| Total valid votes | 39,236 | 100.00 | ||||||
All changes are from the 1990 by-election, with the exception of the Progressive Conservative Party, who did not field a candidate.
| Canadian federal by-election, 10 December 1990 | ||||||||
|---|---|---|---|---|---|---|---|---|
| Party | Candidate | Votes | % | ±% | ||||
| On the resignation of Fernand Robichaud, 24 September 1990 | ||||||||
| Liberal | Jean Chrétien | 17,332 | 51.45 | -7.16 | ||||
| New Democratic | Guy Cormier | 12,587 | 37.36 | +27.12 | ||||
| Confederation of Regions | Margie Bowes-Legood | 2,789 | 8.28 | +4.37 | ||||
| Independent | Alonzo LeBlanc | 450 | 1.34 | |||||
| Christian Heritage | Mae Boudreau-Pedersen | 286 | 0.85 | |||||
| Rhinoceros | Bryan Gold | 246 | 0.73 | |||||
| Total valid votes | 33,690 | 100.00 | ||||||
| 1988 Canadian federal election | ||||||||
|---|---|---|---|---|---|---|---|---|
| Party | Candidate | Votes | % | ±% | ||||
| Liberal | Fernand Robichaud | 22,650 | 58.61 | +16.86 | ||||
| Progressive Conservative | Omer Léger | 10,525 | 27.24 | -10.72 | ||||
| New Democratic | Lyman Dean | 3,958 | 10.24 | -10.05 | ||||
| Confederation of Regions | Russell Bowes | 1,511 | 3.91 | |||||
| Total valid votes | 38,644 | 100.00 | ||||||
Westmorland—Kent, 1966–1987
| 1984 Canadian federal election | ||||||||
|---|---|---|---|---|---|---|---|---|
| Party | Candidate | Votes | % | ±% | ||||
| Liberal | Fernand Robichaud | 14,709 | 41.75 | -25.375 | ||||
| Progressive Conservative | Louis LeBlanc | 13,371 | 37.96 | +21.39 | ||||
| New Democratic | Claire Doiron | 7,148 | 20.29 | +3.98 | ||||
| Total valid votes | 35,228 | 100.00 | ||||||
Student Vote results
2011 election
In 2011, a Student Vote was conducted at participating Canadian schools to parallel the 2011 Canadian federal election results. The vote was designed to educate students and simulate the electoral process for persons who have not yet reached the legal majority. Schools with a large student body that reside in another electoral district had the option to vote for candidates outside of the electoral district then where they were physically located.[10]
| 2011 Canadian federal election | ||||||||
|---|---|---|---|---|---|---|---|---|
| Party | Candidate | Votes | % | |||||
| Liberal | Dominic LeBlanc | 504 | 41.96 | |||||
| New Democratic | Susan Levi-Peters | 318 | 26.48 | |||||
| Green | Natalie Arsenault | 191 | 15.90 | |||||
| Conservative | Evelyn Chapman | 188 | 15.65 | |||||
| Total valid votes | 1,497 | 100.00 | ||||||
References
- "(Code 13002) Census Profile". 2011 census. Statistics Canada. 2012. Retrieved 2011-03-03.
Notes
- Statistics Canada: 2017
- Statistics Canada: 2017
- "Results Validated by the Returning Officer". Elections Canada. Retrieved 27 October 2019.
- "Final Election Expense Limits for Candidates: 43rd General Election - October 21, 2019". Elections Canada. Retrieved 2 December 2019.
- "October 19, 2015 Election Results — Beauséjour (Validated results)". Elections Canada. 21 October 2015. Retrieved 24 October 2015.
- Elections Canada – Preliminary Election Expenses Limits for Candidates Archived 2015-08-15 at the Wayback Machine
- Pundits' Guide to Canadian Elections
- Elections Canada – Official voting results, Forty-first general election, 2011
- Elections Canada – Candidate's electoral campaign return, 41st general election
- "School by School results". Student Vote Canada. Archived from the original on 2015-05-06. Retrieved 2013-06-12.
External links
Riding history from the Library of Parliament: