Dartmouth—Cole Harbour
Dartmouth—Cole Harbour (formerly Dartmouth and Dartmouth—Halifax East) is a federal electoral district in Nova Scotia, Canada, that has been represented in the House of Commons of Canada since 2004.
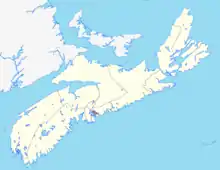 Dartmouth—Cole Harbour in relation to the other Nova Scotia federal electoral districts | |||
| Federal electoral district | |||
| Legislature | House of Commons | ||
| MP |
Liberal | ||
| District created | 1966 | ||
| First contested | 1968 | ||
| Last contested | 2019 | ||
| District webpage | profile, map | ||
| Demographics | |||
| Population (2016)[1] | 92,301 | ||
| Electors (2019) | 76,915 | ||
| Area (km²)[1] | 90 | ||
| Pop. density (per km²) | 1,025.6 | ||
| Census division(s) | Halifax | ||
| Census subdivision(s) | Halifax | ||
Demographics
| Year | Pop. | ±% |
|---|---|---|
| 2001 | 87,588 | — |
| 2006 | 87,886 | +0.3% |
| 2011 (2003 redist.) | 89,163 | +1.5% |
| 2011 (2015 redist.) | 91,212 | +2.3% |
| 2016 | 92,301 | +1.2% |
From the 2016 census [2]
Ethnic groups:
- European: 86.2%
- African descent: 4.5%
- Indigenous: 4.5%
- South Asian: 1.1%
- Other: 3.7%
Languages:
Religions:
- Protestant: 45.8%
- Catholic: 38.1%
- Other Christian: 1.4%
- No religious affiliation: 12.9%
Education:
- No certificate, diploma or degree: 20.7%
- High school certificate: 24.5%
- Apprenticeship or trade certificate or diploma: 10.2%
- Community college, CEGEP or other non-university certificate or diploma: 20.4%
- University certificate or diploma: 24.1%
Median Age:
- 40.5
Median total income:
- $27,005
Average total income:
- $34,363
Median household income:
- $53,222
Average household income:
- $64,493
Median family income:
- $68,047
Average family income:
- $77,776
Unemployment:
- 5.9%
Geography
The district includes the urban communities of Dartmouth and Cole Harbour in Halifax. The area is 90 km2 (35 sq mi).
Political geography
The Liberals and the NDP were the two main parties in 2008. The NDP saw much of its support in West Dartmouth, around Topsail Lake, the northern part of Cole Harbour, and the communities of Imperoyal and Woodside as well as the Cole Harbour 30 Indian Reserve. The Conservatives won two polls, both in Cole Harbour. The Liberals dominated in Central, Eastern and Northern Dartmouth and in southern Cole Harbour.
History
The riding of Dartmouth—Halifax East was created in 1966 when the former dual-member Halifax riding was split into two. The district consisted of the Dartmouth area, Bedford and most of eastern Halifax County. Bedford was moved to the riding of Halifax West in a 1976 redistribution. In 1987, the Dartmouth riding was created, taking in nearly all of the former territory of Dartmouth—Halifax East.
The electoral district of Dartmouth—Cole Harbour in 2004 was created from 86.8% of the population of the new riding came from Dartmouth, and 13.2% from Sackville—Musquodoboit Valley—Eastern Shore.
The 2012 federal electoral redistribution concluded that this riding will remain largely the same for the 42nd Canadian federal election. It lost a small fraction to the new riding of Sackville—Preston—Chezzetcook and gained a small portion (2%) from what was Sackville—Eastern Shore.
Member of Parliament
These ridings have elected the following Members of Parliament:
| Parliament | Years | Member | Party | |
|---|---|---|---|---|
| Dartmouth—Halifax East Riding created from Halifax |
||||
| 28th | 1968–1972 | Michael Forrestall | Progressive Conservative | |
| 29th | 1972–1974 | |||
| 30th | 1974–1979 | |||
| 31st | 1979–1980 | |||
| 32nd | 1980–1984 | |||
| 33rd | 1984–1988 | |||
| Dartmouth | ||||
| 34th | 1988–1993 | Ron MacDonald | Liberal | |
| 35th | 1993–1997 | |||
| 36th | 1997–2000 | Wendy Lill | New Democratic | |
| 37th | 2000–2004 | |||
| Dartmouth—Cole Harbour | ||||
| 38th | 2004–2006 | Michael Savage | Liberal | |
| 39th | 2006–2008 | |||
| 40th | 2008–2011 | |||
| 41st | 2011–2015 | Robert Chisholm | New Democratic | |
| 42nd | 2015–2019 | Darren Fisher | Liberal | |
| 43rd | 2019–present | |||
Election results
2019 general election
| 2019 Canadian federal election | ||||||||
|---|---|---|---|---|---|---|---|---|
| Party | Candidate | Votes | % | ±% | Expenditures | |||
| Liberal | Darren Fisher | 24,259 | 45.3 | -11.93 | $67,276.38 | |||
| New Democratic | Emma Norton | 14,438 | 27.0 | +2.59 | $39,533.04 | |||
| Conservative | Jason Cole | 8,637 | 16.1 | +2.07 | $41,695.00 | |||
| Green | Lil MacPherson | 5,280 | 9.9 | +6.50 | none listed | |||
| People's | Michelle Lindsay | 887 | 1.7 | $2,485.00 | ||||
| Total valid votes/Expense limit | 53,499 | 100.0 | $104,062.96 | |||||
| Total rejected ballots | 404 | |||||||
| Turnout | 53,903 | 70.0 | ||||||
| Eligible voters | 76,985 | |||||||
| Source: Elections Canada[3] | ||||||||
2015 general election
| 2015 Canadian federal election | ||||||||
|---|---|---|---|---|---|---|---|---|
| Party | Candidate | Votes | % | ±% | Expenditures | |||
| Liberal | Darren Fisher | 30,407 | 58.17 | +23.45 | $64,958.30 | |||
| New Democratic | Robert Chisholm | 12,757 | 24.41 | –12.02 | $137,358.97 | |||
| Conservative | Jason Cole | 7,331 | 14.03 | –11.00 | $52,263.31 | |||
| Green | Brynn Nheiley | 1,775 | 3.40 | –0.43 | $723.31 | |||
| Total valid votes/Expense limit | 52,270 | 99.62 | $205,945.13 | |||||
| Total rejected ballots | 201 | 0.38 | ||||||
| Turnout | 52,471 | 71.81 | ||||||
| Eligible voters | 73,066 | |||||||
| Liberal gain from New Democratic | Swing | +17.73 | ||||||
| Source: Elections Canada[4][5] | ||||||||
| 2011 federal election redistributed results[6] | |||
|---|---|---|---|
| Party | Vote | % | |
| New Democratic | 16,026 | 36.42 | |
| Liberal | 15,278 | 34.72 | |
| Conservative | 11,011 | 25.03 | |
| Green | 1,684 | 3.83 | |
2011 general election
| 2011 Canadian federal election | ||||||||
|---|---|---|---|---|---|---|---|---|
| Party | Candidate | Votes | % | ±% | Expenditures | |||
| New Democratic | Robert Chisholm | 15,678 | 36.27 | +4.73 | $51,111.67 | |||
| Liberal | Michael Savage | 15,181 | 35.12 | -4.37 | $70,147.67 | |||
| Conservative | Wanda Webber | 10,702 | 24.76 | +2.30 | $51,126.57 | |||
| Green | Paul Shreenan | 1,662 | 3.85 | -2.11 | $0.00 | |||
| Total valid votes/Expense limit | 43,223 | 99.41 | $83,954.73 | |||||
| Total rejected, unmarked and declined ballots | 255 | 0.59 | -0.01 | |||||
| Turnout | 43,478 | 61.45 | +2.72 | |||||
| Eligible voters | 70,756 | |||||||
| New Democratic gain from Liberal | Swing | +4.55 | ||||||
| Sources:[7][8] | ||||||||
2008 general election
| 2008 Canadian federal election | ||||||||
|---|---|---|---|---|---|---|---|---|
| Party | Candidate | Votes | % | ±% | Expenditures | |||
| Liberal | Michael Savage | 16,016 | 39.49 | -2.83 | $63,901.48 | |||
| New Democratic | Brad Pye | 12,793 | 31.55 | -0.95 | $56,900.80 | |||
| Conservative | Wanda Webber | 9,109 | 22.46 | -0.36 | $64,746.58 | |||
| Green | Paul Shreenan | 2,417 | 5.96 | +3.69 | $444.09 | |||
| Christian Heritage | George Campbell | 219 | 0.54 | – | $351.78 | |||
| Total valid votes/Expense limit | 40,554 | 100.0 | $80,942 | |||||
| Total rejected, unmarked and declined ballots | 245 | 0.60 | +0.23 | |||||
| Turnout | 40,799 | 58.73 | -3.71 | |||||
| Eligible voters | 69,469 | |||||||
| Liberal hold | Swing | -0.94 | ||||||
2006 general election
| 2006 Canadian federal election | ||||||||
|---|---|---|---|---|---|---|---|---|
| Party | Candidate | Votes | % | ±% | Expenditures | |||
| Liberal | Michael Savage | 19,027 | 42.32 | +0.25 | $67,910.96 | |||
| New Democratic | Peter Mancini | 14,612 | 32.50 | ±0 | $60,717.57 | |||
| Conservative | Robert A. Campbell | 10,259 | 22.82 | +1.72 | $41,775.58 | |||
| Green | Elizabeth Perry | 1,005 | 2.24 | -0.92 | $582.70 | |||
| Marxist–Leninist | Charles Spurr | 56 | 0.12 | -0.05 | none listed | |||
| Total valid votes/Expense limit | 44,959 | 100.0 | $76,265 | |||||
| Total rejected, unmarked and declined ballots | 166 | 0.37 | -0.07 | |||||
| Turnout | 45,125 | 62.44 | +0.51 | |||||
| Eligible voters | 72,264 | |||||||
| Liberal hold | Swing | +0.12 | ||||||
2004 general election
| 2004 Canadian federal election | ||||||||
|---|---|---|---|---|---|---|---|---|
| Party | Candidate | Votes | % | ±% | Expenditures | |||
| Liberal | Michael Savage | 17,425 | 42.07 | +8.18 | $62,046.28 | |||
| New Democratic | Susan MacAlpine-Gillis | 13,463 | 32.50 | -2.82 | $59,335.19 | |||
| Conservative | Michael MacDonald | 8,739 | 21.10 | -9.34 | $54,707.19 | |||
| Green | Michael Marshall | 1,311 | 3.16 | – | $200.00 | |||
| Progressive Canadian | Tracy Parsons | 415 | 1.00 | – | $1,140.15 | |||
| Marxist–Leninist | Charles Spurr | 70 | 0.17 | – | none listed | |||
| Total valid votes/Expense limit | 41,423 | 100.0 | $73,009 | |||||
| Total rejected, unmarked and declined ballots | 181 | 0.44 | ||||||
| Turnout | 41,604 | 61.93 | ||||||
| Eligible voters | 67,176 | |||||||
| Liberal notional gain from New Democratic | Swing | +5.50 | ||||||
| Changes from 2000 are based on redistributed results. Conservative Party change is based on the combination of Canadian Alliance and Progressive Conservative Party totals. | ||||||||
| 2000 federal election redistributed results | |||
|---|---|---|---|
| Party | Vote | % | |
| New Democratic | 13,805 | 35.32 | |
| Liberal | 13,246 | 33.89 | |
| Progressive Conservative | 8,413 | 21.52 | |
| Alliance | 3,488 | 8.92 | |
| Others | 135 | 0.35 | |
2000 general election
| 2000 Canadian federal election | ||||||||
|---|---|---|---|---|---|---|---|---|
| Party | Candidate | Votes | % | ±% | ||||
| New Democratic | Wendy Lill | 13,585 | 36.28 | +3.71 | ||||
| Liberal | Bernie Boudreau | 12,408 | 33.14 | +5.93 | ||||
| Progressive Conservative | Tom McInnis | 8,085 | 21.59 | -5.32 | ||||
| Alliance | Jordi Morgan | 3,282 | 8.76 | -2.99 | ||||
| Marxist–Leninist | Charles Spurr | 86 | 0.23 | |||||
| Total valid votes | 37,446 | 100.00 | ||||||
| Change for the Canadian Alliance from 1997 are based on the results of its predecessor, the Reform Party. | ||||||||
1997 general election
| 1997 Canadian federal election | ||||||||
|---|---|---|---|---|---|---|---|---|
| Party | Candidate | Votes | % | ±% | ||||
| New Democratic | Wendy Lill | 12,326 | 32.57 | +25.48 | ||||
| Liberal | Michael Savage | 10,298 | 27.21 | -23.60 | ||||
| Progressive Conservative | Rob McCleave | 10,183 | 26.91 | +3.33 | ||||
| Reform | John Cody | 4,446 | 11.75 | -3.87 | ||||
| Independent | Cliff Williams | 438 | 1.16 | -0.63 | ||||
| Natural Law | Claude Viau | 156 | 0.41 | -0.71 | ||||
| Total valid votes | 37,847 | 100.00 | ||||||
| Change for Independent candidate Cliff Williams is shown based on his results as a National Party candidate in 1993. | ||||||||
1993 general election
| 1993 Canadian federal election | ||||||||
|---|---|---|---|---|---|---|---|---|
| Party | Candidate | Votes | % | ±% | ||||
| Liberal | Ron MacDonald | 23,368 | 50.81 | +4.62 | ||||
| Progressive Conservative | Judith Gass | 10,843 | 23.58 | -18.20 | ||||
| Reform | Orest Ulan | 7,182 | 15.62 | |||||
| New Democratic | Marty Zelenietz | 3,261 | 7.09 | -3.77 | ||||
| National | Cliff Williams | 823 | 1.79 | |||||
| Natural Law | Claude Viau | 515 | 1.12 | |||||
| Total valid votes | 45,992 | 100.00 | ||||||
1988 general election
| 1988 Canadian federal election | ||||||||
|---|---|---|---|---|---|---|---|---|
| Party | Candidate | Votes | % | ±% | ||||
| Liberal | Ron MacDonald | 21,958 | 46.19 | +20.09 | ||||
| Progressive Conservative | Michael Forrestall | 19,863 | 41.78 | -13.17 | ||||
| New Democratic | Marty Zelenietz | 5,162 | 10.86 | -8.09 | ||||
| Libertarian | Stanley Hodder | 447 | 0.94 | |||||
| Independent | Charles Spurr | 109 | 0.23 | |||||
| Total valid votes | 47,539 | 100.00 | ||||||
1984 general election
| 1984 Canadian federal election | ||||||||
|---|---|---|---|---|---|---|---|---|
| Party | Candidate | Votes | % | ±% | ||||
| Progressive Conservative | Michael Forrestall | 27,549 | 54.95 | +13.10 | ||||
| Liberal | Rae Austin | 13,084 | 26.10 | -11.63 | ||||
| New Democratic | Ken Hale | 9,503 | 18.95 | -1.46 | ||||
| Total valid votes | 50,136 | 100.00 | ||||||
1980 general election
| 1980 Canadian federal election | ||||||||
|---|---|---|---|---|---|---|---|---|
| Party | Candidate | Votes | % | ±% | ||||
| Progressive Conservative | Michael Forrestall | 17,968 | 41.85 | -6.87 | ||||
| Liberal | Rae Austin | 16,200 | 37.73 | +2.62 | ||||
| New Democratic | Nelson Reed | 8,764 | 20.41 | +4.24 | ||||
| Total valid votes | 42,932 | 100.00 | ||||||
1979 general election
| 1979 Canadian federal election | ||||||||
|---|---|---|---|---|---|---|---|---|
| Party | Candidate | Votes | % | ±% | ||||
| Progressive Conservative | Michael Forrestall | 21,441 | 48.72 | -2.74 | ||||
| Liberal | John Savage | 15,453 | 35.11 | -5.53 | ||||
| New Democratic | Frederick Turley | 7,116 | 16.17 | +9.00 | ||||
| Total valid votes | 44,010 | 100.00 | ||||||
1974 general election
| 1974 Canadian federal election | ||||||||
|---|---|---|---|---|---|---|---|---|
| Party | Candidate | Votes | % | ±% | ||||
| Progressive Conservative | Michael Forrestall | 22,090 | 51.46 | -6.02 | ||||
| Liberal | Arnold Patterson | 17,444 | 40.64 | +8.93 | ||||
| New Democratic | Alfred Nieforth | 3,076 | 7.17 | -3.03 | ||||
| Social Credit | Anthony Morbee | 181 | 0.42 | -0.19 | ||||
| Marxist–Leninist | Mike Malloch | 135 | 0.31 | |||||
| Total valid votes | 42,926 | 100.00 | ||||||
1972 general election
| 1972 Canadian federal election | ||||||||
|---|---|---|---|---|---|---|---|---|
| Party | Candidate | Votes | % | ±% | ||||
| Progressive Conservative | Michael Forrestall | 24,553 | 57.48 | +2.31 | ||||
| Liberal | John Savage | 13,543 | 31.71 | -8.71 | ||||
| New Democratic | Norman Dares | 4,358 | 10.20 | +5.80 | ||||
| Social Credit | Brian Pitcairn | 261 | 0.61 | |||||
| Total valid votes | 42,715 | 100.00 | ||||||
1968 general election
| 1968 Canadian federal election | ||||||||
|---|---|---|---|---|---|---|---|---|
| Party | Candidate | Votes | % | |||||
| Progressive Conservative | Michael Forrestall | 19,694 | 55.17 | |||||
| Liberal | Arnie Patterson | 14, 429 | 40.42 | |||||
| New Democratic | Edward Newell | 1,572 | 4.40 | |||||
| Total valid votes | 35,695 | 100.00 | ||||||
References
- "(Code 12003) Census Profile". 2011 census. Statistics Canada. 2012. Retrieved 2011-03-03.
Notes
- Statistics Canada: 2012
- https://www12.statcan.gc.ca/census-recensement/2016/dp-pd/prof/details/page.cfm?Lang=E&Geo1=FED&Code1=12004&Geo2=PR&Code2=12&SearchText=Dartmouth--Cole%20Harbour&SearchType=Begins&SearchPR=01&B1=All&TABID=1&type=0
- "Preliminary results". Elections Canada. Retrieved October 25, 2019.
- "October 19, 2015 Election Results — Dartmouth—Cole Harbour (Validated results)". Elections Canada. 21 October 2015. Retrieved 24 October 2015.
- Elections Canada – Preliminary Election Expenses Limits for Candidates Archived August 15, 2015, at the Wayback Machine
- Pundits' Guide to Canadian Elections
- Elections Canada – Official voting results, Forty-first general election, 2011
- Elections Canada – Candidate's electoral campaign return, 41st general election