Halifax West
Halifax West (French: Halifax-Ouest) is a federal electoral district in Nova Scotia, Canada, that has been represented in the House of Commons of Canada since 1979. Its population in 2016 was 96,255.
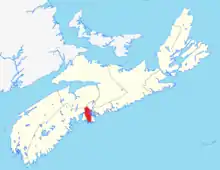 Halifax West in relation to other Nova Scotia federal electoral districts | |||
| Federal electoral district | |||
| Legislature | House of Commons | ||
| MP |
Liberal | ||
| District created | 1976 | ||
| First contested | 1979 | ||
| Last contested | 2019 | ||
| District webpage | profile, map | ||
| Demographics | |||
| Population (2016)[1] | 96,255 | ||
| Electors (2019) | 77,083 | ||
| Area (km²)[2] | 227.35 | ||
| Pop. density (per km²) | 423.4 | ||
| Census division(s) | Halifax | ||
| Census subdivision(s) | Halifax | ||
Demographics
| Year | Pop. | ±% |
|---|---|---|
| 2001 | 79,933 | — |
| 2006 | 88,756 | +11.0% |
| 2011 | 87,275 | −1.7% |
| 2016 | 96,255 | +10.3% |
From the 2006 census [3] Ethnic groups:
- White: 90.8%
- Black: 2.7%
- Arab: 2.4%
- South Asian: 1.5%
- Other: 2.6%
Languages:
Religions:
- Protestant: 43.0%
- Catholic: 39.8%
- Jewish: 2.4%
- Muslim: 2.3%
- Other Christian: 1.4%
- Christian Orthodox: 1.1%
- No religious affiliation: 8.4%
Education:
- No certificate, diploma or degree: 16.1%
- High school certificate: 22.4%
- Apprenticeship or trade certificate or diploma: 9.1%
- Community college, CEGEP or other non-university certificate or diploma: 19.1%
- University certificate or diploma: 33.2%
Median Age:
- 38.0
Median total income:
- $29,849
Average total income:
- $37,831
Median household income:
- $59,335
Average household income:
- $72,291
Median family income:
- $73,643
Average family income:
- $85,379
Unemployment:
- 5.9%
Geography
The district includes the communities of Bedford, the west end of Halifax, and an area that extends to the community of Upper Hammonds Plains in the north, Tantallon in the west and Terence Bay in the south. The area is 227.35 km2 (87.78 sq mi).
History
The electoral district was created in 1976 from Halifax—East Hants riding. This riding lost territory to South Shore—St. Margarets as a result of the 2012 federal electoral redistribution.
Members of Parliament
This riding has elected the following Members of Parliament:
| Parliament | Years | Member | Party | |
|---|---|---|---|---|
| Halifax West Riding created from Halifax—East Hants |
||||
| 31st | 1979–1980 | Howard Edward Crosby | Progressive Conservative | |
| 32nd | 1980–1984 | |||
| 33rd | 1984–1988 | |||
| 34th | 1988–1993 | |||
| 35th | 1993–1997 | Geoff Regan | Liberal | |
| 36th | 1997–2000 | Gordon Earle | New Democratic | |
| 37th | 2000–2004 | Geoff Regan | Liberal | |
| 38th | 2004–2006 | |||
| 39th | 2006–2008 | |||
| 40th | 2008–2011 | |||
| 41st | 2011–2015 | |||
| 42nd | 2015–2019 | |||
| 43rd | 2019–present | |||
Election results
2019 general election
| 2019 Canadian federal election | ||||||||
|---|---|---|---|---|---|---|---|---|
| Party | Candidate | Votes | % | ±% | Expenditures | |||
| Liberal | Geoff Regan | 26,885 | 49.46 | −19.19 | $47,993.19 | |||
| Conservative | Fred Shuman | 10,488 | 19.29 | +3.64 | $56,155.00 | |||
| New Democratic | Jacob Wilson | 10,429 | 19.19 | +7.42 | $3,588.81 | |||
| Green | Richard Zurawski | 6,555 | 12.06 | +8.12 | $1,525.90 | |||
| Total valid votes/Expense limit | 54,357 | 100.0 | $103,859.40 | |||||
| Total rejected ballots | 465 | 0.85 | +0.49 | |||||
| Turnout | 54,822 | 71.12 | −0.59 | |||||
| Eligible voters | 77,083 | |||||||
| Liberal hold | Swing | −11.42 | ||||||
| Source: Elections Canada[4] | ||||||||
2015 general election
| 2015 Canadian federal election | ||||||||
|---|---|---|---|---|---|---|---|---|
| Party | Candidate | Votes | % | ±% | Expenditures | |||
| Liberal | Geoff Regan | 34,377 | 68.65 | +31.38 | $51,596.91 | |||
| Conservative | Michael McGinnis | 7,837 | 15.65 | –14.53 | $34,660.89 | |||
| New Democratic | Joanne Hussey | 5,894 | 11.77 | –16.68 | $38,094.46 | |||
| Green | Richard Henryk Zurawski | 1,971 | 3.94 | –0.17 | $258.75 | |||
| Total valid votes/Expense limit | 50,079 | 100.00 | $203,472.37 | |||||
| Total rejected ballots | 181 | 0.36 | ||||||
| Turnout | 50,260 | 71.71 | ||||||
| Eligible voters | 70,089 | |||||||
| Liberal hold | Swing | +22.95 | ||||||
| Source: Elections Canada[5][6] | ||||||||
| 2011 federal election redistributed results[7] | |||
|---|---|---|---|
| Party | Vote | % | |
| Liberal | 14,824 | 37.27 | |
| Conservative | 12,005 | 30.18 | |
| New Democratic | 11,318 | 28.45 | |
| Green | 1,632 | 4.10 | |
2011 general election
| 2011 Canadian federal election | ||||||||
|---|---|---|---|---|---|---|---|---|
| Party | Candidate | Votes | % | ±% | Expenditures | |||
| Liberal | Geoff Regan | 16,230 | 35.92 | -5.64 | $61,795.88 | |||
| Conservative | Bruce Pretty | 13,782 | 30.50 | +9.37 | $51,236.29 | |||
| New Democratic | Gregor Ash | 13,239 | 29.30 | -0.30 | $42,761.72 | |||
| Green | Thomas Trappenberg | 1,931 | 4.27 | -2.81 | $860.31 | |||
| Total valid votes/Expense limit | 45,182 | 100.0 | $84,619.08 | |||||
| Total rejected, unmarked and declined ballots | 239 | 0.53 | +0.16 | |||||
| Turnout | 45,421 | 62.34 | +3.21 | |||||
| Eligible voters | 72,862 | |||||||
| Liberal hold | Swing | -7.47 | ||||||
| Sources:[8][9] | ||||||||
2008 general election
| 2008 Canadian federal election | ||||||||
|---|---|---|---|---|---|---|---|---|
| Party | Candidate | Votes | % | ±% | Expenditures | |||
| Liberal | Geoff Regan | 17,129 | 41.56 | -7.80 | $50,515.55 | |||
| New Democratic | Tamara Lorincz | 12,201 | 29.60 | +5.17 | $25,480.72 | |||
| Conservative | Rakesh Khosla | 8,708 | 21.13 | -1.91 | $29,390.36 | |||
| Green | Michael Munday | 2,920 | 7.08 | +3.90 | $2,823.08 | |||
| Christian Heritage | Trevor Ennis | 257 | 0.62 | – | $123.50 | |||
| Total valid votes/Expense limit | 41,215 | 100.0 | $81,056 | |||||
| Total rejected, unmarked and declined ballots | 154 | 0.37 | +0.04 | |||||
| Turnout | 41,369 | 59.13 | -3.92 | |||||
| Eligible voters | 69,960 | |||||||
| Liberal hold | Swing | -6.48 | ||||||
2006 general election
| 2006 Canadian federal election | ||||||||
|---|---|---|---|---|---|---|---|---|
| Party | Candidate | Votes | % | ±% | Expenditures | |||
| Liberal | Geoff Regan | 21,818 | 49.36 | +1.86 | $54,533.58 | |||
| New Democratic | Alan Hill | 10,798 | 24.43 | -3.52 | $15,656.30 | |||
| Conservative | Rakesh Khosla | 10,184 | 23.04 | +2.10 | $46,536.45 | |||
| Green | Thomas Trappenberg | 1,406 | 3.18 | -0.43 | $642.68 | |||
| Total valid votes/Expense limit | 44,206 | 100.0 | $75,552 | |||||
| Total rejected, unmarked and declined ballots | 147 | 0.33 | -0.02 | |||||
| Turnout | 44,353 | 63.05 | -0.46 | |||||
| Eligible voters | 70,349 | |||||||
| Liberal hold | Swing | +2.69 | ||||||
2004 general election
| 2004 Canadian federal election | ||||||||
|---|---|---|---|---|---|---|---|---|
| Party | Candidate | Votes | % | ±% | Expenditures | |||
| Liberal | Geoff Regan | 19,083 | 47.50 | +6.55 | $60,896.27 | |||
| New Democratic | Bill Carr | 11,228 | 27.95 | -0.12 | $33,350.95 | |||
| Conservative | Ken MacPhee | 8,413 | 20.94 | -9.26 | $32,442.47 | |||
| Green | Martin Willison | 1,452 | 3.61 | – | $1,152.00 | |||
| Total valid votes/Expense limit | 40,176 | 100.0 | $71,525 | |||||
| Total rejected, unmarked and declined ballots | 141 | 0.35 | ||||||
| Turnout | 40,317 | 63.51 | +3.64 | |||||
| Eligible voters | 63,479 | |||||||
| Liberal notional hold | Swing | +3.34 | ||||||
| Changes from 2000 are based on redistributed results. Conservative Party change is based on the combination of Canadian Alliance and Progressive Conservative Party totals. | ||||||||
| 2000 federal election redistributed results | |||
|---|---|---|---|
| Party | Vote | % | |
| Liberal | 14,289 | 40.95 | |
| New Democratic | 9,797 | 28.07 | |
| Progressive Conservative | 7,412 | 21.24 | |
| Alliance | 3,126 | 8.96 | |
| Others | 273 | 0.78 | |
2000 general election
| 2000 Canadian federal election | ||||||||
|---|---|---|---|---|---|---|---|---|
| Party | Candidate | Votes | % | ±% | ||||
| Liberal | Geoff Regan | 18,327 | 39.21 | +8.32 | ||||
| New Democratic | Gordon Earle | 14,016 | 29.99 | -4.64 | ||||
| Progressive Conservative | Charles Cirtwill | 9,701 | 20.76 | -2.70 | ||||
| Alliance | Hilda Stevens | 4,531 | 9.70 | -0.77 | ||||
| Marxist–Leninist | Tony Seed | 160 | 0.34 | +0.19 | ||||
| Total valid votes | 46,735 | 100.00 | ||||||
| Liberal gain from New Democratic | Swing | +6.48 | ||||||
Changes for the Canadian Alliance from 1997 are based on the results of its predecessor, the Reform Party.
1997 general election
| 1997 Canadian federal election | ||||||||
|---|---|---|---|---|---|---|---|---|
| Party | Candidate | Votes | % | ±% | ||||
| New Democratic | Gordon Earle | 16,013 | 34.63 | +26.23 | ||||
| Liberal | Geoff Regan | 14,284 | 30.89 | -14.73 | ||||
| Progressive Conservative | Heather Foley | 10,848 | 23.46 | -0.29 | ||||
| Reform | Stephen Oickle | 4,843 | 10.47 | -8.93 | ||||
| Natural Law | John Runkle | 179 | 0.39 | -0.42 | ||||
| Marxist–Leninist | Gary Zatzman | 70 | 0.15 | |||||
| Total valid votes | 46,237 | 100.00 | ||||||
| New Democratic gain from Liberal | Swing | +20.48 | ||||||
1993 general election
| 1993 Canadian federal election | ||||||||
|---|---|---|---|---|---|---|---|---|
| Party | Candidate | Votes | % | ±% | ||||
| Liberal | Geoff Regan | 26 904 | 45.62 | +7.01 | ||||
| Progressive Conservative | Joel Matheson | 14 005 | 23.75 | -21.00 | ||||
| Reform | Jim Donohue | 11,439 | 19.40 | |||||
| New Democratic | Sheila Richardson | 4,952 | 8.40 | -7.85 | ||||
| National | Kirby Judge | 1,201 | 2.04 | |||||
| Natural Law | Bernard Gormley | 475 | 0.81 | |||||
| Total valid votes | 58,976 | 100.00 | ||||||
| Liberal gain from Progressive Conservative | Swing | +14.01 | ||||||
1988 general election
| 1988 Canadian federal election | ||||||||
|---|---|---|---|---|---|---|---|---|
| Party | Candidate | Votes | % | ±% | ||||
| Progressive Conservative | Howard Crosby | 24,815 | 44.75 | -9.53 | ||||
| Liberal | Michael Kelly | 21,409 | 38.61 | +14.36 | ||||
| New Democratic | Lois Wiseman | 9,011 | 16.25 | -4.59 | ||||
| Commonwealth of Canada | Bob Fulcher | 217 | 0.39 | |||||
| Total valid votes | 55,452 | 100.00 | ||||||
1984 general election
| 1984 Canadian federal election | ||||||||
|---|---|---|---|---|---|---|---|---|
| Party | Candidate | Votes | % | ±% | ||||
| Progressive Conservative | Howard Crosby | 30,287 | 54.28 | +14.31 | ||||
| Liberal | Ben Prossin | 13,529 | 24.25 | -14.32 | ||||
| New Democratic | Dennis Theman | 11,626 | 20.84 | -0.07 | ||||
| Independent | Arthur Canning | 355 | 0.64 | +0.09 | ||||
| Total valid votes | 55,797 | 100.00 | ||||||
1980 general election
| 1980 Canadian federal election | ||||||||
|---|---|---|---|---|---|---|---|---|
| Party | Candidate | Votes | % | ±% | ||||
| Progressive Conservative | Howard Crosby | 19,195 | 39.97 | -7.24 | ||||
| Liberal | Dick Boyce | 18,522 | 38.57 | +3.85 | ||||
| New Democratic | Dennis Theman | 10,043 | 20.91 | +3.73 | ||||
| Independent | Arthur Canning | 266 | 0.55 | -0.02 | ||||
| Total valid votes | 48,026 | 100.00 | ||||||
1979 general election
| 1979 Canadian federal election | ||||||||
|---|---|---|---|---|---|---|---|---|
| Party | Candidate | Votes | % | |||||
| Progressive Conservative | Howard Crosby | 22,714 | 47.21 | |||||
| Liberal | Dick Boyce | 16,702 | 34.72 | |||||
| New Democratic | Dennis Theman | 8,265 | 17.18 | |||||
| Independent | Arthur Canning | 275 | 0.57 | |||||
| Independent | David Morgan | 152 | 0.32 | |||||
| Total valid votes | 48,108 | 100.00 | ||||||
References
- "(Code 12005) Census Profile". 2011 census. Statistics Canada. 2012. Retrieved 2011-03-03.
Notes
- "Census Profile, 2016 Census; Halifax West [Federal electoral district], Nova Scotia and Nova Scotia [Province]". www12.statcan.gc.ca. Statistics Canada. Retrieved 23 March 2020.
- "Census Profile, 2016 Census; Halifax West [Federal electoral district], Nova Scotia and Nova Scotia [Province]". www12.statcan.gc.ca. Statistics Canada. Retrieved 23 March 2020.
- Halifax West's census profile
- "Results Validated by the Returning Officer". Elections Canada. Retrieved 27 October 2019.
- "October 19, 2015 Election Results — Halifax West (Validated results)". Elections Canada. 21 October 2015. Retrieved 24 October 2015.
- "Elections Canada – Preliminary Election Expenses Limits for Candidates". Archived from the original on 2015-08-15. Retrieved 2018-11-10.
- Pundits' Guide to Canadian Elections
- Elections Canada – Official voting results, Forty-first general election, 2011
- Elections Canada – Candidate's electoral campaign return, 41st general election