Fundy Royal
Fundy Royal (formerly known as Royal from 1914 to 1966, Fundy—Royal from 1966 to 2003, and Fundy in 2003-2004) is a federal electoral district in southern New Brunswick, Canada, that has been represented in the House of Commons of Canada since 1917.
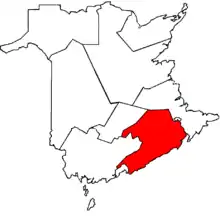 Fundy Royal in relation to other New Brunswick federal electoral districts (2003 boundaries) | |||
| Coordinates: | 45.789°N 65.270°W | ||
| Federal electoral district | |||
| Legislature | House of Commons | ||
| MP |
Conservative | ||
| District created | 1914 | ||
| First contested | 1917 | ||
| Last contested | 2019 | ||
| District webpage | profile, map | ||
| Demographics | |||
| Population (2016)[1] | 79,943 | ||
| Electors (2019) | 64,992 | ||
| Area (km²)[1] | 7,686 | ||
| Pop. density (per km²) | 10.4 | ||
| Census division(s) | Albert, Kings, Queens, Saint John, Westmorland | ||
| Census subdivision(s) | Alma, Alma, Brunswick, Cardwell, Elgin, Hammond, Harvey, Havelock, Hillsborough, Hillsborough (parish), Hopewell, Moncton (parish), Norton, Norton (parish), Quispamsis, Riverside-Albert, Riverview, Saint Martins, Salisbury (parish), Simonds, St. Martins, Sussex, Sussex (parish), Sussex Corner, Hampton, Coverdale, Salisbury, Kingston, St. Martins, Petitcodiac, Waterford, Waterborough, Westfield | ||
The riding roughly covers the area in between the three largest cities in the province; Fredericton, Saint John and Moncton. Included in the riding are the towns of Quispamsis, Hampton, Sussex, St. Martins, Petitcodiac, Salisbury and part of Riverview. Also included are the area around Loch Lomond east of Saint John, and the Kingston Peninsula.
The neighbouring ridings are Saint John—Rothesay, New Brunswick Southwest, Fredericton, Miramichi—Grand Lake, Moncton—Riverview—Dieppe, and Beauséjour.
History
The riding of "Royal" was created in 1914. The name came from the counties of Queens and Kings, of which it was composed.
In 1966, Royal riding was amalgamated with most of Albert County and a rural portion of Saint John County into a new riding, "Fundy—Royal". One parish in Queens county was reapportioned into York—Sunbury at this time. In the 2003 redistribution, it lost almost all of Queens County and a large part of Kings County to other ridings; while gaining western Westmorland County. The riding was renamed "Fundy". This name was changed to "Fundy Royal" in 2004. As per the 2012 federal electoral redistribution, this riding will gain territories from Beauséjour, Saint John and New Brunswick Southwest, and lose a small territory to the new riding of Saint John—Rothesay.
The riding has been one of the most supportive of the Conservatives in the country, returning a member of that party or its predecessors in every election, except for the 1993 election when Liberal Paul Zed won and the 2015 election when Liberal Alaina Lockhart won.
| Year | Pop. | ±% |
|---|---|---|
| 2001 | 67,675 | — |
| 2006 | 69,471 | +2.7% |
| 2011 | 73,484 | +5.8% |
Demographics
- According to the Canada 2011 Census; 2013 representation[2][3]
Ethnic groups: 97.1% White, 1.2% Aboriginal
Languages: 94.4% English, 4.6% French
Religions: 80.1% Christian (26.2% Catholic, 18.1% Baptist, 11.5% Anglican, 10.8% United Church, 2.7% Pentecostal, 1.3% Presbyterian, 9.5% Other), 19.4% No religion
Median income (2010): $30,151
Average income (2010): $37,853
Riding associations
Riding associations are the local branches of the national political parties:
| Party | Association Name | CEO | HQ Address | HQ City | |
| Green Party of Canada | Fundy Royal Green Party Association | Stephanie Coburn | 454 Main Street | Sussex | |
| Conservative Party of Canada | Fundy Royal Conservative Association | Janice Buck | 11 Barrett Road | Alma | |
| Liberal Party of Canada | Fundy Royal Federal Liberal Association | David Lutz | 14 Everett Street | Hampton | |
| New Democratic Party | Fundy Royal NDP Riding Association | Edward R. Shedd | 1709 845 Route | Clifton Royal | |
Members of Parliament
This riding has elected the following Members of Parliament:
| Parliament | Years | Member | Party | |
|---|---|---|---|---|
| Royal | ||||
| 13th | 1917–1921 | Hugh Havelock McLean | Government (Unionist) | |
| 14th | 1921–1925 | George Burpee Jones | Conservative | |
| 15th | 1925–1926 | |||
| 16th | 1926–1930 | |||
| 17th | 1930–1935 | |||
| 18th | 1935–1940 | Alfred Johnson Brooks | ||
| 19th | 1940–1945 | National Government | ||
| 20th | 1945–1949 | Progressive Conservative | ||
| 21st | 1949–1953 | |||
| 22nd | 1953–1957 | |||
| 23rd | 1957–1958 | |||
| 24th | 1958–1960 | |||
| 1960–1962 | Hugh John Flemming | |||
| 25th | 1962–1963 | Gordon Fairweather | ||
| 26th | 1963–1965 | |||
| 27th | 1965–1968 | |||
| Fundy—Royal | ||||
| 28th | 1968–1972 | Gordon Fairweather | Progressive Conservative | |
| 29th | 1972–1974 | |||
| 30th | 1974–1977 | |||
| 1978–1979 | Robert Corbett | |||
| 31st | 1979–1980 | |||
| 32nd | 1980–1984 | |||
| 33rd | 1984–1988 | |||
| 34th | 1988–1993 | |||
| 35th | 1993–1997 | Paul Zed | Liberal | |
| 36th | 1997–2000 | John Herron | Progressive Conservative | |
| 37th | 2000–2003 | |||
| 2003–2004 | Independent Progressive Conservative | |||
| Fundy Royal | ||||
| 38th | 2004–2006 | Rob Moore | Conservative | |
| 39th | 2006–2008 | |||
| 40th | 2008–2011 | |||
| 41st | 2011–2015 | |||
| 42nd | 2015–2019 | Alaina Lockhart | Liberal | |
| 43rd | 2019–present | Rob Moore | Conservative | |
Election results
Fundy Royal, 2013 Representation Order
| 2019 Canadian federal election | ||||||||
|---|---|---|---|---|---|---|---|---|
| Party | Candidate | Votes | % | ±% | Expenditures | |||
| Conservative | Rob Moore | 22,389 | 46.02 | +8.94 | $75,539.19 | |||
| Liberal | Alaina Lockhart | 12,433 | 25.56 | -15.31 | $70,219.03 | |||
| Green | Tim Thompson | 7,275 | 14.95 | +11.06 | $23,925.97 | |||
| New Democratic | James Tolan | 4,804 | 9.88 | -7.65 | $1,955.15 | |||
| People's | Rudy Neumayer | 1,249 | 2.57 | none listed | ||||
| Independent | David Raymond Amos | 295 | 0.61 | -0.03 | none listed | |||
| National Citizens Alliance | John Evans | 201 | 0.41 | none listed | ||||
| Total valid votes/Expense limit | 48,646 | 99.29 | ||||||
| Total rejected ballots | 349 | 0.71 | +0.02 | |||||
| Turnout | 48,995 | 75.39 | +0.79 | |||||
| Eligible voters | 64,992 | |||||||
| Conservative gain from Liberal | Swing | +12.13 | ||||||
| Source: Elections Canada[4][5] | ||||||||
| 2015 Canadian federal election | ||||||||
|---|---|---|---|---|---|---|---|---|
| Party | Candidate | Votes | % | ±% | Expenditures | |||
| Liberal | Alaina Lockhart | 19,136 | 40.87 | +30.44 | $44,760.36 | |||
| Conservative | Rob Moore | 17,361 | 37.09 | -20.88 | $94,342.23 | |||
| New Democratic | Jennifer McKenzie | 8,204 | 17.52 | -9.34 | $48,770.66 | |||
| Green | Stephanie Coburn | 1,823 | 3.89 | -0.83 | $1,469.99 | |||
| Independent | David Raymond Amos | 296 | 0.63 | – | – | |||
| Total valid votes/Expense limit | 46,820 | 100.0 | $204,844.46 | |||||
| Total rejected ballots | 241 | 0.51 | ||||||
| Turnout | 47,061 | 75.04 | ||||||
| Eligible voters | 62,713 | |||||||
| Liberal gain from Conservative | Swing | +25.66 | ||||||
Source(s)
| ||||||||
This riding gained territory from Beauséjour, Saint John and New Brunswick Southwest, and lost a small amount of territory to Saint John—Rothesay.
| 2011 federal election redistributed results[6] | |||
|---|---|---|---|
| Party | Vote | % | |
| Conservative | 22,821 | 57.96 | |
| New Democratic | 10,578 | 26.87 | |
| Liberal | 4,109 | 10.44 | |
| Green | 1,859 | 4.72 | |
| Others | 7 | 0.02 | |
Fundy Royal, 2003 Representation Order
| 2011 Canadian federal election | ||||||||
|---|---|---|---|---|---|---|---|---|
| Party | Candidate | Votes | % | ±% | Expenditures | |||
| Conservative | Rob Moore | 21,206 | 58.14 | +6.51 | $69,107.44 | |||
| New Democratic | Darryl Pitre | 9,845 | 26.99 | +3.26 | $16,490.62 | |||
| Liberal | Linda Wilhelm | 3,668 | 10.06 | -7.26 | $18,468.64 | |||
| Green | Stephanie Coburn | 1,757 | 4.82 | -2.50 | $4,477.15 | |||
| Total valid votes/Expense limit | 36,476 | 100.0 | $82,316.67 | |||||
| Total rejected, unmarked and declined ballots | 238 | 0.65 | -0.04 | |||||
| Turnout | 36,714 | 64.64 | +3.55 | |||||
| Eligible voters | 56,795 | |||||||
| Conservative hold | Swing | +1.62 | ||||||
| Sources:[7][8] | ||||||||
| 2008 Canadian federal election | ||||||||
|---|---|---|---|---|---|---|---|---|
| Party | Candidate | Votes | % | ±% | Expenditures | |||
| Conservative | Rob Moore | 17,220 | 51.63 | +3.29 | $68,450.59 | |||
| New Democratic | Rob Moir | 7,913 | 23.73 | +2.61 | $16,245.21 | |||
| Liberal | Mark Wright | 5,776 | 17.32 | -10.04 | $15,561.21 | |||
| Green | Erik Millett | 2,443 | 7.32 | +4.04 | $67.47 | |||
| Total valid votes/Expense limit | 33,352 | 100.0 | $79,136 | |||||
| Total rejected, unmarked and declined ballots | 233 | 0.69 | ±0 | |||||
| Turnout | 33,585 | 61.09 | -6.77 | |||||
| Eligible voters | 54,978 | |||||||
| Conservative hold | Swing | +0.34 | ||||||
| 2006 Canadian federal election | ||||||||
|---|---|---|---|---|---|---|---|---|
| Party | Candidate | Votes | % | ±% | Expenditures | |||
| Conservative | Rob Moore | 17,630 | 48.31 | +3.49 | $64,924.34 | |||
| Liberal | Eldon Hunter | 9,979 | 27.34 | -7.43 | $32,794.75 | |||
| New Democratic | Rob Moir | 7,696 | 21.09 | +4.90 | $8,504.17 | |||
| Green | Patty Donovan | 1,189 | 3.26 | +0.12 | $48.65 | |||
| Total valid votes/Expense limit | 36,494 | 100.0 | $73,430 | |||||
| Total rejected, unmarked and declined ballots | 253 | 0.69 | ±0 | |||||
| Turnout | 36,747 | 67.86 | +5.30 | |||||
| Eligible voters | 54,154 | |||||||
| Conservative hold | Swing | +5.46 | ||||||
Fundy, 2003 Representation Order
| 2004 Canadian federal election | ||||||||
|---|---|---|---|---|---|---|---|---|
| Party | Candidate | Votes | % | ±% | Expenditures | |||
| Conservative | Rob Moore | 14,997 | 44.82 | -18.46 | $63,125.86 | |||
| Liberal | John Herron | 11,635 | 34.77 | +5.30 | $52,913.85 | |||
| New Democratic | Pat Hanratty | 5,417 | 16.19 | +8.99 | $2,925.27 | |||
| Green | Karin Bach | 1,051 | 3.14 | – | none listed | |||
| Independent | David Amos | 358 | 1.07 | – | none listed | |||
| Total valid votes/Expense limit | 33,458 | 100.0 | $71,567 | |||||
| Total rejected, unmarked and declined ballots | 231 | 0.69 | ||||||
| Turnout | 33,689 | 62.56 | ||||||
| Eligible voters | 54,113 | |||||||
| Conservative notional gain from Progressive Conservative | Swing | -11.88 | ||||||
| Changes from 2000 are based on redistributed results. Conservative Party change is based on the combination of Canadian Alliance and Progressive Conservative Party totals. | ||||||||
| 2000 federal election redistributed results | |||
|---|---|---|---|
| Party | Vote | % | |
| Progressive Conservative | 12,380 | 37.62 | |
| Liberal | 9,698 | 29.47 | |
| Alliance | 8,444 | 25.66 | |
| New Democratic | 2,370 | 7.20 | |
| Others | 19 | 0.06 | |
Fundy—Royal
| 2000 Canadian federal election | ||||||||
|---|---|---|---|---|---|---|---|---|
| Party | Candidate | Votes | % | ±% | ||||
| Progressive Conservative | John Herron | 15,279 | 40.51 | -1.01 | ||||
| Liberal | John King | 11,422 | 30.28 | +4.96 | ||||
| Alliance | Rob Moore | 8,392 | 22.25 | -0.68 | ||||
| New Democratic | John Calder | 2,628 | 6.97 | -2.44 | ||||
| Total valid votes | 37,721 | 100.00 | ||||||
Results for the Canadian Alliance from 1997 are based on the results of its predecessor, the Reform Party.
| 1997 Canadian federal election | ||||||||
|---|---|---|---|---|---|---|---|---|
| Party | Candidate | Votes | % | ±% | ||||
| Progressive Conservative | John Herron | 16,715 | 41.52 | +13.11 | ||||
| Liberal | Paul Zed | 10,192 | 25.32 | -21.05 | ||||
| Reform | Roger Brown | 9,229 | 22.93 | +5.20 | ||||
| New Democratic | Larry Washburn | 3,790 | 9.41 | +4.61 | ||||
| Natural Law | Janice Sharon MacMillan | 329 | 0.82 | |||||
| Total valid votes | 40,255 | 100.00 | ||||||
| 1993 Canadian federal election | ||||||||
|---|---|---|---|---|---|---|---|---|
| Party | Candidate | Votes | % | ±% | ||||
| Liberal | Paul Zed | 21,677 | 46.37 | +10.10 | ||||
| Progressive Conservative | Robert Corbett | 13,282 | 28.41 | -18.29 | ||||
| Reform | Dan McKiel | 8,288 | 17.73 | |||||
| New Democratic | Mark Connell | 2,244 | 4.80 | -6.17 | ||||
| Independent | Colby Fraser | 1,258 | 2.69 | -3.37 | ||||
| Total valid votes | 46,749 | 100.00 | ||||||
Independent candidate Colby Fraser's change is based on his 1988 result running as a Confederation of Regions candidate.
| 1988 Canadian federal election | ||||||||
|---|---|---|---|---|---|---|---|---|
| Party | Candidate | Votes | % | ±% | ||||
| Progressive Conservative | Robert Corbett | 21,129 | 46.70 | -9.88 | ||||
| Liberal | Eldon Hunter | 16,411 | 36.27 | +11.30 | ||||
| New Democratic | Rosemarie McNairn | 4,965 | 10.97 | -7.48 | ||||
| Confederation of Regions | Colby Fraser | 2742 | 6.06 | |||||
| Total valid votes | 45,247 | 100.00 | ||||||
| 1984 Canadian federal election | ||||||||
|---|---|---|---|---|---|---|---|---|
| Party | Candidate | Votes | % | ±% | ||||
| Progressive Conservative | Robert Corbett | 26,021 | 56.58 | +15.74 | ||||
| Liberal | Donna Spalding | 11,482 | 24.97 | -11.96 | ||||
| New Democratic | Kay Bedell | 8,487 | 18.45 | -2.61 | ||||
| Total valid votes | 45,990 | 100.00 | ||||||
| 1980 Canadian federal election | ||||||||
|---|---|---|---|---|---|---|---|---|
| Party | Candidate | Votes | % | ±% | ||||
| Progressive Conservative | Robert Corbett | 16,805 | 40.84 | -6.44 | ||||
| Liberal | Joseph A. Day | 15,197 | 36.93 | +3.35 | ||||
| New Democratic | George Little | 8,668 | 21.06 | +1.92 | ||||
| Independent | Albert Brown | 335 | 0.81 | |||||
| Independent | Kevin Murphy | 145 | 0.35 | |||||
| Total valid votes | 41,150 | 100.00 | ||||||
| 1979 Canadian federal election | ||||||||
|---|---|---|---|---|---|---|---|---|
| Party | Candidate | Votes | % | ±% | ||||
| Progressive Conservative | Robert Corbett | 19,135 | 47.28 | -5.22 | ||||
| Liberal | Joseph A. Day | 13,589 | 33.58 | -3.51 | ||||
| New Democratic | Bruce E. Halpin | 7,746 | 19.14 | +8.73 | ||||
| Total valid votes | 40,470 | 100.00 | ||||||
| Canadian federal by-election, 16 October 1978 | ||||||||
|---|---|---|---|---|---|---|---|---|
| Party | Candidate | Votes | % | ±% | ||||
| On Gordon Fairweather's resignation, 1 September 1977 | ||||||||
| Progressive Conservative | Robert Corbett | 17,327 | 52.50 | +9.15 | ||||
| Liberal | Joseph A. Day | 12,241 | 37.09 | +2.60 | ||||
| New Democratic | Bruce E. Halpin | 3,434 | 10.41 | -3.38 | ||||
| Total valid votes | 33,002 | 100.00 | ||||||
| 1974 Canadian federal election | ||||||||
|---|---|---|---|---|---|---|---|---|
| Party | Candidate | Votes | % | ±% | ||||
| Progressive Conservative | Gordon Fairweather | 13,631 | 43.35 | -17.17 | ||||
| Liberal | Gordon L. Phippen | 10,845 | 34.49 | +4.90 | ||||
| New Democratic | Bruce E. Halpin | 4,337 | 13.79 | +6.87 | ||||
| Independent | Albert James Brown | 2,628 | 8.36 | |||||
| Total valid votes | 31,441 | 100.00 | ||||||
| 1972 Canadian federal election | ||||||||
|---|---|---|---|---|---|---|---|---|
| Party | Candidate | Votes | % | ±% | ||||
| Progressive Conservative | Gordon Fairweather | 19,107 | 60.52 | -0.76 | ||||
| Liberal | Gordon L. Phippen | 9,343 | 29.59 | -4.39 | ||||
| New Democratic | Bruce E. Halpin | 2,186 | 6.92 | +2.18 | ||||
| Social Credit | Ernest Gowlett | 937 | 2.97 | |||||
| Total valid votes | 31,573 | 100.00 | ||||||
| 1968 Canadian federal election | ||||||||
|---|---|---|---|---|---|---|---|---|
| Party | Candidate | Votes | % | ±% | ||||
| Progressive Conservative | Gordon Fairweather | 17,013 | 61.28 | +5.88 | ||||
| Liberal | A.J. Callaghan | 9,435 | 33.98 | -3.19 | ||||
| New Democratic | Hendrien Kippers | 1,316 | 4.74 | -2.69 | ||||
| Total valid votes | 27,764 | 100.00 | ||||||
Royal
| 1965 Canadian federal election | ||||||||
|---|---|---|---|---|---|---|---|---|
| Party | Candidate | Votes | % | ±% | ||||
| Progressive Conservative | Gordon Fairweather | 9,865 | 55.40 | +1.90 | ||||
| Liberal | Dorothy Dearborn | 6,619 | 37.17 | -3.91 | ||||
| New Democratic | Russell Bond | 1,324 | 7.43 | +5.04 | ||||
| Total valid votes | 17,808 | 100.00 | ||||||
| 1963 Canadian federal election | ||||||||
|---|---|---|---|---|---|---|---|---|
| Party | Candidate | Votes | % | ±% | ||||
| Progressive Conservative | Gordon Fairweather | 9,524 | 53.50 | +0.46 | ||||
| Liberal | Dorothy Dearborn | 7,314 | 41.08 | +0.97 | ||||
| Social Credit | John Stephen | 539 | 3.03 | +0.30 | ||||
| New Democratic | Russell Bond | 426 | 2.39 | -1.73 | ||||
| Total valid votes | 17,803 | 100.00 | ||||||
| 1962 Canadian federal election | ||||||||
|---|---|---|---|---|---|---|---|---|
| Party | Candidate | Votes | % | ±% | ||||
| Progressive Conservative | Gordon Fairweather | 9,805 | 53.04 | +1.13 | ||||
| Liberal | Harold Fredericks | 7,414 | 40.11 | -5.73 | ||||
| New Democratic | Hazen Wiggins | 762 | 4.12 | +1.87 | ||||
| Social Credit | Robert Reed | 504 | 2.73 | |||||
| Total valid votes | 18,485 | 100.00 | ||||||
Change for the New Democratic Party is based on the results from the Co-operative Commonwealth Federation in the 1960 by-election.
| By-election on 31 October 1960 | ||||||
| Party | Candidate | Votes | % | ±% | ||
|---|---|---|---|---|---|---|
| Progressive Conservative | Hugh John Flemming | 8,755 | 51.91 | -7.94 | ||
| Liberal | Harold Fredericks | 7,731 | 45.84 | +5.69 | ||
| Co-operative Commonwealth | George Henry Wheaton | 379 | 2.25 | |||
| Total valid votes | 16,865 | 100.00 | ||||
| 1958 Canadian federal election | ||||||||
|---|---|---|---|---|---|---|---|---|
| Party | Candidate | Votes | % | ±% | ||||
| Progressive Conservative | Alfred Johnson Brooks | 10,483 | 59.85 | +0.82 | ||||
| Liberal | Clifford O'Neil | 7,031 | 40.15 | -0.82 | ||||
| Total valid votes | 17,514 | 100.00 | ||||||
| 1957 Canadian federal election | ||||||||
|---|---|---|---|---|---|---|---|---|
| Party | Candidate | Votes | % | ±% | ||||
| Progressive Conservative | Alfred Johnson Brooks | 10,051 | 59.03 | +4.06 | ||||
| Liberal | Miles Jenkins | 6,977 | 40.97 | -4.06 | ||||
| Total valid votes | 17,028 | 100.00 | ||||||
| 1953 Canadian federal election | ||||||||
|---|---|---|---|---|---|---|---|---|
| Party | Candidate | Votes | % | ±% | ||||
| Progressive Conservative | Alfred Johnson Brooks | 9,725 | 54.97 | +3.04 | ||||
| Liberal | Harold Perkins | 7,968 | 45.03 | +2.06 | ||||
| Total valid votes | 17,693 | 100.00 | ||||||
| 1949 Canadian federal election | ||||||||
|---|---|---|---|---|---|---|---|---|
| Party | Candidate | Votes | % | ±% | ||||
| Progressive Conservative | Alfred Johnson Brooks | 9,501 | 51.93 | -1.08 | ||||
| Liberal | Harold Perkins | 7,863 | 42.97 | +2.72 | ||||
| Co-operative Commonwealth | Hazen Wiggins | 933 | 5.10 | -1.64 | ||||
| Total valid votes | 18,297 | 100.00 | ||||||
| 1945 Canadian federal election | ||||||||
|---|---|---|---|---|---|---|---|---|
| Party | Candidate | Votes | % | ±% | ||||
| Progressive Conservative | Alfred Johnson Brooks | 8,915 | 53.01 | +0.31 | ||||
| Liberal | Albert William Clark | 6,769 | 40.25 | -7.05 | ||||
| Co-operative Commonwealth | Frank Coates | 1,134 | 6.74 | |||||
| Total valid votes | 16,818 | 100.00 | ||||||
| 1940 Canadian federal election | ||||||||
|---|---|---|---|---|---|---|---|---|
| Party | Candidate | Votes | % | ±% | ||||
| Conservative | Alfred Johnson Brooks | 8017 | 52.70 | +4.95 | ||||
| Liberal | Donald V. White | 7,196 | 47.30 | +0.48 | ||||
| Total valid votes | 15,213 | 100.00 | ||||||
| 1935 Canadian federal election | ||||||||
|---|---|---|---|---|---|---|---|---|
| Party | Candidate | Votes | % | ±% | ||||
| Conservative | Alfred Johnson Brooks | 7,474 | 47.75 | -4.18 | ||||
| Liberal | Donald V. White | 7,329 | 46.82 | -1.25 | ||||
| Reconstruction | James McCrea | 849 | 5.42 | Ø | ||||
| Total valid votes | 15,652 | 100.00 | ||||||
| By-election on 27 June 1932 | ||||||
| Party | Candidate | Votes | % | ±% | ||
|---|---|---|---|---|---|---|
| Conservative | George Burpee Jones | 7,698 | 51.93 | -5.21 | ||
| Liberal | Donald V. White | 7,127 | 48.07 | +5.21 | ||
| Total valid votes | 14,825 | 100.00 | ||||
| 1930 Canadian federal election | ||||||||
|---|---|---|---|---|---|---|---|---|
| Party | Candidate | Votes | % | ±% | ||||
| Conservative | George Burpee Jones | 7,698 | 57.14 | +1.52 | ||||
| Liberal | Donald V. White | 5,774 | 42.86 | -1.52 | ||||
| Total valid votes | 13,472 | 100.00 | ||||||
| 1926 Canadian federal election | ||||||||
|---|---|---|---|---|---|---|---|---|
| Party | Candidate | Votes | % | ±% | ||||
| Conservative | George Burpee Jones | 7,485 | 55.62 | -1.52 | ||||
| Liberal | Duncan McAlister | 5,973 | 44.38 | +1.52 | ||||
| Total valid votes | 13,458 | 100.00 | ||||||
| 1925 Canadian federal election | ||||||||
|---|---|---|---|---|---|---|---|---|
| Party | Candidate | Votes | % | ±% | ||||
| Conservative | George Burpee Jones | 7,485 | 57.14 | +16.47 | ||||
| Liberal | Duncan McAlister | 5,614 | 42.86 | +3.04 | ||||
| Total valid votes | 13,099 | 100.00 | ||||||
| 1921 Canadian federal election | ||||||||
|---|---|---|---|---|---|---|---|---|
| Party | Candidate | Votes | % | ±% | ||||
| Conservative | George Burpee Jones | 5,551 | 40.67 | -27.10 | ||||
| Liberal | Duncan McAlister | 5,434 | 39.82 | +7.59 | ||||
| Independent | Harold Perkins | 2,663 | 19.51 | |||||
| Total valid votes | 13,648 | 100.00 | ||||||
| 1917 Canadian federal election | ||||||||
|---|---|---|---|---|---|---|---|---|
| Party | Candidate | Votes | % | |||||
| Government (Unionist) | Hugh Havelock McLean | 5,959 | 67.77 | |||||
| Opposition (Laurier Liberals) | Fred Ernest Sharp | 2,834 | 32.23 | |||||
| Total valid votes | 8,793 | 100.00 | ||||||
References
- "(Code 13004) Census Profile". 2011 census. Statistics Canada. 2012. Retrieved 2011-03-03.
Notes
- Statistics Canada: 2011
- http://www12.statcan.gc.ca/nhs-enm/2011/dp-pd/prof/details/page.cfm?Lang=E&Geo1=FED2013&Code1=13004&Data=Count&SearchText=Fundy%20Royal&SearchType=Begins&SearchPR=01&A1=All&B1=All&Custom=&TABID=1
- http://www12.statcan.gc.ca/nhs-enm/2011/dp-pd/prof/details/page.cfm?Lang=E&Geo1=FED2013&Code1=13004&Data=Count&SearchText=Fundy%20Royal&SearchType=Begins&SearchPR=01&A1=All&B1=All&Custom=&TABID=1#tabs2
- "List of confirmed candidates". Elections Canada. Retrieved October 3, 2019.
- "Election Night Results". Elections Canada. Retrieved November 14, 2019.
- Pundits' Guide to Canadian Elections
- Elections Canada – Official voting results, Forty-first general election, 2011
- Elections Canada – Candidate's electoral campaign return, 41st general election
External links
Riding history from the Library of Parliament:
