Cardigan (electoral district)
Cardigan is a federal electoral district in Prince Edward Island, Canada, that has been represented in the House of Commons of Canada since 1968.
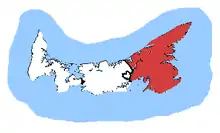 Cardigan in relation to the other Prince Edward Island ridings | |||
| Coordinates: | 46.344°N 62.507°W | ||
| Federal electoral district | |||
| Legislature | House of Commons | ||
| MP |
Liberal | ||
| District created | 1966 | ||
| First contested | 1968 | ||
| Last contested | 2019 | ||
| District webpage | profile, map | ||
| Demographics | |||
| Population (2016)[1] | 36,615 | ||
| Electors (2019) | 29,665 | ||
| Area (km²)[1] | 2,658 | ||
| Pop. density (per km²) | 13.8 | ||
| Census division(s) | Kings, Queens | ||
| Census subdivision(s) | Towns: Georgetown Montague Souris Stratford Villages: Morell, Mount Stewart, Murray Harbour, Murray River, St. Peters Bay First Nations reserves: Morell 2, Scotchfort 4 Lots Kings Royalty, Lot 35, 36, 37, 38, 39, 40, 41, 42, 43, 44, 45, 46, 47, 48, 49, 50, 51, 52, 53, 54, 55, 56, 57, 58, 59, 60, 61, 62, 63, 64, 66 | ||
Demographics
Ethnic groups: 98.5% White, 1.1% Native Canadian
Languages: 97.0% English, 1.2% French, 1.7% Other
Religions: 51.0% Catholic, 40.3% Protestant, 2.6% Other Christian, 5.9% No affiliation
Average income: $22 712
Cardigan is the riding with the highest percentage of people of Scottish (48.2%) and Irish (33.4%) ethnic origin (multiple responses).[2]
- According to the Canada 2016 Census
- Twenty most common mother tongue languages (2016) : 93.5% English, 2.1% Mandarin, 1.4% French, 0.4% Dutch, 0.3% German, 0.2% Arabic, 0.2% Spanish[3]
Geography
The district includes all of Kings County and eastern Queens County. It also includes Governors Island and Boughton Island.
According to Elections Canada, the geographic boundaries of this riding for the 39th General Election (2006) are:
Consisting of:
- (a) the County of Kings;
- (b) that part of the County of Queens comprised of: lots 35, 36, 37, 48, 49, 50, 57, 58, 60 and 62; the Town of Stratford; and
- (c) Governors Island and all other islands adjacent to the County of Kings and to the above-mentioned lots.
See the map of Cardigan riding.
Political geography
In the 2008 election, every poll except two voted Liberal. The only two polls that didn't, voted Conservative. These two polls were centred in the town of Georgetown, Prince Edward Island.
History
The electoral district was created in 1966 from parts of the ridings of King's and Queen's, with minor modifications to its boundaries since. The boundaries of this electoral district stayed unchanged for the 2012 federal electoral redistribution.
Members of Parliament
This riding has elected the following Members of Parliament:
| Parliament | Years | Member | Party | |
|---|---|---|---|---|
| Cardigan Riding created from King's and Queen's |
||||
| 28th | 1968–1972 | Melvin McQuaid | Progressive Conservative | |
| 29th | 1972–1974 | Daniel J. MacDonald | Liberal | |
| 30th | 1974–1979 | |||
| 31st | 1979–1980 | Wilbur MacDonald | Progressive Conservative | |
| 32nd | 1980–1980 | Daniel J. MacDonald | Liberal | |
| 1981–1984 | Bennett Campbell | |||
| 33rd | 1984–1988 | Pat Binns | Progressive Conservative | |
| 34th | 1988–1993 | Lawrence MacAulay | Liberal | |
| 35th | 1993–1997 | |||
| 36th | 1997–2000 | |||
| 37th | 2000–2004 | |||
| 38th | 2004–2006 | |||
| 39th | 2006–2008 | |||
| 40th | 2008–2011 | |||
| 41st | 2011–2015 | |||
| 42nd | 2015–2019 | |||
| 43rd | 2019–present | |||
Election results
2019 general election
| 2019 Canadian federal election | ||||||||
|---|---|---|---|---|---|---|---|---|
| Party | Candidate | Votes | % | ±% | Expenditures | |||
| Liberal | Lawrence MacAulay | 10,939 | 49.35 | −15.68 | $42,720.95 | |||
| Conservative | Wayne Phelan | 6,439 | 29.05 | +12.89 | none listed | |||
| Green | Glen Beaton | 3,068 | 13.84 | +7.46 | $13,490.35 | |||
| New Democratic | Lynne Thiele | 1,481 | 6.68 | −4.45 | $0.00 | |||
| Christian Heritage | Christene Squires | 240 | 1.08 | −0.23 | $278.30 | |||
| Total valid votes/Expense limit | 22,167 | 100.0 | $85,990.53 | |||||
| Total rejected ballots | 232 | 1.04 | +0.61 | |||||
| Turnout | 22,399 | 75.51 | −2.66 | |||||
| Eligible voters | 29,665 | |||||||
| Liberal hold | Swing | −14.29 | ||||||
| Source: Elections Canada[4] | ||||||||
2015 general election
| 2015 Canadian federal election | ||||||||
|---|---|---|---|---|---|---|---|---|
| Party | Candidate | Votes | % | ±% | Expenditures | |||
| Liberal | Lawrence MacAulay | 14,621 | 65.03 | +15.40 | $57,014.46 | |||
| Conservative | Julius Patkai | 3,632 | 16.15 | –22.22 | $36,428.35 | |||
| New Democratic | Billy Cann | 2,503 | 11.13 | +0.84 | $13,760.96 | |||
| Green | Teresa Doyle | 1,434 | 6.38 | +4.61 | $7,232.74 | |||
| Christian Heritage | Christene Squires | 295 | 1.31 | – | $2,681.69 | |||
| Total valid votes/Expense limit | 22,485 | 99.57 | $170,761.91 | |||||
| Total rejected ballots | 96 | 0.43 | –0.08 | |||||
| Turnout | 22,581 | 78.47 | +0.18 | |||||
| Eligible voters | 28,777 | |||||||
| Liberal hold | Swing | +18.81 | ||||||
| Source: Elections Canada[5][6] | ||||||||
2011 general election
| 2011 Canadian federal election | ||||||||
|---|---|---|---|---|---|---|---|---|
| Party | Candidate | Votes | % | ±% | Expenditures | |||
| Liberal | Lawrence MacAulay | 10,486 | 49.63 | -3.18 | $40,566.83 | |||
| Conservative | Michael Currie | 8,107 | 38.37 | +8.48 | $60,502.86 | |||
| New Democratic | Lorne Cudmore | 2,164 | 10.24 | +2.11 | $1,837.23 | |||
| Green | Leslie Stewart | 373 | 1.77 | -1.96 | $1,714.72 | |||
| Total valid votes/Expense limit | 21,130 | 100.0 | – | $69,835.73 | ||||
| Total rejected, unmarked and declined ballots | 108 | 0.51 | -0.02 | |||||
| Turnout | 21,238 | 78.29 | +8.03 | |||||
| Eligible voters | 27,127 | |||||||
| Liberal hold | Swing | -5.83 | ||||||
| Sources:[7][8] | ||||||||
2008 general election
| 2008 Canadian federal election | ||||||||
|---|---|---|---|---|---|---|---|---|
| Party | Candidate | Votes | % | ±% | Expenditures | |||
| Liberal | Lawrence MacAulay | 10,105 | 52.81 | -3.35 | $35,000.12 | |||
| Conservative | Sid McMullin | 5,661 | 29.59 | -4.09 | $29,907.51 | |||
| New Democratic | Mike Avery | 1,556 | 8.13 | +0.66 | $1,316.84 | |||
| Independent | Larry McGuire | 1,101 | 5.75 | – | none listed | |||
| Green | Emma Daughton | 710 | 3.71 | +1.02 | $2,546.13 | |||
| Total valid votes/Expense limit | 19,133 | 100.0 | – | $67,487 | ||||
| Total rejected, unmarked and declined ballots | 101 | 0.53 | -0.03 | |||||
| Turnout | 19,234 | 70.26 | -5.07 | |||||
| Eligible voters | 27,374 | |||||||
| Liberal hold | Swing | +0.37 | ||||||
2006 general election
| 2006 Canadian federal election | ||||||||
|---|---|---|---|---|---|---|---|---|
| Party | Candidate | Votes | % | ±% | Expenditures | |||
| Liberal | Lawrence MacAulay | 11,542 | 56.16 | +2.78 | $38,353.41 | |||
| Conservative | Don Gillis | 6,923 | 33.68 | +0.44 | $62,756.67 | |||
| New Democratic | Edith Perry | 1,535 | 7.47 | -2.68 | $1,532.80 | |||
| Green | Haida Arsenault-Antolick | 553 | 2.69 | -0.54 | $679.02 | |||
| Total valid votes/Expense limit | 20,533 | 100.0 | – | $63,115 | ||||
| Total rejected, unmarked and declined ballots | 116 | 0.56 | ||||||
| Turnout | 20,649 | 75.33 | ||||||
| Eligible voters | 27,411 | |||||||
| Liberal hold | Swing | +1.17 | ||||||
2004 general election
| 2004 Canadian federal election | ||||||||
|---|---|---|---|---|---|---|---|---|
| Party | Candidate | Votes | % | ±% | Expenditures | |||
| Liberal | Lawrence MacAulay | 11,064 | 53.38 | +6.56 | $54,157.07 | |||
| Conservative | Peter McQuaid | 6,889 | 33.24 | -14.78 | $59,824.10 | |||
| New Democratic | Dave MacKinnon | 2,103 | 10.15 | +5.09 | $20,929.08 | |||
| Green | Jeremy Stiles | 670 | 3.23 | – | $1,315.34 | |||
| Total valid votes/Expense limit | 20,726 | 100.0 | – | $61,091 | ||||
| Total rejected, unmarked and declined ballots | 137 | 0.66 | ||||||
| Turnout | 20,863 | 76.2 | ||||||
| Eligible voters | 27,656 | |||||||
| Liberal notional hold | Swing | +10.67 | ||||||
| Changes from 2000 are based on redistributed results. Change for the Conservatives is based on the combined totals of the Progressive Conservatives and the Canadian Alliance. | ||||||||
| 2000 federal election redistributed results | |||
|---|---|---|---|
| Party | Vote | % | |
| Liberal | 9,132 | 46.85 | |
| Progressive Conservative | 8,765 | 44.96 | |
| New Democratic | 987 | 5.06 | |
| Alliance | 596 | 3.06 | |
| Others | 14 | 0.07 | |
2000 general election
| 2000 Canadian federal election | ||||||||
|---|---|---|---|---|---|---|---|---|
| Party | Candidate | Votes | % | ±% | ||||
| Liberal | Lawrence MacAulay | 8,545 | 48.06 | +3.01 | ||||
| Progressive Conservative | Kevin MacAdam | 8,269 | 46.51 | +2.05 | ||||
| Alliance | Darrell Hickox | 500 | 2.81 | |||||
| New Democratic | Deborah Kelly Hawkes | 465 | 2.62 | -7.88 | ||||
| Total valid votes | 17,779 | 100.00 | ||||||
1997 general election
| 1997 Canadian federal election | ||||||||
|---|---|---|---|---|---|---|---|---|
| Party | Candidate | Votes | % | ±% | ||||
| Liberal | Lawrence MacAulay | 7,555 | 45.05 | -16.59 | ||||
| Progressive Conservative | Dan Hughes | 7,456 | 44.46 | +11.79 | ||||
| New Democratic | Larry Duchesne | 1,761 | 10.50 | +4.81 | ||||
| Total valid votes | 16,772 | 100.00 | ||||||
1993 general election
| 1993 Canadian federal election | ||||||||
|---|---|---|---|---|---|---|---|---|
| Party | Candidate | Votes | % | ±% | ||||
| Liberal | Lawrence MacAulay | 10,115 | 61.64 | +10.02 | ||||
| Progressive Conservative | Wilbur MacDonald | 5,360 | 32.67 | -11.26 | ||||
| New Democratic | Reg Phelan | 934 | 5.69 | +1.23 | ||||
| Total valid votes | 16,409 | 100.00 | ||||||
1988 general election
| 1988 Canadian federal election | ||||||||
|---|---|---|---|---|---|---|---|---|
| Party | Candidate | Votes | % | ±% | ||||
| Liberal | Lawrence MacAulay | 9,325 | 51.62 | +9.48 | ||||
| Progressive Conservative | Pat Binns | 7,936 | 43.93 | -9.43 | ||||
| New Democratic | Gertrude Partridge | 805 | 4.46 | -0.04 | ||||
| Total valid votes | 18,066 | 100.00 | ||||||
1984 general election
| 1984 Canadian federal election | ||||||||
|---|---|---|---|---|---|---|---|---|
| Party | Candidate | Votes | % | ±% | ||||
| Progressive Conservative | Pat Binns | 10,566 | 53.36 | +6.44 | ||||
| Liberal | Bennett Campbell | 8,344 | 42.14 | -6.90 | ||||
| New Democratic | Lorne Cudmore | 891 | 4.50 | +0.45 | ||||
| Total valid votes | 19,801 | 100.00 | ||||||
1981 by-election
| Canadian federal by-election, 13 April 1981 On the death of Daniel J. MacDonald, 30 September 1980 | ||||||||
|---|---|---|---|---|---|---|---|---|
| Party | Candidate | Votes | % | ±% | ||||
| Liberal | Bennett Campbell | 8,166 | 49.04 | +0.86 | ||||
| Progressive Conservative | Wilbur MacDonald | 7,813 | 46.92 | +2.02 | ||||
| New Democratic | Aubrey Cantello | 674 | 4.05 | -1.86 | ||||
| Total valid votes | 16,653 | 100.00 | ||||||
1980 general election
| 1980 Canadian federal election | ||||||||
|---|---|---|---|---|---|---|---|---|
| Party | Candidate | Votes | % | ±% | ||||
| Liberal | Daniel J. MacDonald | 8,590 | 48.18 | +1.51 | ||||
| Progressive Conservative | Wilbur MacDonald | 8,006 | 44.90 | -3.21 | ||||
| New Democratic | Aubrey Cantelo | 1,054 | 5.91 | +0.69 | ||||
| Independent | Arthur D. Reddin | 180 | 1.01 | |||||
| Total valid votes | 17,830 | 100.00 | ||||||
1979 general election
| 1979 Canadian federal election | ||||||||
|---|---|---|---|---|---|---|---|---|
| Party | Candidate | Votes | % | ±% | ||||
| Progressive Conservative | Wilbur MacDonald | 8,219 | 48.11 | +5.98 | ||||
| Liberal | Daniel J. MacDonald | 7,972 | 46.67 | -7.32 | ||||
| New Democratic | George MacFarlane | 892 | 5.22 | +1.94 | ||||
| Total valid votes | 17,083 | 100.00 | ||||||
1974 general election
| 1974 Canadian federal election | ||||||||
|---|---|---|---|---|---|---|---|---|
| Party | Candidate | Votes | % | ±% | ||||
| Liberal | Daniel J. MacDonald | 6,958 | 53.99 | +9.45 | ||||
| Progressive Conservative | Leo James Walsh | 5,429 | 42.13 | +0.95 | ||||
| New Democratic | Martin Gerard Kenny | 423 | 3.28 | -10.99 | ||||
| Independent | A. Neil Harpham | 77 | 0.60 | |||||
| Total valid votes | 12,887 | 100.00 | ||||||
1972 general election
| 1972 Canadian federal election | ||||||||
|---|---|---|---|---|---|---|---|---|
| Party | Candidate | Votes | % | ±% | ||||
| Liberal | Daniel J. MacDonald | 5,528 | 44.54 | -4.21 | ||||
| Progressive Conservative | Alfred Kenneth Fraser | 5,111 | 41.18 | -8.35 | ||||
| New Democratic | Aquinas Ryan | 1,771 | 14.27 | +12.51 | ||||
| Total valid votes | 12,410 | 100.00 | ||||||
1968 general election
| 1968 Canadian federal election | ||||||||
|---|---|---|---|---|---|---|---|---|
| Party | Candidate | Votes | % | |||||
| Progressive Conservative | Melvin McQuaid | 5,717 | 49.53 | |||||
| Liberal | John Mullally | 5,623 | 48.75 | |||||
| New Democratic | Spurgeon Joseph Hazelden | 203 | 1.76 | |||||
| Total valid votes | 11,543 | 100.00 | ||||||
Student Vote results
2011 election
In 2011, a Student Vote was conducted at participating Canadian schools to parallel the 2011 Canadian federal election results. The vote was designed to educate students and simulate the electoral process for persons who have not yet reached the legal majority. Schools with a large student body that reside in another electoral district had the option to vote for candidates outside of the electoral district then where they were physically located.[9]
| 2011 Canadian federal election | ||||||||
|---|---|---|---|---|---|---|---|---|
| Party | Candidate | Votes | % | |||||
| Liberal | Lawrence MacAulay | 456 | 35.82 | |||||
| Conservative | Michael Currie | 352 | 27.65 | |||||
| New Democratic | Lorne Cudmore | 244 | 19.17 | |||||
| Green | Leslie Stewart | 221 | 17.36 | |||||
| Total valid votes/Expense limit | 1,273 | 100.00 | ||||||
References
- "(Code 11001) Census Profile". 2011 census. Statistics Canada. 2012. Retrieved 3 March 2011.
- Cardigan riding from Elections Canada
- Riding history for Cardigan (1966–) from the Library of Parliament
- Election Financial Reports from Elections Canada
Notes
- Statistics Canada: 2012
- "2Profile of Ethnic Origin and Visible Minorities for Canada, Provinces, Territories and Federal Electoral Districts (2003 Representation Order), 2006 Census". 2.statcan.gc.ca. Retrieved 2 December 2012.
- https://www12.statcan.gc.ca/census-recensement/2016/dp-pd/dt-td/Rp-eng.cfm?LANG=E&APATH=3&DETAIL=0&DIM=0&FL=A&FREE=0&GC=0&GID=0&GK=0&GRP=1&PID=109979&PRID=10&PTYPE=109445&S=0&SHOWALL=0&SUB=888&Temporal=2016,2017&THEME=118&VID=0&VNAMEE=&VNAMEF=
- "Results Validated by the Returning Officer". Elections Canada. Retrieved 25 October 2019.
- "October 19, 2015 Election Results — Cardigan (Validated results)". Elections Canada. 20 October 2015. Retrieved 24 October 2015.
- Elections Canada – Preliminary Election Expenses Limits for Candidates Archived 15 August 2015 at the Wayback Machine
- Elections Canada – Official voting results, Forty-first general election, 2011
- Elections Canada – Candidate's electoral campaign return, 41st general election
- "School by School results". Student Vote Canada. Archived from the original on 6 May 2015. Retrieved 12 June 2013.