Moncton—Riverview—Dieppe
Moncton—Riverview—Dieppe (formerly known as Moncton) is a federal electoral district in New Brunswick, Canada, that has been represented in the House of Commons of Canada since 1968.
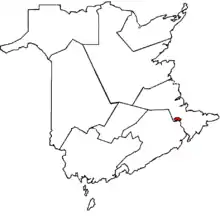 Moncton—Riverview—Dieppe in relation to the other New Brunswick ridings (2003 boundaries) | |||
| Coordinates: | 46.118°N 64.801°W | ||
| Federal electoral district | |||
| Legislature | House of Commons | ||
| MP |
Liberal | ||
| District created | 1966 | ||
| First contested | 1968 | ||
| Last contested | 2019 | ||
| District webpage | profile, map | ||
| Demographics | |||
| Population (2016)[1] | 92,666 | ||
| Electors (2019) | 74,572 | ||
| Area (km²)[2] | 168 | ||
| Pop. density (per km²) | 551.6 | ||
| Census division(s) | Albert, Westmorland | ||
| Census subdivision(s) | Cities: Dieppe (part) Moncton Towns: Riverview (part) | ||
Political geography
The riding of Moncton was created in 1966 when the district of Westmorland was split. The other riding is now called Beauséjour. The riding's initial area consisted of the city of Moncton and town of Dieppe, two parishes in Westmorland County (Moncton and Salisbury), and the Parish of Coverdale in Albert County.
As the Moncton area grew in population the riding shrank. The area of Albert County outside the town of Riverview was removed in 1976, a large area north of Moncton was removed in 1987, and the Petitcodiac and Salisbury areas were removed in 1997, to the point where the riding no longer has any largely rural areas. In 1998, Riverview and Dieppe were added to the riding's name. In 2003, the more Sub-Urban Areas of Riverview and the southern part of Dieppe was removed. Finally, in 2014, the remaining suburban areas of Dieppe was given to Beauséjour.
The riding includes the entire city of Moncton and most of the town of Riverview and the city of Dieppe excluding the north east section, i.e., Melanson Road and up to the city limits.[3][4]
The neighbouring ridings are Beauséjour and Fundy Royal.
As per the 2012 federal electoral redistribution, this riding will lose 8% of its territory to Beauséjour.
Demographics
| Year | Pop. | ±% |
|---|---|---|
| 2001 | 83,191 | — |
| 2006 | 89,334 | +7.4% |
| 2011 (2003 rep.) | 98,539 | +10.3% |
| 2011 (2013 rep.) | 89,484 | −9.2% |
- According to the Canada 2011 Census; 2013 representation[5]
Ethnic groups: 93.4% White, 2.0% Aboriginal, 1.6% Black
Languages: 63.6% English, 34.9% French
Religions: 78.3% Christian (47.8% Catholic, 8.9% Baptist, 7.9% United Church, 4.9% Anglican, 8.8% Other), 19.7% No religion
Median income (2010): $28,162
Average income (2010): $35,584
History
Moncton has elected some well-known and controversial Members of Parliament. Former mayor Leonard Jones, who took a tough stance against French language education, won the Progressive Conservative Party nomination for the 1974 election, but party leader Robert Stanfield refused to sign his nomination papers because of Jones' opposition to party policy on Official bilingualism. Jones ran and won as an independent candidate.
Dennis Cochrane, later the leader of the New Brunswick PC Party, represented the city for one term in the 1980s, and Conservative, Robert Goguen, is the riding's current representative in the House of Commons.
Members of Parliament
This riding has elected the following members of the House of Commons of Canada:
| Parliament | Years | Member | Party | |
|---|---|---|---|---|
| Moncton Riding created from Westmorland |
||||
| 28th | 1968–1972 | Charlie Thomas | Progressive Conservative | |
| 29th | 1972–1974 | |||
| 30th | 1974–1979 | Leonard Jones | Independent | |
| 31st | 1979–1980 | Gary McCauley | Liberal | |
| 32nd | 1980–1984 | |||
| 33rd | 1984–1988 | Dennis Cochrane | Progressive Conservative | |
| 34th | 1988–1993 | George Rideout | Liberal | |
| 35th | 1993–1997 | |||
| Moncton—Riverview—Dieppe | ||||
| 36th | 1997–2000 | Claudette Bradshaw | Liberal | |
| 37th | 2000–2004 | |||
| 38th | 2004–2006 | |||
| 39th | 2006–2008 | Brian Murphy | ||
| 40th | 2008–2011 | |||
| 41st | 2011–2015 | Robert Goguen | Conservative | |
| 42nd | 2015–2019 | Ginette Petitpas Taylor | Liberal | |
| 43rd | 2019–present | |||
Election results
| 2019 Canadian federal election | ||||||||
|---|---|---|---|---|---|---|---|---|
| Party | Candidate | Votes | % | ±% | Expenditures | |||
| Liberal | Ginette Petitpas Taylor | 22,261 | 42.95 | -14.80 | $57,476.19 | |||
| Conservative | Sylvie Godin-Charest | 12,200 | 23.54 | +2.08 | $71,897.56 | |||
| Green | Claire Kelly | 9,287 | 17.92 | +13.31 | $19,174.41 | |||
| New Democratic | Luke MacLaren | 6,164 | 11.89 | -4.29 | $2,074.25 | |||
| People's | Stephen Driver | 1,258 | 2.43 | * | none listed | |||
| Animal Protection | Brad MacDonald | 373 | 0.72 | * | $2,145.15 | |||
| Christian Heritage | Rhys Williams | 285 | 0.55 | * | $1,661.07 | |||
| Total valid votes/Expense limit | 51,828 | 100.00 | ||||||
| Total rejected ballots | 396 | 0.76 | +0.17 | |||||
| Turnout | 52,224 | 70.03 | -3.34 | |||||
| Eligible voters | 74,572 | |||||||
| Liberal hold | Swing | |||||||
| Source: Elections Canada[6][7] | ||||||||
This riding lost territory to Beauséjour for the 42nd Canadian federal election.
| 2015 Canadian federal election | ||||||||
|---|---|---|---|---|---|---|---|---|
| Party | Candidate | Votes | % | ±% | Expenditures | |||
| Liberal | Ginette Petitpas Taylor | 30,054 | 57.75 | +27.25 | $63,968.39 | |||
| Conservative | Robert Goguen | 11,168 | 21.46 | -15.30 | $94,944.45 | |||
| New Democratic | Luc LeBlanc | 8,420 | 16.18 | -12.28 | $33,592.43 | |||
| Green | Luc Melanson | 2,399 | 4.61 | +0.33 | $9,724.74 | |||
| Total valid votes/Expense limit | 52,041 | 100.00 | $204,679.96 | |||||
| Total rejected ballots | 311 | 0.59 | -0.13 | |||||
| Turnout | 52,352 | 73.37 | +8.20 | |||||
| Eligible voters | 71,350 | |||||||
| Liberal gain from Conservative | Swing | +21.28 | ||||||
| Source: Elections Canada[8][9] | ||||||||
| 2011 federal election redistributed results[10] | |||
|---|---|---|---|
| Party | Vote | % | |
| Conservative | 16,327 | 36.76 | |
| Liberal | 13,547 | 30.50 | |
| New Democratic | 12,637 | 28.46 | |
| Green | 1,899 | 4.28 | |
| 2011 Canadian federal election | ||||||||
|---|---|---|---|---|---|---|---|---|
| Party | Candidate | Votes | % | ±% | Expenditures | |||
| Conservative | Robert Goguen | 17,408 | 35.73 | -0.10 | $80,064.71 | |||
| Liberal | Brian Murphy | 15,247 | 31.29 | -7.84 | $73,135.32 | |||
| New Democratic | Shawna Gagné | 14,053 | 28.84 | +12.58 | $4,680.44 | |||
| Green | Steven Steeves | 2,016 | 4.14 | -4.65 | $6,300.16 | |||
| Total valid votes/Expense limit | 48,724 | 100.0 | $85,477.25 | |||||
| Total rejected, unmarked and declined ballots | 351 | 0.72 | +0.21 | |||||
| Turnout | 49,075 | 65.17 | +3.86 | |||||
| Eligible voters | 75,298 | |||||||
| Conservative gain from Liberal | Swing | +3.87 | ||||||
| Sources:[11][12] | ||||||||
| 2008 Canadian federal election | ||||||||
|---|---|---|---|---|---|---|---|---|
| Party | Candidate | Votes | % | ±% | Expenditures | |||
| Liberal | Brian Murphy | 17,797 | 39.13 | -8.58 | $73,263.48 | |||
| Conservative | Daniel Allain | 16,297 | 35.83 | +5.72 | $76,634.27 | |||
| New Democratic | Carl Bainbridge | 7,394 | 16.26 | -2.67 | $2,294.96 | |||
| Green | Alison Ménard | 3,998 | 8.79 | +5.86 | $4,619.17 | |||
| Total valid votes/Expense limit | 45,486 | 100.0 | $82,313 | |||||
| Total rejected, unmarked and declined ballots | 286 | 0.51 | -0.25 | |||||
| Turnout | 45,772 | 61.31 | -5.56 | |||||
| Eligible voters | 74,660 | |||||||
| Liberal hold | Swing | -7.15 | ||||||
| 2006 Canadian federal election | ||||||||
|---|---|---|---|---|---|---|---|---|
| Party | Candidate | Votes | % | ±% | Expenditures | |||
| Liberal | Brian Murphy | 22,918 | 47.71 | -11.58 | $58,854.77 | |||
| Conservative | Charles Doucet | 14,464 | 30.11 | +6.63 | $73,054.40 | |||
| New Democratic | David Hackett | 9,095 | 18.93 | +6.39 | $9,194.74 | |||
| Green | Camille Labchuk | 1,409 | 2.93 | -1.76 | none listed | |||
| Canadian Action | Ron Pomerleau | 150 | 0.31 | – | $694.45 | |||
| Total valid votes/Expense limit | 48,036 | 100.0 | $76,083 | |||||
| Total rejected, unmarked and declined ballots | 370 | 0.76 | -0.02 | |||||
| Turnout | 48,406 | 66.87 | +7.91 | |||||
| Eligible voters | 72,386 | |||||||
| Liberal hold | Swing | -9.10 | ||||||
| 2004 Canadian federal election | ||||||||
|---|---|---|---|---|---|---|---|---|
| Party | Candidate | Votes | % | ±% | Expenditures | |||
| Liberal | Claudette Bradshaw | 25,266 | 59.29 | +0.29 | $53,644.36 | |||
| Conservative | Jean LeBlanc | 10,003 | 23.48 | -9.79 | $51,960.12 | |||
| New Democratic | Hélène LaPointe | 5,344 | 12.54 | +5.50 | $4,202.78 | |||
| Green | Judith Hamel | 1,998 | 4.69 | – | $1,224.96 | |||
| Total valid votes/Expense limit | 42,611 | 100.0 | $74,841 | |||||
| Total rejected, unmarked and declined ballots | 336 | 0.78 | ||||||
| Turnout | 42,947 | 58.96 | -2.31 | |||||
| Eligible voters | 72,845 | |||||||
| Liberal notional hold | Swing | +5.04 | ||||||
| Changes from 2000 are based on redistributed results. Change for the Conservative Party is based on the combined results of its predecessors, the Canadian Alliance and the Progressive Conservatives. | ||||||||
| 2000 federal election redistributed results | |||
|---|---|---|---|
| Party | Vote | % | |
| Liberal | 23,432 | 59.00 | |
| Alliance | 6,983 | 17.58 | |
| Progressive Conservative | 6,231 | 15.69 | |
| New Democratic | 2,795 | 7.04 | |
| Others | 271 | 0.68 | |
| 2000 Canadian federal election | ||||||||
|---|---|---|---|---|---|---|---|---|
| Party | Candidate | Votes | % | ±% | ||||
| Liberal | Claudette Bradshaw | 26,545 | 58.74 | +14.18 | ||||
| Alliance | Kathryn Barnes | 8,130 | 17.99 | +5.01 | ||||
| Progressive Conservative | Serge Landry | 7,082 | 15.67 | -9.82 | ||||
| New Democratic | Hélène LaPointe | 3,139 | 6.95 | -9.10 | ||||
| Natural Law | Laurent Maltais | 297 | 0.66 | -0.25 | ||||
| Total valid votes | 45,193 | |||||||
Change for the Canadian Alliance are based on the 1997 results of its predecessor, the Reform Party.
| 1997 Canadian federal election | ||||||||
|---|---|---|---|---|---|---|---|---|
| Party | Candidate | Votes | % | ±% | ||||
| Liberal | Claudette Bradshaw | 20,860 | 44.57 | -21.90 | ||||
| Progressive Conservative | Linda Eaton | 11,931 | 25.49 | +11.33 | ||||
| New Democratic | Tom Barron | 7,510 | 16.05 | +11.13 | ||||
| Reform | Brent Steeves | 6,073 | 12.98 | +0.60 | ||||
| Natural Law | John Hogan | 424 | 0.91 | -0.06 | ||||
| Total valid votes | 46,798 | |||||||
Moncton
| 1993 Canadian federal election | ||||||||
|---|---|---|---|---|---|---|---|---|
| Party | Candidate | Votes | % | ±% | ||||
| Liberal | George Rideout | 33,790 | 66.47 | +19.56 | ||||
| Progressive Conservative | Bernadette LeBlanc | 7,199 | 14.16 | -19.84 | ||||
| Reform | Clyde Woodworth | 6,294 | 12.38 | Ø | ||||
| New Democratic | Gérard Snow | 2,503 | 4.92 | -4.74 | ||||
| Christian Heritage | Isaac Legere | 561 | 1.10 | -0.69 | ||||
| Natural Law | Ronald Openshaw | 491 | 0.97 | Ø | ||||
| Total valid votes | 50,838 | |||||||
| 1988 Canadian federal election | ||||||||
|---|---|---|---|---|---|---|---|---|
| Party | Candidate | Votes | % | ±% | ||||
| Liberal | George Rideout | 23,823 | 46.91 | +19.11 | ||||
| Progressive Conservative | Dennis Cochrane | 17,267 | 34.00 | -23.17 | ||||
| New Democratic | Terry Boudreau | 4,904 | 9.66 | -4.91 | ||||
| Confederation of Regions | Robert Hyslop | 3,703 | 7.29 | Ø | ||||
| Christian Heritage | David Little | 909 | 1.79 | Ø | ||||
| Independent | John Robert Gallant | 175 | 0.34 | Ø | ||||
| Total valid votes | 50,781 | |||||||
| 1984 Canadian federal election | ||||||||
|---|---|---|---|---|---|---|---|---|
| Party | Candidate | Votes | % | ±% | ||||
| Progressive Conservative | Dennis Cochrane | 29,936 | 57.17 | +22.26 | ||||
| Liberal | Gary McCauley | 14,557 | 27.80 | -20.16 | ||||
| New Democratic | Gregory Murphy | 7,629 | 14.57 | -2.14 | ||||
| Independent | Bob Kirk | 243 | 0.46 | Ø | ||||
| Total valid votes | 52,365 | |||||||
| 1980 Canadian federal election | ||||||||
|---|---|---|---|---|---|---|---|---|
| Party | Candidate | Votes | % | ±% | ||||
| Liberal | Gary McCauley | 22,365 | 47.96 | +4.63 | ||||
| Progressive Conservative | Dave Lockhart | 16,277 | 34.91 | -3.26 | ||||
| New Democratic | Gregory Murphy | 7,791 | 16.71 | -1.78 | ||||
| Independent | Raymond Léger | 146 | 0.31 | Ø | ||||
| Marxist–Leninist | Nancy DesRosiers | 51 | 0.11 | Ø | ||||
| Total valid votes | 46,630 | |||||||
| 1979 Canadian federal election | ||||||||
|---|---|---|---|---|---|---|---|---|
| Party | Candidate | Votes | % | ±% | ||||
| Liberal | Gary McCauley | 20,940 | 43.33 | +7.47 | ||||
| Progressive Conservative | Gary Wheeler | 18,446 | 38.17 | +23.88 | ||||
| New Democratic | Gregory Murphy | 8,936 | 18.49 | +15.17 | ||||
| Total valid votes | 48,322 | |||||||
| 1974 Canadian federal election | ||||||||
|---|---|---|---|---|---|---|---|---|
| Party | Candidate | Votes | % | ±% | ||||
| Independent | Leonard Jones | 20,671 | 45.76 | Ø | ||||
| Liberal | Léonide Cyr | 16,199 | 35.86 | -3.91 | ||||
| Progressive Conservative | Charlie Thomas | 6,456 | 14.29 | -38.33 | ||||
| New Democratic | David Britton | 1,501 | 3.32 | -1.33 | ||||
| Social Credit | Bob Taylor | 343 | 0.76 | -2.20 | ||||
| Total valid votes | 45,170 | |||||||
| 1972 Canadian federal election | ||||||||
|---|---|---|---|---|---|---|---|---|
| Party | Candidate | Votes | % | ±% | ||||
| Progressive Conservative | Charlie Thomas | 22,657 | 52.62 | +2.52 | ||||
| Liberal | Myron Mitton | 17,124 | 39.77 | -2.09 | ||||
| New Democratic | Morrie Baum | 2,003 | 4.65 | -1.85 | ||||
| Social Credit | Bob Taylor | 1,273 | 2.96 | Ø | ||||
| Total valid votes | 43,057 | |||||||
| 1968 Canadian federal election | ||||||||
|---|---|---|---|---|---|---|---|---|
| Party | Candidate | Votes | % | |||||
| Progressive Conservative | Charlie Thomas | 17,969 | 50.10 | |||||
| Liberal | Margaret Rideout | 15,013 | 41.86 | |||||
| New Democratic | Barrie N. Hould | 2,332 | 6.50 | |||||
| Independent | R.F. Robinson | 553 | 1.54 | |||||
| Total valid votes | 35,867 | |||||||
See also
References
- "(Code 13007) Census Profile". 2011 census. Statistics Canada. 2012. Retrieved 2011-03-03.
Notes
- Statistics Canada: 2011
- Statistics Canada: 2011
- http://www.cbc.ca/news/canadavotes/content/ridings_pdf/024.pdf
- http://www12.statcan.gc.ca/nhs-enm/2011/dp-pd/prof/details/page.cfm?Lang=E&Geo1=FED2013&Code1=13007&Data=Count&SearchText=Moncton&SearchType=Begins&SearchPR=01&A1=All&B1=All&Custom=&TABID=1#tabs2
- http://www12.statcan.gc.ca/nhs-enm/2011/dp-pd/prof/details/page.cfm?Lang=E&Geo1=FED2013&Code1=13007&Data=Count&SearchText=Moncton&SearchType=Begins&SearchPR=01&A1=All&B1=All&Custom=&TABID=1
- "List of confirmed candidates". Elections Canada. Retrieved October 3, 2019.
- "Election Night Results". Elections Canada. Retrieved November 13, 2019.
- Elections Canada – Confirmed candidates for Moncton—Riverview—Dieppe, 30 September 2015
- Elections Canada – Preliminary Election Expenses Limits for Candidates
- Pundits' Guide to Canadian Elections
- Elections Canada – Official voting results, Forty-first general election, 2011
- Elections Canada – Candidate's electoral campaign return, 41st general election
External links
Riding history from the Library of Parliament: