Madawaska—Restigouche
Madawaska—Restigouche is a federal electoral district in New Brunswick, Canada, that has been represented in the House of Commons of Canada since 1997. Its population in 2001 was 65,877.
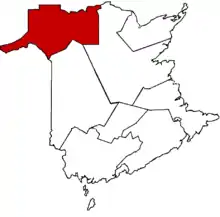 Madawaska—Restigouche in relation to other New Brunswick federal electoral districts | |||
| Coordinates: | 47.655°N 67.413°W | ||
| Federal electoral district | |||
| Legislature | House of Commons | ||
| MP |
Liberal | ||
| District created | 1996 | ||
| First contested | 1997 | ||
| Last contested | 2019 | ||
| District webpage | profile, map | ||
| Demographics | |||
| Population (2016)[1] | 60,378 | ||
| Electors (2019) | 50,631 | ||
| Area (km²)[2] | 11,701 | ||
| Pop. density (per km²) | 5.2 | ||
| Census division(s) | Madawaska, Restigouche | ||
| Census subdivision(s) | Edmundston, Campbellton, Dalhousie, Addington, Saint-Quentin, Kedgwick | ||
Political geography
The district includes all of the County of Madawaska (except Saint-André) and all of the County of Restigouche except the extreme eastern part.
The neighbouring ridings are Miramichi, Tobique—Mactaquac, Rimouski-Neigette—Témiscouata—Les Basques, Haute-Gaspésie—La Mitis—Matane—Matapédia, and Gaspésie—Îles-de-la-Madeleine.
| Year | Pop. | ±% |
|---|---|---|
| 2001 | 65,877 | — |
| 2006 | 62,593 | −5.0% |
| 2011 | 61,106 | −2.4% |
| 2016 | 60,378 | −1.2% |
In 2008, Liberal support was focused in the eastern and central parts of the riding, particularly in Edmundston, Campbellton, and Dalhousie. Support for the Conservatives was centered in the western part of the riding, in a strip of land bordering both Maine and Quebec. There was also a pocket of Tory support outside Saint-Leonard. The NDP won six polls in the riding, all in the Dalhousie area, a community they won.[3]
The electoral district was created in 1996 from Madawaska—Victoria and from Restigouche—Chaleur ridings. This riding will gain a small amount territory from Miramichi as a result of the 2012 federal electoral redistribution.
Members of Parliament
This riding has elected the following Members of Parliament:
| Parliament | Years | Member | Party | |
|---|---|---|---|---|
| Madawaska—Restigouche Riding created from Madawaska—Victoria and Restigouche—Chaleur |
||||
| 36th | 1997–2000 | Jean F. Dubé | Progressive Conservative | |
| 37th | 2000–2004 | Jeannot Castonguay | Liberal | |
| 38th | 2004–2006 | Jean-Claude D'Amours | ||
| 39th | 2006–2008 | |||
| 40th | 2008–2011 | |||
| 41st | 2011–2015 | Bernard Valcourt | Conservative | |
| 42nd | 2015–2019 | René Arseneault | Liberal | |
| 43rd | 2019–present | |||
Election results
| 2019 Canadian federal election | ||||||||
|---|---|---|---|---|---|---|---|---|
| Party | Candidate | Votes | % | ±% | Expenditures | |||
| Liberal | René Arseneault | 17,331 | 50.28 | -5.42 | $69,640.81 | |||
| Conservative | Nelson Fox | 9,801 | 28.43 | +11.95 | $41,501.75 | |||
| Green | Louis Bérubé | 5,125 | 14.87 | +12.97 | $11,518.03 | |||
| New Democratic | Chad Betteridge | 2,212 | 6.42 | -19.50 | $0.00 | |||
| Total valid votes/Expense limit | 34.469 | 98.13 | ||||||
| Total rejected ballots | 657 | 1.87 | +0.95 | |||||
| Turnout | 35,126 | 69.38 | -4.59 | |||||
| Eligible voters | 50,631 | |||||||
| Liberal hold | Swing | -8.68 | ||||||
| Source: Elections Canada[4][5] | ||||||||
This riding gained some territory from Miramichi for the 42nd Canadian federal election.
| 2015 Canadian federal election | ||||||||
|---|---|---|---|---|---|---|---|---|
| Party | Candidate | Votes | % | ±% | Expenditures | |||
| Liberal | René Arseneault | 20,778 | 55.70 | +20.91 | $66,315.47 | |||
| New Democratic | Rosaire L'Italien | 9,670 | 25.92 | +6.58 | $92,730.82 | |||
| Conservative | Bernard Valcourt | 6,151 | 16.49 | -23.99 | $101,364.85 | |||
| Green | Françoise Aubin | 707 | 1.90 | +0.10 | – | |||
| Total valid votes/Expense limit | 37,306 | 99.08 | $199,271.58 | |||||
| Total rejected ballots | 348 | 0.92 | – | |||||
| Turnout | 37,654 | 74.02 | – | |||||
| Eligible voters | 50,871 | |||||||
| Liberal gain from Conservative | Swing | +22.45 | ||||||
| Source: Elections Canada[6][7] | ||||||||
| 2011 federal election redistributed results[8] | |||
|---|---|---|---|
| Party | Vote | % | |
| Conservative | 14,541 | 40.48 | |
| Liberal | 12,497 | 34.79 | |
| New Democratic | 6,948 | 19.34 | |
| Others | 1,290 | 3.59 | |
| Green | 646 | 1.80 | |
| 2011 Canadian federal election | ||||||||
|---|---|---|---|---|---|---|---|---|
| Party | Candidate | Votes | % | ±% | Expenditures | |||
| Conservative | Bernard Valcourt | 14,224 | 40.64 | +7.41 | $52,308.15 | |||
| Liberal | Jean-Claude D'Amours | 12,309 | 35.17 | -12.23 | $60,570.18 | |||
| New Democratic | Wilder Jules | 6,562 | 18.75 | +3.13 | $6,934.01 | |||
| Independent | Louis Bérubé | 1,290 | 3.69 | – | $113.00 | |||
| Green | Lynn Morrison | 612 | 1.75 | -2.00 | $0.00 | |||
| Total valid votes/Expense limit | 34,997 | 100.0 | $81,731.56 | |||||
| Total rejected, unmarked and declined ballots | 577 | 1.62 | +0.04 | |||||
| Turnout | 35,574 | 69.80 | +3.03 | |||||
| Eligible voters | 50,966 | |||||||
| Conservative gain from Liberal | Swing | +9.82 | ||||||
| Sources:[9][10] | ||||||||
| 2008 Canadian federal election | ||||||||
|---|---|---|---|---|---|---|---|---|
| Party | Candidate | Votes | % | ±% | Expenditures | |||
| Liberal | Jean-Claude D'Amours | 16,266 | 47.40 | +9.06 | $77,108.64 | |||
| Conservative | Jean-Pierre Ouellet | 11,402 | 33.23 | -2.18 | $75,285.92 | |||
| New Democratic | Thérèse Tremblay-Philippe | 5,361 | 15.62 | -7.29 | $16,027.58 | |||
| Green | André Arpin | 1,287 | 3.75 | +0.40 | none listed | |||
| Total valid votes/Expense limit | 34,316 | 100.0 | $79,516 | |||||
| Total rejected, unmarked and declined ballots | 551 | 1.58 | -0.74 | |||||
| Turnout | 34,867 | 66.77 | -2.70 | |||||
| Eligible voters | 52,222 | |||||||
| Liberal hold | Swing | +5.62 | ||||||
| 2006 Canadian federal election | ||||||||
|---|---|---|---|---|---|---|---|---|
| Party | Candidate | Votes | % | ±% | Expenditures | |||
| Liberal | Jean-Claude D'Amours | 13,734 | 38.02 | -6.64 | $65,465.20 | |||
| Conservative | Jean-Pierre Ouellet | 12,849 | 35.57 | +11.56 | $65,196.27 | |||
| New Democratic | Rodolphe Martin | 8,322 | 23.04 | -4.55 | $45,462.27 | |||
| Green | Irka Laplante | 1,220 | 3.38 | -0.36 | $99.17 | |||
| Total valid votes/Expense limit | 36,125 | 100.0 | $74,283 | |||||
| Total rejected, unmarked and declined ballots | 857 | 2.32 | ||||||
| Turnout | 36,982 | 69.47 | ||||||
| Eligible voters | 53,233 | |||||||
| Liberal hold | Swing | -9.10 | ||||||
| 2004 Canadian federal election | ||||||||
|---|---|---|---|---|---|---|---|---|
| Party | Candidate | Votes | % | ±% | Expenditures | |||
| Liberal | Jean-Claude D'Amours | 14,144 | 44.66 | -7.75 | $62,057.16 | |||
| New Democratic | Rodolphe Martin | 8,737 | 27.59 | +23.18 | $16,654.06 | |||
| Conservative | Benoît Violette | 7,605 | 24.01 | -19.61 | $39,459.04 | |||
| Green | Jovette Cyr | 1,185 | 3.74 | – | none listed | |||
| Total valid votes/Expense limit | 31,671 | 100.0 | $72,739 | |||||
| Total rejected, unmarked and declined ballots | 1,268 | 3.85 | ||||||
| Turnout | 32,939 | 60.58 | -5.24 | |||||
| Eligible voters | 54,369 | |||||||
| Liberal notional hold | Swing | -15.46 | ||||||
| Changes from 2000 are based on redistributed results. Conservative Party change is based on the combination of Canadian Alliance and Progressive Conservative Party totals. | ||||||||
| 2000 federal election redistributed results | |||
|---|---|---|---|
| Party | Vote | % | |
| Liberal | 18,311 | 52.41 | |
| Progressive Conservative | 13,519 | 38.70 | |
| Alliance | 1,639 | 4.92 | |
| New Democratic | 1,467 | 4.41 | |
| 2000 Canadian federal election | ||||||||
|---|---|---|---|---|---|---|---|---|
| Party | Candidate | Votes | % | ±% | ||||
| Liberal | Jeannot Castonguay | 19,913 | 52.27 | +15.29 | ||||
| Progressive Conservative | Jean F. Dubé | 14,417 | 37.84 | -12.46 | ||||
| Alliance | Scott Chedore | 1,958 | 5.14 | |||||
| New Democratic | Claude Albert | 1,811 | 4.75 | -5.66 | ||||
| Total valid votes | 38,099 | 100.00 | ||||||
| 1997 Canadian federal election | ||||||||
|---|---|---|---|---|---|---|---|---|
| Party | Candidate | Votes | % | |||||
| Progressive Conservative | Jean F. Dubé | 20,343 | 50.30 | |||||
| Liberal | Guy Arseneault | 14,957 | 36.98 | |||||
| New Democratic | André Carrier | 4,211 | 10.41 | |||||
| Natural Law | Laurent Maltais | 933 | 2.31 | |||||
| Total valid votes | 40,444 | 100.00 | ||||||
References
- "(Code 13005) Census Profile". 2011 census. Statistics Canada. 2012. Retrieved 2011-03-03.
- Campaign expense data from Elections Canada
- Riding history from the Library of Parliament
Notes
- Statistics Canada: 2016
- Statistics Canada: 2012
- Pundit's Guide.ca http://www.punditsguide.ca/riding/?riding=973&pane=3
- "List of confirmed candidates". Elections Canada. Retrieved October 3, 2019.
- "Election Night Results". Elections Canada. Retrieved November 13, 2019.
- Elections Canada – Confirmed candidates for Madawaska—Restigouche, 30 September 2015
- Elections Canada – Preliminary Election Expenses Limits for Candidates Archived 2016-03-04 at the Wayback Machine
- Pundits' Guide to Canadian Elections
- Elections Canada – Official voting results, Forty-first general election, 2011
- Elections Canada – Candidate's electoral campaign return, 41st general election