Energy in New Zealand
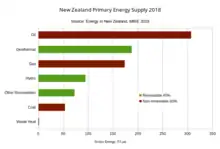
Despite abundant natural resources and a relatively small population, New Zealand is a net importer of energy, in the form of petroleum products. The ratio of non-renewable and renewable energy sources was fairly consistent from 1975 to 2008, with about 70 percent of primary energy supply coming from hydrocarbon fuels. This ratio decreased to about 60 percent in 2018.[1] The proportion of non-renewable energy varies annually, depending on water flows into hydro-electricity lakes and demand for energy.[2] In 2018, approximately 60% of primary energy was from non-renewable hydrocarbon fuels and 40% was from renewable sources.[1] In 2007 energy consumption per capita was 120 gigajoules. Per capita energy consumption had increased 8 per cent since 1998. New Zealand uses more energy per capita than 17 of 30 OECD countries.[3] New Zealand is one of 13 OECD countries that does not operate nuclear power stations.
From 1994 to 2018, the energy intensity of the economy per unit of GDP declined by 33 percent to 2.57 MJ/$.[1] A contributing factor is the growth of relatively less energy-intensive service industries.[4][5]
Energy supply
| Fuel | 1990 | 1995 | 2000 | 2005 | 2010 | 2015 | 2019 |
|---|---|---|---|---|---|---|---|
| Coal | 52.22 | 49.55 | 47.32 | 96.77 | 58.36 | 60.40 | 64.24 |
| Bituminous & sub-bituminous | 49.77 | 45.65 | 43.98 | 92.85 | 58.39 | 55.41 | 59.08 |
| Lignite | 2.45 | 3.90 | 3.33 | 3.93 | 4.47 | 4.99 | 5.17 |
| Oil | 156.63 | 207.52 | 245.91 | 284.69 | 271.25 | 291.38 | 295.90 |
| Crude | 188.65 | 201.55 | 231.51 | 235.78 | 236.32 | 260.73 | 247.20 |
| Petrol | 1.17 | 22.44 | 33.53 | 37.39 | 39.73 | 40.69 | 40.17 |
| Diesel | -15.91 | -1.71 | 2.22 | 33.82 | 26.90 | 30.35 | 52.10 |
| Aviation fuel & kerosene | -22.43 | -19.43 | -21.04 | -21.19 | -31.72 | -37.00 | −47.08 |
| LPG | 5.49 | 5.08 | 5.04 | 8.59 | 7.11 | 8.25 | 9.14 |
| Fuel oil | −8.24 | −9.46 | −12.62 | −16.81 | −14.16 | −19.57 | –19.92 |
| Others | 7.91 | 9.06 | 7.58 | 7.12 | 7.06 | 8.02 | 14.29 |
| Natural Gas | 180.14 | 178.01 | 235.29 | 150.16 | 173.38 | 190.23 | 185.09 |
| Renewables | 186.05 | 208.95 | 230.36 | 239.01 | 311.75 | 365.20 | 356.16 |
| Geothermal | 62.49 | 63.07 | 82.01 | 83.35 | 152.19 | 205.06 | 195.80 |
| Hydro | 83.46 | 99.42 | 87.96 | 83.97 | 89.05 | 88.33 | 92.07 |
| Wood & solid biofuels | 38.32 | 44.44 | 58.44 | 66.53 | 60.95 | 53.26 | 55.55 |
| Wind | – | 0.00 | 0.43 | 2.21 | 5.89 | 8.47 | 8.12 |
| Biogas | 1.78 | 2.32 | 1.52 | 2.71 | 3.12 | 3.46 | 3.63 |
| Solar | – | – | – | 0.24 | 0.37 | 0.49 | 0.82 |
| Liquid biofuels | – | – | – | – | 0.18 | 0.13 | 0.18 |
| Waste Heat | 1.61 | 1.61 | 1.61 | 1.95 | 1.47 | 1.26 | 1.17 |
| Total | 576.64 | 645.65 | 760.50 | 772.59 | 816.21 | 908.46 | 902.55 |
Coal
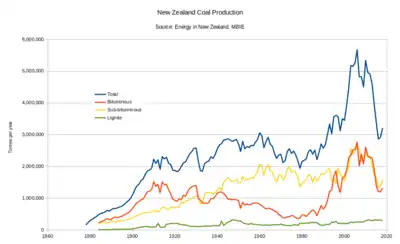
Coal is produced from 18 opencast mines.[7] Over 80% of New Zealand's coal reserves are contained in Southland lignite deposits. Most coal production is of bituminous and sub-bituminous coals, and most of this is exported.[8]
Oil and gas
Oil and gas is produced from 21 petroleum licenses / permits, all in the Taranaki basin.[9] The most important fields are Kapuni, Maui, Pohokura and Kupe. Exploration for oil and gas reserves includes the Great South Basin and offshore areas near Canterbury and Gisborne. Reticulated natural gas is available in most major North Island towns and cities.
Renewable energy
Approximately 40% of primary energy is from renewable energy sources. Approximately 80% of electricity comes from renewable energy, primarily hydropower and geothermal power.[1] Studies have shown that it is technically feasible to provide 100% of the electricity demand by renewable power without risking with shortages in energy supply.[10][11] The global full-scale adoption of renewable energy will provide New Zealand with a number of geopolitical benefits as the index of geopolitical gains and losses after energy transition (GeGaLo Index) shows and where the country is ranked no. 5 out of 156 nations.[12]
Energy consumption
| Fuel | Primary | Industrial | Commercial | Transport | Residential |
|---|---|---|---|---|---|
| Coal | 2.21 | 23.83 | 0.88 | – | 0.27 |
| Bituminous & sub-bituminous | 2.19 | 19.11 | 0.65 | – | 0.23 |
| Lignite | 0.01 | 4.72 | 0.23 | – | 0.03 |
| Oil | 16.52 | 22.08 | 8.69 | 232.60 | 3.86 |
| Diesel | 14.36 | 17.25 | 5.72 | 104.19 | 0.13 |
| Petrol | 1.02 | 0.07 | 0.74 | 111.33 | 0.00 |
| Aviation fuel & kerosene | – | – | – | 12.45 | – |
| LPG | 0.11 | 3.68 | 1.75 | 0.14 | 3.73 |
| Fuel oil | 1.02 | 1.08 | 0.47 | 4.50 | – |
| Natural Gas | 1.35 | 67.86 | 8.51 | – | 6.83 |
| Renewables | 0.45 | 48.62 | 2.88 | – | 8.11 |
| Wood & solid biofuels | – | 43.78 | – | – | 7.53 |
| Geothermal | 0.54 | 4.78 | 2.60 | – | 0.21 |
| Biogas | – | 0.05 | 0.28 | – | – |
| Solar | – | – | – | – | 0.36 |
| Electricity | 9.16 | 54.46 | 34.27 | 0.39 | 45.54 |
| Total | 29.69 | 216.85 | 55.22 | 232.99 | 64.61 |
International comparisons
| International consumption of energy (calendar year 2014)[5] |
Oil products (tonnes per person) |
Gas (m³ per person) |
Electricity (kWh per person) |
|---|---|---|---|
| Mexico | 0.60 | 634 | 2,496 |
| Turkey | 0.30 | 623 | 3,259 |
| Portugal | 0.60 | 393 | 4,974 |
| UK | 0.70 | 1,147 | 5,578 |
| Germany | 0.92 | 969 | 7,170 |
| France | 0.91 | 597 | 7,483 |
| Japan | 0.93 | 1,055 | 8,065 |
| New Zealand | 1.25 | 1,207 | 9,802 |
| Australia | 1.83 | 1,727 | 11,028 |
| USA | 1.93 | 2,384 | 13,734 |
| Canada | 1.86 | 3,065 | 17,026 |
| Norway | 1.58 | 1,200 | 24,621 |
In terms of energy intensity, New Zealand is just a little lower than the global average.
Electrical energy
Electrical energy in New Zealand is mainly derived from renewable energy sources such as from hydropower, geothermal power and wind energy. The large share of renewable energy sources makes New Zealand one of the most sustainable countries in terms of energy generation. Electricity demand increased by an average of 2.1% per year from 1974 to 2008 and since then has been relatively constant overall.[5]
Governmental jurisdiction
The Ministry of Business, Innovation and Employment is responsible for economic issues surrounding energy use and the Ministry for the Environment addresses the environmental impact of energy use in New Zealand. Exploration and production of fossil fuels comes under Crown Minerals, a division of the Ministry of Economic Development. The Energy Efficiency and Conservation Authority is responsible for preparing a statutory national energy efficiency and conservation strategy for approval by the administering Minister.[13]
References
- "Energy in New Zealand". MBIE. 22 October 2019. Retrieved 9 November 2019.
- MfE (December 2007). "Chapter 5 Energy Current pressures and trends". Environment New Zealand 2007. ME 847. Wellington, N.Z.: Ministry for the Environment. ISBN 978-0-478-30191-5.
- MfE (July 2009). "Environmental Report Card Energy Supply and Demand". INFO 421. Ministry for the Environment. Retrieved 30 May 2012.
- "Key Findings on New Zealand's Progress Using a Sustainable Development Approach". Statistics New Zealand. 2010. Retrieved 21 April 2012.
- "Energy in New Zealand". MBIE. August 2015. Archived from the original on 15 February 2016. Retrieved 23 August 2015.
- "Energy in New Zealand 2020". Ministry of Business, Innovation & Employment. Retrieved 11 November 2020.
- "Operating coal mine production figures". New Zealand Petroleum and Minerals. 30 May 2017.
- "Coal". Energy Statistics. MBIE. 4 October 2017. Archived from the original on 13 August 2018. Retrieved 21 October 2017.
- "Petroleum Overview". Crown Minerals, Ministry of Economic Development. 26 June 2008.
- Mason, I.G.; Page, S.C.; Williamson, A.G. (August 2010). "A 100% renewable electricity generation system for New Zealand utilising hydro, wind, geothermal and biomass resources". Energy Policy. 38 (8): 3973–3984. doi:10.1016/j.enpol.2010.03.022.
- Mason, I.G.; Page, S.C.; Williamson, A.G. (September 2013). "Security of supply, energy spillage control and peaking options within a 100% renewable electricity system for New Zealand". Energy Policy. 60: 324–333. doi:10.1016/j.enpol.2013.05.032.
- Overland, Indra; Bazilian, Morgan; Ilimbek Uulu, Talgat; Vakulchuk, Roman; Westphal, Kirsten (1 November 2019). "The GeGaLo index: Geopolitical gains and losses after energy transition". Energy Strategy Reviews. 26: 100406. doi:10.1016/j.esr.2019.100406.
- "Section 13. Preparation of draft strategy". Energy Efficiency and Conservation Act 2000 No 14. New Zealand government. Retrieved 15 August 2010.
Further reading
- Smith, Clint (October 2010). "The next oil shock?" (PDF). New Zealand Government.
- Freeman, Philip; Atkinson, Vanessa; Teske, Sven (February 2007). Adelia Hallett (ed.). New Zealand Energy Revolution: How to prevent climate chaos. Greenpeace.
External links
- Energy and Resources page at the Ministry of Economic Development
- New Zealand Energy Strategy at the Ministry of Economic Development
- Ministry for the Environment – energy issues
- Energy Efficiency and Conservation Authority
- Energywise – a consumer guide for energy conservation operated by Energy Efficiency and Conservation Authority
- New Zealand Energy Sector Excellence Awards – Annual New Zealand Energy Sector Excellence Awards