Genuine progress indicator
Genuine progress indicator (GPI) is a metric that has been suggested to replace, or supplement, gross domestic product (GDP).[1] The GPI is designed to take fuller account of the well-being of a nation, only a part of which pertains to the size of the nation's economy, by incorporating environmental and social factors which are not measured by GDP. For instance, some models of GPI decrease in value when the poverty rate increases.[2] The GPI separates the concept of societal progress from economic growth.
The GPI is used in ecological economics, "green" economics, sustainability and more inclusive types of economics. It factors in environmental and carbon footprints that businesses produce or eliminate, including in the forms of resource depletion, pollution and long-term environmental damage.[2] GDP is increased twice when pollution is created, since it increases once upon creation (as a side-effect of some valuable process) and again when the pollution is cleaned up; in contrast, GPI counts the initial pollution as a loss rather than a gain, generally equal to the amount it will cost to clean up later plus the cost of any negative impact the pollution will have in the meantime. While quantifying costs and benefits of these environmental and social externalities is a difficult task, "Earthster-type databases could bring more precision and currency to GPI's metrics."[2] It has been noted that such data may also be embraced by those who attempt to "internalize externalities" by making companies pay the costs of the pollution they create (rather than having the government or society at large bear those costs) "by taxing their goods proportionally to their negative ecological and social impacts".[2]
GPI is an attempt to measure whether the environmental impact and social costs of economic production and consumption in a country are negative or positive factors in overall health and well-being. By accounting for the costs borne by the society as a whole to repair or control pollution and poverty, GPI balances GDP spending against external costs. GPI advocates claim that it can more reliably measure economic progress, as it distinguishes between the overall "shift in the 'value basis' of a product, adding its ecological impacts into the equation".[2]:Ch. 10.3 Comparatively speaking, the relationship between GDP and GPI is analogous to the relationship between the gross profit of a company and the net profit; the net profit is the gross profit minus the costs incurred, while the GPI is the GDP (value of all goods and services produced) minus the environmental and social costs. Accordingly, the GPI will be zero if the financial costs of poverty and pollution equal the financial gains in production of goods and services, all other factors being constant.
Motivation
Most economists assess progress in people's welfare by comparing the gross domestic product over time—that is, by adding up the annual dollar value of all goods and services produced within a country over successive years. However, GDP was not intended to be used for such purpose. It is prone to productivism or consumerism, over-valuing production and consumption of goods, and not reflecting improvement in human well-being. It also does not distinguish between money spent for new production and money spent to repair negative outcomes from previous expenditure. For example, it would treat as equivalent one million dollars spent to build new homes and one million dollars spent in aid relief to those whose homes have been destroyed, despite these expenditures arguably not representing the same kind of progress. This is relevant for example when considering the true costs of development that destroys wetlands and hence exacerbate flood damages. Simon Kuznets, the inventor of the concept of GDP, noted in his first report to the US Congress in 1934:
the welfare of a nation can scarcely be inferred from a measure of national income. If the GDP is up, why is America down? Distinctions must be kept in mind between quantity and quality of growth, between costs and returns, and between the short and long run. Goals for more growth should specify more growth of what and for what.[3]
Some have argued that an adequate measure must also take into account ecological yield and the ability of nature to provide services, and that these things are part of a more inclusive ideal of progress, which transcends the traditional focus on raw industrial production.
Theoretical foundation
The need for a GPI to supplement indicators such as GDP was highlighted by analyses of uneconomic growth in the 1980s, notably that of Marilyn Waring, who studied biases in the UN System of National Accounts.
By the early 1990s, there was a consensus in human development theory and ecological economics that growth in money supply was actually reflective of a loss of well-being: that lacks of essential natural and social services were being paid for in cash and that this was expanding the economy but degrading life.
The matter remains controversial and is a main issue between advocates of green economics and neoclassical economics. Neoclassical economists understand the limitations of GDP for measuring human well-being but nevertheless regard GDP as an important, though imperfect, measure of economic output and would be wary of too close an identification of GDP growth with aggregate human welfare. However, GDP tends to be reported as synonymous with economic progress by journalists and politicians, and the GPI seeks to correct this shorthand by providing a more encompassing measure.
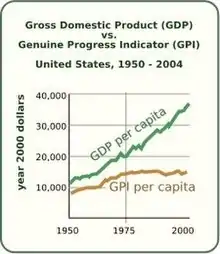
Some economists, notably Herman Daly, John B. Cobb[4] and Philip Lawn,[5] have asserted that a country's growth, increased goods production, and expanding services have both "costs" and "benefits"—not just the "benefits" that contribute to GDP. They assert that, in some situations, expanded production facilities damage the health, culture, and welfare of people. Growth that was in excess of sustainable norms (e.g., of ecological yield) had to be considered to be uneconomic. According to the "threshold hypothesis", developed by Manfred Max-Neef, "when macroeconomic systems expand beyond a certain size, the additional benefits of growth are exceeded by the attendant costs" (Max-Neef 1995). This hypothesis is borne out in data comparing GDP/capita with GPI/capita from 17 countries. The graph demonstrates that, while GDP does increase overall well-being to a point, beyond $7,000 GDP/capita the increase in GPI is reduced or remains stagnant.[6] Similar trends can be seen when comparing GDP to life satisfaction as well as in a Gallup Poll published in 2008.[7]
According to Lawn's model, the "costs" of economic activity include the following potential harmful effects:[8]
- Cost of resource depletion
- Cost of crime
- Cost of ozone depletion
- Cost of family breakdown
- Cost of air, water, and noise pollution
- Loss of farmland
- Loss of wetlands
Analysis by Robert Costanza also around 1995 of nature's services and their value showed that a great deal of degradation of nature's ability to clear waste, prevent erosion, pollinate crops, etc., was being done in the name of monetary profit opportunity: this was adding to GDP but causing a great deal of long term risk in the form of mudslides, reduced yields, lost species, water pollution, etc. Such effects have been very marked in areas that suffered serious deforestation, notably Haiti, Indonesia, and some coastal mangrove regions of India and South America. Some of the worst land abuses for instance have been shrimp farming operations that destroyed mangroves, evicted families, left coastal lands salted and useless for agriculture, but generated a significant cash profit for those who were able to control the export market in shrimp. This has become a signal example to those who contest the idea that GDP growth is necessarily desirable.
GPI systems generally try to take account of these problems by incorporating sustainability: whether a country's economic activity over a year has left the country with a better or worse future possibility of repeating at least the same level of economic activity in the long run. For example, agricultural activity that uses replenishing water resources, such as river runoff, would score a higher GPI than the same level of agricultural activity that drastically lowers the water table by pumping irrigation water from wells.
"Income" vs. "capital depletion"
Hicks (1946) pointed out that the practical purpose of calculating income is to indicate the maximum amount that people can produce and consume without undermining their capacity to produce and consume the same amount in the future. From a national income perspective, it is necessary to answer the following question: "Can a nation's entire GDP be consumed without undermining its ability to produce and consume the same GDP in the future?" This question is largely ignored in contemporary economics but fits under the idea of sustainability.
In legislative decisions
The best-known attempts to apply the concepts of GPI to legislative decisions are probably the Atlantic indicator[9] invented by Ronald Colman for Atlantic Canada, the Alberta GPI[10] created by ecological economist Mark Anielski[11] to measure the long-term economic, social and environmental sustainability of the province of Alberta and the "environmental and sustainable development indicators" used by the Government of Canada to measure its own progress to achieving well-being goals: its Environment and Sustainable Development Indicators Initiative (Canada)[12] is an effort to justify state services in GPI terms. It assigns the Commissioner for the Environment and Sustainable Development (Canada),[13] an officer in the Auditor-General of Canada's office, to perform the analysis and report to the House of Commons. However, Canada continues to state its overall budgetary targets in terms of reducing its debt to GDP ratio, which implies that GDP increase and debt reduction in some combination are its main priorities.
In the European Union (EU) the Metropole efforts and the London Health Observatory methods are equivalents focused mostly on urban lifestyle.
The EU and Canadian efforts are among the most advanced in any of the G8 or OECD nations, but there are parallel efforts to measure quality of life or standard of living in health (not strictly wealth) terms in all developed nations. This has also been a recent focus of the labour movement.
Calculation
The calculation of GPI presented in the simplified form is the following:
GPI = A + B - C - D + I
A is income weighted private consumption
B is value of non-market services generating welfare
C is private defensive cost of natural deterioration
D is cost of deterioration of nature and natural resources
I is increase in capital stock and balance of international trade
The GPI indicator is based on the concept of sustainable income, presented by economist John Hicks (1948). The sustainable income is the amount a person or an economy can consume during one period without decreasing his or her consumption during the next period. In the same manner, GPI depicts the state of welfare in the society by taking into account the ability to maintain welfare on at least the same level in the future.
Components
The Genuine Progress Indicator is measured by 26 indicators which can be divided into three main categories: Economic, Environmental, and Social. Some regions, nations, or states may adjust the verbiage slightly to accommodate their particular scenario. For example, the GPI template uses the phrase "Carbon Dioxide Emissions Damage" whereas the state of Maryland uses "Cost of Climate Change"[14] because it also accounts for other greenhouse gases (GHG) such as methane and nitrous oxide.
| +/- | Indicator[15] | Brief Explanation |
|---|---|---|
| Economic | ||
| + | Personal Consumption Expenditures | The bulk of GDP as well, consumption informs the baseline from which the rest of the indicators will be added or subtracted. |
| ÷ | Income Inequality | Using the Gini index, published by World Bank, and the Income Distribution Index (IDI), its relative change over time. |
| (PCE/IDI)*100 | Adjusted Personal Consumption | Formula=(Personal consumption/IDI) x 100. Forms the base number from which the remaining indicators are added or subtracted. |
| - | Cost of Consumer Durables | Calculated as a cost to avoid double counting the value provided by the durables themselves. |
| + | Value of Consumer Durables | Household appliances, cars, etc. are not used up in one year and are considered a part of household capital. Their value is depreciated over a number of years. |
| - | Cost of Underemployment | Encompasses the chronically unemployed, discouraged workers, involuntary part-time workers and others with work-life restraints (lack of childcare or transportation). |
| +/- | Net Capital Investment | Capital investment in foreign markets minus incoming investments from other countries. If lending (+) if borrowing (-). |
| Environmental | ||
| - | Cost of Water Pollution | Damage to water quality from things such as chemicals or nutrients, and the costs of erosion/sedimentation in waterways. |
| - | Cost of Air Pollution | Includes damage to vegetation, degradation of materials, cost of clean-up from soot or acid rain, and resulting reduced property values, wage differentials and aesthetics. |
| - | Cost of Noise Pollution | Noise from traffic and factories can cause hearing loss and sleep deprivation. |
| - | Loss of Wetlands | Valuates the services given up when wetlands are lost to development i.e. buffering of weather, habitat, water purification. |
| - | Loss of farmland, soil quality or degradation | Due to urbanization, soil erosion and compaction. This indicator is measured cumulatively to account for all years of production lost as it compromises self-sufficient food supply. |
| - | Loss of Primary Forest and damage from logging roads | Loss of biodiversity, soil quality, water purification, carbon sequestration, recreation etc. Cumulative affect year over year. |
| - | CO2 Emissions | Increases in severe weather is causing billions in damages. A value of US$93/metric ton of CO2 emitted is used, based on a meta-analysis study by Richard Tol (2005) of 103 separate studies of costs of economic damages. |
| - | Cost of Ozone Depletion | Our protective layer in the atmosphere. Depletion can lead to increased cases of cancer, cataracts and plant decline. Weighed at US$49,669/ton |
| - | Depletion of Non-Renewables | These cannot be renewed in a lifetime. Depletion is measured against cost of implementing and substituting with renewable resources. |
| Social | ||
| + | Value of Housework and Parenting | Child care, repairs and maintenance are valued equivalent to the amount a household would have to pay for the service. |
| - | Cost of Family Changes | Social dysfunction presents itself early in family life. Care is taken to avoid double counting goods and services duplicated due to split-parent households. |
| - | Cost of Crime | Medical expenses, property damages, psychological care and security measures to prevent crime are all included in this indicator. |
| - | Cost of Household Pollution Abatement | Cost to residents to clean the air and water in their own household i.e. air and water filters. |
| + | Value of Volunteer Work | Valued as a contribution to social welfare. Neighborhoods and communities can find an informal safety net through their peers and volunteer work. |
| - | Loss of Leisure Time | Compared to 1969 hours of leisure. Recognizes that increased output of goods and services can lead to loss of valuable leisure time for family, chores or otherwise. |
| + | Value of Higher Education | Accounts for the contribution resulting knowledge, productivity, civic engagement, savings, and health; a "social spillover," set to $16,000 per year. |
| + | Value of Highways and Streets | Annual value of services contributed from the use of streets & highways. Valued at 7.5% of net stock of local, state and federal highways. |
| - | Cost of Commuting | Money spent to pay for the transportation and time lost in transit as opposed to other more enjoyable activities. |
| - | Cost of Auto Accidents | Damage and loss as a result of traffic accidents. Increased traffic densities are a direct result of industrialization and wealth accumulation. |
Development in the United States
Non-profit organizations and universities have measured the GPI of Vermont, Maryland, Colorado, Ohio, and Utah. These efforts have incited government action in some states. As of 2014, Vermont, Maryland, Washington and Hawai'i have passed state government initiatives to consider GPI[16] in budgeting decisions, with a focus on long-term cost and benefits.
In 2009, the state of Maryland formed a coalition of representatives from several state government departments in search of a metric that would factor social well-being into the more traditional gross product indicators of the economy. The metric would help determine the sustainability of growth and economic progress against social and environmental factors typically left out of national indicators. The GPI was chosen as a comprehensive measure of sustainability as it has a well-accepted scientific methodology that can be adopted by other states and compared over time.[17] Maryland's GPI trends are comparable to other states and nations that have measured their GPI in that Gross State Product (GSP) and GPI have diverged over the past four decades where GSP has increased more rapidly than GPI. While economic elements of GPI have increased overall (with a significant drop off during the Great Recession), social well-being has stagnated, with any values added being cancelled out by costs deducted, and environmental indicators, while improving slightly, are always considered costs. Combined, these elements bring the GPI below GSP.[18] However, Maryland's GPI did increase by two points from 2010 to 2011.[19]
The calculation methodology of GPI was first adapted to US data in the late-1990s.[20] Results show that GDP has increased substantially. At the same time, the GPI has stagnated. Thus, according to GPI theory, economic growth in the US, i.e., the growth of GDP, has not increased the welfare of the people during last 30 years. So far, GPI time-series have been calculated for the US and Australia as well as for several of their states. In addition, GPI has been calculated for Austria, Canada, Chile, France, Finland, Italy, the Netherlands, Scotland, and the rest of the UK.
Development in Finland
The GPI time-series 1945 to 2011 for Finland have been calculated by Statistics Finland. The calculation closely followed the US methodology. The results show that in the 1970s and 1980s economic growth, as measured by GDP, clearly increased welfare, measured by the GPI. After the economic recession of the early-1990s the GDP continued to grow, but the GPI stayed on a lower level. This indicates a widening gap between the trends of GDP and GPI that began in the early-1990s. In the 1990s and 2000s the growth of GDP has not benefited the average Finn. If measured by GPI, sustainable economic welfare has actually decreased due to environmental hazards that have accumulated in the environment. The Finnish GPI time series[21] have been updated by Dr Jukka Hoffrén at Statistics Finland.
Development in regions of Finland
Within EU's Interreg IV C FRESH Project (Forwarding Regional Environmental Sustainable Hierarchies) GPI time-series were calculated to Päijät-Häme, Kainuu and South-Ostrobotnia (Etelä-Pohjanmaa) regions in 2009–2010.[22] During 2011 these calculations were completed with GPI calculations for the Lappland, Northern Ostrobothnia (Pohjois-Pohjanmaa) and Central-Ostrobothnia (Keski-Pohjanmaa) regions.
Criticism
GPI considers some types of production to have a negative impact upon being able to continue some types of production. GDP measures the entirety of production at a given time. GDP is relatively straightforward to measure compared to GPI. Competing measures like GPI define well-being, which are arguably impossible to define. Therefore, opponents of GPI claim that GPI cannot function to measure the goals of a diverse, plural society. Supporters of GDP as a measure of societal well-being claim that competing measures such as GPI are more vulnerable to political manipulation.[23]
Finnish economists Mika Maliranta and Niku Määttänen write that the problem of alternative development indexes is their attempt to combine things that are incommensurable. It is hard to say what they exactly indicate and difficult to make decisions based on them. They can be compared to an indicator that shows the mean of a car's velocity and the amount of fuel left.
They add that it indeed seems as if the economy has to grow in order for the people to even remain as happy as they are at present. In Japan, for example, the degree of happiness expressed by the citizens in polls has been declining since the early 1990s, the period when Japan's economic growth stagnated.[24]
Supporting countries and groups
- Canada planning applications.[25] GDP has functioned as an "income sheet". GPI will function as a "balance sheet," taking into consideration that some income sources are very costly and contribute a negative profit overall.
- Beyond GDP[26] is an initiative of the European Union, Club of Rome, WWF and OECD.
- Redefining Progress.[27] Reports and analyses. A non-profit organization with headquarters in Oakland, California.[28]
- Gross National Happiness USA[29] has commissioned studies and advocated adoption of GPI in the United States.
GPI and GPI-type studies completed
| Indicator name | Region | Beginning year in study | End year in study | Year of publication | Authors |
|---|---|---|---|---|---|
| MEW -(A/S) | United States of America | 1929 | 1965 | 1972 | Nordhaus and Tobin |
| ISEW | United States of America | 1951 | 1986 | 1989 | Daly and Cobb |
| ISEW | Germany | 1950 | 1990 | 1994 | Diefenbacher |
| ISEW | Scotland | 1980 | 1991 | 1994 | Moffatt and Wilson |
| ISEW | Netherlands | 1950 | 1992 | 1995 | Oegema and Rosenberg |
| ISEW | Netherlands | 1950 | 1992 | 1995 | Rosenberg, Oegema, Bovy |
| ISEW | Sweden | 1950 | 1992 | 1996 | Jackson and Stymne |
| ISEW | Austria | 1955 | 1992 | 1997 | Stockhammer et al. |
| ISEW | UK | 1950 | 1996 | 1997 | Jackson, et al. |
| ISEW | Austria | 1955 | 1992 | 1997 | Stockhammer, Hochreiter, Obermayr, Steiner |
| ISEW | Italy | 1960 | 1991 | 1998 | Giogio Guenno, Silvia Tiezzi |
| ISEW | Chile | 1965 | 1995 | 1999 | Castañeda |
| GPI | United States of America | 1950 | 1998 | 1999 | Cobb, Goodman, Wackernagel |
| GPI | Australia | 1950 | 1996 | 1999 | Clive Hamilton |
| SNBI | Australia | 1966 | 1967 | 1999 | Lawn and Sanders |
| SNBI | Australia | 1994 | 1995 | 1999 | Lawn and Sanders |
| ISEW | Scotland | 1980 | 1993 | 1999 | Hanley |
| GPI | Australia | 1950 | 2000 | 2000 | Hamilton and Dennis |
| GPI | Minnesota | 1960 | 1995 | 2000 | Minnesota Planning Agency |
| GPI | Alberta, Canada | 1961 | 1999 | 2001 | Mark Anielski |
| ISEW | Czech Republic | 1988 | 1998 | 2002 | Scasny |
| ISEW | Poland | 1980 | 1997 | 2003 | Gil and Sleszynski |
| ISEW | Wales | 1990 | 2000 | 2003 | Matthews, Williams, Roberts, Munday |
| GPI | United States of America | 1950 | 2002 | 2004 | Venetoulis and Cobb |
| GPI | San Francisco Bay Area | 2000 | 2000 | 2004 | Venetoulis and Cobb |
| GPI | Vermont, Chittenton County, and Burlington | 1950 | 2000 | 2004 | Costanza, Erickson et al. |
| ISEW | Thailand | 1975 | 1999 | 2005 | Matthew Clarke, Sardar M.N. Islam |
| GPI | Colombia | 1976 | 2003 | 2006 | Sánchez et al. |
| GPI | United States of America | 1950 | 2004 | 2006 | John Talberth, Clifford Cobb, and Noah Slattery |
| ISEW | Siena, Italy | 1999 | 1999 | 2006 | Pulselli, Ciampalini, Tiezzi, Zappia |
| ISEW | Belgium | 1970 | 2000 | 2006 | Brent Bleys |
| GPI | Victoria, Australia | 1986 | 2003 | 2006 | Clarke and Lawn |
| ISEW | Mexico | 1993 | 2005 | 2007 | Castillo López A. |
| ISEW | Netherlands | 1971 | 2004 | 2007 | Brent Bleys |
| IBES/ISEW | Puerto Rico | 1970 | 2006 | 2007 | Alameda-Lozada and Diaz-Rodriguez |
| GPI | China (4 regions) | 1991 | 2001 | 2007 | Zongguo Wen, Kunmin Zhanf, Bin Du, Yadong Li, Wei Li |
| GPI | Northern Vermont (7 counties) | 1950 | 2000 | 2007 | Bagstad and Ceroni |
| ISEW | Belgium | 1970 | 2004 | 2008 | Brent Bleys |
| R-ISEW | England (regions) | 1994 | 2005 | 2008 | Tim Jackson, Nat McBride, Saamah Abdallah and Nic Marks |
| ISEW | France | 1990 | 2002 | 2008 | Nourry |
| ISEW | Modena and Rimini, Italy | ? | ? | 2008 | Pulselli, F.M., Tiezzi, E., Marchettini, N., Bastiononi, S. |
| GPI | India | 1987 | 2003 | 2008 | Ed: Philip Lawn and Matthew Clarke (Book) |
| GPI | Australia | 1967 | 2006 | 2008 | Ed: Philip Lawn and Matthew Clarke (Book) |
| GPI | New Zealand | 1970 | 2005 | 2008 | Ed: Philip Lawn and Matthew Clarke (Book) |
| GPI | Japan | 1970 | 2003 | 2008 | Ed: Philip Lawn and Matthew Clarke (Book) |
| GPI | China | 1970 | 2005 | 2008 | Ed: Philip Lawn and Matthew Clarke (Book) |
| GPI | Thailand | 1975 | 2004 | 2008 | Ed: Philip Lawn and Matthew Clarke (Book) |
| GPI | Vietnam | 1992 | 2004 | 2008 | Ed: Philip Lawn and Matthew Clarke (Book) |
| Edmonton Wellbeing Index | Edmonton, Canada | 1981 | 2008 | 2009 | Anielski and Johannessen |
| ISEW | Tuscany, Italy | 1971 | 2006 | 2009 | Pulselli, F., Bravi, M., Tiezzi, E. |
| ISEW | Ecuador | 2001 | 2010 | 2011 | ANDRÉS PAÚL CORDERO SANMARTÍN |
| GPI | Utah | 1990 | 2007 | 2011 | Berik, G. and E. Gaddis |
| GPI | Baltimore City, County, and the State of Maryland | 1950 | 2005 | 2011 | Posner, S. and R. Costanza |
| GPI | Vermont | 1960 | 2010 | 2011 | Zencey, Eric, Sebastian Castro, Marigo Farr, Mark Isselhardt, Brian Kelly, Katharine Lucas, Julie Nash, Matt Pescatore, Meagan Pharis, Vinson Pierce, Tarah Rose, Daniel Sanchez, Aaron Witham, Zach Zimmerman. |
| GPI | Maryland | 1950 | 2004 | 2012 | MacGuire, S., S. Posner, H. Haake |
| ISEW | Netherlands | 1970 | 2010 | 2012 | Bob van Moerkerk |
| GPI | Northern Ohio | 1990 | 2005 | 2012 | Kenneth Bagstad and Md Rumi Shammin |
| ISEW | Flanders, Belgium | 1990 | 2009 | 2013 | Brent Bleys |
| GPI | Vermont | 1960 | 2011 | 2013 | Jon D. Erickson, Eric Zencey, Matthew J. Burke, Sam Carlson, and Zachary Zimmerman |
| GPI | Austria | 1955 | 1992 | 2013 | Kubiszewski, Costanza, Franco, Lawn, Talberth, Jackson, Aylmer |
| GPI | Belgium | 1970 | 2005 | 2013 | Kubiszewski, Costanza, Franco, Lawn, Talberth, Jackson, Aylmer |
| GPI | Netherlands | 1950 | 1992 | 2013 | Kubiszewski, Costanza, Franco, Lawn, Talberth, Jackson, Aylmer |
| GPI | Poland | 1980 | 1998 | 2013 | Kubiszewski, Costanza, Franco, Lawn, Talberth, Jackson, Aylmer |
| GPI | Italy | 1960 | 1990 | 2013 | Kubiszewski, Costanza, Franco, Lawn, Talberth, Jackson, Aylmer |
| GPI | Sweden | 1950 | 1992 | 2013 | Kubiszewski, Costanza, Franco, Lawn, Talberth, Jackson, Aylmer |
| GPI | United Kingdom | 1950 | 2001 | 2013 | Kubiszewski, Costanza, Franco, Lawn, Talberth, Jackson, Aylmer |
| GPI | United States | 1950 | 2005 | 2013 | Kubiszewski, Costanza, Franco, Lawn, Talberth, Jackson, Aylmer |
| GPI | Chile | 1950 | 1992 | 2013 | Kubiszewski, Costanza, Franco, Lawn, Talberth, Jackson, Aylmer |
| GPI | Australia | 1965 | 2006 | 2013 | Kubiszewski, Costanza, Franco, Lawn, Talberth, Jackson, Aylmer |
| GPI | New Zealand | 1970 | 2005 | 2013 | Kubiszewski, Costanza, Franco, Lawn, Talberth, Jackson, Aylmer |
| GPI | China | 1970 | 2006 | 2013 | Kubiszewski, Costanza, Franco, Lawn, Talberth, Jackson, Aylmer |
| GPI | India | 1985 | 2003 | 2013 | Kubiszewski, Costanza, Franco, Lawn, Talberth, Jackson, Aylmer |
| GPI | Japan | 1970 | 2003 | 2013 | Kubiszewski, Costanza, Franco, Lawn, Talberth, Jackson, Aylmer |
| GPI | Thailand | 1975 | 2005 | 2013 | Kubiszewski, Costanza, Franco, Lawn, Talberth, Jackson, Aylmer |
| GPI | Vietnam | 1990 | 2005 | 2013 | Kubiszewski, Costanza, Franco, Lawn, Talberth, Jackson, Aylmer |
| GPI | Global | 1950 | 2005 | 2013 | Kubiszewski, Costanza, Franco, Lawn, Talberth, Jackson, Aylmer |
| ISEW | Tuscany and Marche, Italy | 1999 | 2009 | 2013 | Chelli, Ciommi, Gigliarano |
| GPI | Maryland | 1960 | 2013 | 2014 | Hans Haake |
| GPI | Hawaii | 2000 | 2009 | 2014 | Regina Ostergaard-Klem, Kirsten Oleson |
| GPI | Colorado | 1960 | 2011 | 2014 | Chris Stiffler |
| ISEW | Flanders, Belgium | 1990 | 2012 | 2014 | Brent Bleys |
| GPI | Washington | 1960 | 2015 | 2014 | Siefer Amber en Rossman Jamie |
| GPI | Brazil | 1970 | 2010 | 2015 | Daniel Caixeta Andrade, Junior Ruiz Garcia |
| GPI | Hong Kong | 1968 | 2010 | 2015 | Claudio O Delang (Book) |
| GPI | Singapore | 1968 | 2010 | 2015 | Claudio O Delang (Book) |
| GPI | Massachusetts | 1960 | 2012 | 2015 | Jon D. Erickson, Eric Zencey, and Zachary Zimmerman |
| GPI | Oregon | 1960 | 2010 | 2015 | Ida Kubiszewski, Robert Costanza, Nicole E. Gorko, Michael A. Weisdorf, Austin W. Carnes, Cathrine E. Collins, Carol Franco, Lillian R. Gehres, Jenna M. Knobloch, Gayle E. Matson, Joan D. Schoepfer |
| ISEW | Greece | 2000 | 2012 | 2015 | Angeliki Menegaki and Konstantinos Tsagarakis |
| ISEW | Flanders, Belgium | 1990 | 2014 | 2016 | Brent Bleys |
| GPI | Missouri | 2000 | 2014 | 2016 | Zencey, Eric |
| ISEW | Flanders, Belgium | 1990 | 2015 | 2017 | Brent Bleys |
| GPI | US, 50 States | 2010 | 2011 | 2017 | Mairi-Jane Fox |
| GPI | Liaoning, China | 1978 | 2011 | 2017 | Yu Hou |
| ISEW | Spain | 1995 | 2014 | 2017 | Ignacio Rodriguez Rodriguez |
| GPI | California | 2010 | 2014 | 2018 | Brown and Lazarus |
| ISEW | Turkey | 2001 | 2012 | 2018 | Angeliki Menegaki |
| N/RWI | Germany, Bavaria, Hamburg, North Rhine/Westphalia, Rhineland-Palantinate, Saxonia, Thuringia | 1991 | 2014 | 2018 | Held, Rodenhäuser, Diefenbacher, Zieschank |
| ISEW | Spain | 1970 | 2012 | 2018 | Tadhg O'Mahony, Paula Escardó-Serra, Javier Dufour |
| SWI | Italy | 1960 | 2014 | 2018 | Mirko Armiento |
| ISEW | Luxembourg | 1960 | 2010 | 2018 | Benedetto Rugani, Antonino Marvuglia, Federico Maria Pulselli |
| GPI | Vermont | 2000 | 2015 | 2018 | Eric Zencey |
| GPI | Ohio | 2009 | 2016 | 2018 | Rob Moore |
| GPI & ISEW | Finland | 1945 | 2017 | 2018 | Hoffren |
| GPI & ISEW | 19 regions, Finland | 1960 | 2017 | 2018 | Hoffren |
| GPI | 10 Chinese megacities (Beijing, Tianjin, Nanjing, Shanghai, Guangzhou, Chongqing, Chengdu, Xi'an, Wuhan, Shenyang), China | 199x | 201x | 2018 | Lu Huang |
| ISEW | Flanders, Belgium | 1990 | 2016 | 2018 | Brent Bleys, Jonas Van der Slycken |
| GPI | Iceland | 2000 | 2016 | 2018 | Anna Balafina |
| GPI | Australia | 1962 | 2013 | 2019 | Kenny et al. |
| GPI | 31 provinces, China | 1997 | 2016 | 2019 | Xianling Long, Xi Ji |
| GPI | China | 1997 | 2016 | 2019 | Xianling Long, Xi Ji |
| GPI | 28 OECD countries | 1995(*) | 2015(*) | 2019 | Pais, Alfonso, Marques, Fuinhas |
| GPI | South Korea & Malaysia | 1980 | 2014 | 2019 | Mastura Hashim, Azhar Mohamad, Imtiaz Mohammad Sifat |
| GPI | South Australia | 1986 | 2016 | 2019 | Philip Lawn |
| ISEW | Romania | 1990 | 2017 | 2019 | Butnariu & Luca |
| ISEW | Flanders | 1990 | 2017 | 2019 | Brent Bleys, Jonas Van der Slycken |
| GPI | New Zealand | 1970 | 2016 | 2019 | Patterson et al. |
| GPI | 21 cities in the Rust Belt, United States | 1990 | 2015 | 2019 | LaToya S. Moten |
| ISEW | Ecuador | 2001 | 2015 | 2020 | Sanchez et al. |
| GPI | Ohio | 2009 | 2018 | 2020 | Rob Moore |
| GPI | North Carolina | 2005 | 2018 | 2020 | Juhi Modi |
| ISEW/GPI | Belgium | 1995 | 2018 | 2020 | Jonas Van der Slycken and Brent Bleys |
| NWI | Germany | 1991 | 2018 | 2020 | Held, Rodenhäuser, Diefenbacher |
| ISEW | Flanders | 1990 | 2018 | 2020 | Brent Bleys, Jonas Van der Slycken |
See also
- Broad measures of economic progress
- Disability-adjusted life year
- Economics
- Full cost accounting
- Green national product
- Green gross domestic product (Green GDP)
- Gender-related Development Index
- Global Peace Index
- Gross National Happiness
- Gross National Well-being (GNW)
- Happiness economics
- Happy Planet Index (HPI)
- Human Development Index (HDI)
- ISEW (Index of sustainable economic welfare)
- Progress (history)
- Progressive utilization theory
- Legatum Prosperity Index
- Leisure satisfaction
- Living planet index
- Millennium Development Goals (MDGs)
- Money-rich, time-poor
- Post-materialism
- Psychometrics
- Subjective life satisfaction
- Where-to-be-born Index
- Wikiprogress
- World Values Survey (WVS)
References
- Kubiszewski, Ida; Costanza, Robert; Franco, Carol; Lawn, Philip; Talberth, John; Jackson, Tim; Aylmer, Camille (September 2013). "Beyond GDP: Measuring and achieving global genuine progress". Ecological Economics. 93: 57–68. doi:10.1016/j.ecolecon.2013.04.019. ISSN 0921-8009.
- Bensel, Terrence; Turk, Jon (2011). Contemporary Environmental Issues. Bridgepoint Education. ISBN 9781935966159. 1935966154.
- "Beyond GDP International Conference" (PDF). OECD. Organisation for Economic Cooperation and Development. Retrieved 13 December 2014.
- "For the Common Good by Herman Daly & John Cobb Jr. – A Book Review by Scott London". scottlondon.com.
- "Initiative Details". iisd.org.
- Kubiszewski, Ida; Costanza, Robert; Franco, Carol; Lawn, Philip; Talberth, John; Jackson, Tim; Aymler, Camille (30 April 2013). "Beyond GDP: Measuring and achieving global genuine progress". Ecological Economics. 93: 57–68. doi:10.1016/j.ecolecon.2013.04.019.
- Deaton, Angus. "Ph.D." Gallup. Gallup. Retrieved 10 December 2014.
- Lawn, Philip A. (2003). "A theoretical foundation to support the Index of Sustainable Economic Welfare (ISEW), Genuine Progress Indicator (GPI), and other related indexes". Ecological Economics. 44 (1): 105–118. doi:10.1016/S0921-8009(02)00258-6.
- "GPI Atlantic". gpiatlantic.org.
- Alberta GPI
- Mark Anielski Archived 2011-07-07 at the Wayback Machine
- Environment and Sustainable Development Indicators Initiative (Canada) Archived 2008-12-10 at the Wayback Machine
- Commissioner for the Environment and Sustainable Development (Canada)
- "Maryland GPI Indicators". Maryland Genuine Progress Indicator. MD DNR. Archived from the original on 2014-11-29. Retrieved 2014-10-21.
- "Genuine Progress Indicator". Genuine Progress: Beyond GDP. Genuine Progress. Archived from the original on 2014-10-21. Retrieved 2014-10-22.
- (http://www.gpiinthestates.org/states-using-gpi)
- "MD-GPI Background & Methodology". Maryland Genuine Progress Indicator. MDDNR. Archived from the original on 28 November 2014. Retrieved 16 November 2014.
- "Maryland Genuine Progress Indicator Overview". Maryland Genuine Progress Indicator. MD DNR. Archived from the original on 28 November 2014. Retrieved 16 November 2014.
- "Governor O'Malley Hosts GPI Summit". maryland.gov.
- "Energy and material flows". Docstoc.com.
- "Archived copy" (PDF). Archived from the original (PDF) on 2013-11-05. Retrieved 2012-05-10.CS1 maint: archived copy as title (link)
- Goossens, Yanne. "Alternative progress indicators to Gross Domestic Product (GDP) as a means towards sustainable development" (PDF). European Parliament. Committee on the Environment, Public Health and Food Safety (EVNI). Retrieved 27 September 2015.
- "Politiikanteon ohjaamiseen ei tarvita 'onnellisuusmittareita'", professor Mika Maliranta and research manager Niku Määttänen, Helsingin Sanomat 2011-02-06, page C6
- Canada planning applications Archived 2004-09-13 at the Wayback Machine
- Beyond GDP
- Redefining Progress Archived 2004-09-10 at the Wayback Machine
- "Redefining Progress – Research and Publications". rprogress.org. Archived from the original on 2017-12-19.
Further reading
News articles
- "Advantage or Illusion: Is Alberta's Progress Sustainable?" by Mark Anielski. Encompass Vol. 5, No. 5, July/August 2001.
- "The Growth Consensus Unravels" by Jonathan Rowe. Dollars and Sense, July–August 1999, pp. 15–18, 33.
- "Real Wealth: The Genuine Progress Indicator Could Provide an Environmental Measure of the Planet's Health" by Linda Baker. E Magazine, May/June 1999, pp. 37–41.
- "The GDP Myth: Why 'Growth' Isn't Always a Good Thing" by Jonathan Rowe, and Judith Silverstein. Washington Monthly, March 1999, pp. 17–21.
- "Economic Issues" by Lusi Song, Troy Martin, and Timothy Polo. 4EM Taylor, May 28, 2008, pp. 1–3.
- "Why Bigger Isn´t Better: The Genuine Progress Indicator – 1999 Update" by Clifford Cobb, Gary Sue Goodman, and Mathis Wackernagel, Redefining Progress, November 1999
Scientific articles and books
- A. Charles, C. Burbidge, H. Boyd and A. Lavers. 2009. Fisheries and the Marine Environment in Nova Scotia: Searching for Sustainability and Resilience. GPI Atlantic. Halifax, Nova Scotia. Web: http://www.gpiatlantic.org/pdf/fisheries/fisheries_2008.pdf
- Colman, Ronald. 2003. Economic Value of Civic and Voluntary Work. GPI Atlantic. Halifax, Nova Scotia. Web: http://www.gpiatlantic.org/publications/summaries/volsumm.pdf
- Anielski, M, M. Griffiths, D. Pollock, A. Taylor, J. Wilson, S. Wilson. 2001. Alberta Sustainability Trends 2000: Genuine Progress Indicators Report 1961 to 1999. Pembina Institute for Appropriate Development. April 2001. https://web.archive.org/web/20070510154250/http://www.anielski.com/Publications.htm (see the Alberta Genuine Progress Indicators Reports)
- Anielski, M. 2001. The Alberta GPI Blueprint: The Genuine Progress Indicator (GPI) Sustainable Well-Being Accounting System. Pembina Institute for Appropriate Development. September 2001.http://www.anielski.com/Publications.htm (see the Alberta Genuine Progress Indicators Reports)
- Anielski, M. and C. Soskolne. 2001. "Genuine Progress Indicator (GPI) Accounting: Relating Ecological Integrity to Human Health and Well-Being." Paper in Just Ecological Integrity: The Ethics of Maintaining Planetary Life, eds. Peter Miller and Laura Westra. Lanham, Maryland: Rowman and Littlefield: pp. 83–97.
- Bleys, B., & Van der Slycken, J. (2019). De Index voor Duurzame Economische Welvaart (ISEW) voor Vlaanderen, 1990–2017. Studie uitgevoerd in opdracht van de Vlaamse Milieumaatschappij, MIRA, MIRA/2019/04, Universiteit Gent. Web: https://biblio.ugent.be/publication/8641018/file/8641020
- Costanza, R., Erickson, J.D., Fligger, K., Adams, A., Adams, C., Altschuler, B., Balter, S., Fisher, B., Hike, J., Kelly, J., Kerr, T., McCauley, M., Montone, K., Rauch, M., Schmiedeskamp, K., Saxton, D., Sparacino, L., Tusinski, W. and L. Williams. 2004. "Estimates of the Genuine Progress Indicator (GPI) for Vermont, Chittenden County, and Burlington, from 1950 to 2000." Ecological Economics 51: 139–155.
- Daly, H., 1996. Beyond Growth: The Economics of Sustainable Development. Beacon Press, Boston.
- Daly, H. & Cobb, J., 1989. For the Common Good. Beacon Press, Boston.
- Delang, C. O., Yu, Yi H. 2015. "Measuring Welfare beyond Economics: The genuine progress of Hong Kong and Singapore". London: Routledge.
- Fisher, I., 1906. Nature of Capital and Income. A.M. Kelly, New York.
- Hicks, J., 1946. Value and Capital, Second Edition. Clarendon, London.
- Lawn, P.A. (2003). "A theoretical foundation to support the Index of Sustainable Economic Welfare (ISEW), Genuine Progress Indicator (GPI), and other related indexes". Ecological Economics. 44: 105–118. doi:10.1016/S0921-8009(02)00258-6.
- Max-Neef, M. (1995). "Economic growth and quality of life". Ecological Economics. 15: 115–118. doi:10.1016/0921-8009(95)00064-X.
- Redefining Progress, 1995. "Gross production vs genuine progress". Excerpt from the Genuine Progress Indicator: Summary of Data and Methodology. Redefining Progress, San Francisco.
- L. Pannozzo, R. Colman, N. Ayer, T. Charles, C. Burbidge, D. Sawyer, S. Stiebert, A. Savelson, C. Dodds. (2009). The 2008 Nova Scotia GPI Accounts; Indicators of Genuine Progress. GPI Atlantic. Halifax, Nova Scotia. Web: http://www.gpiatlantic.org/pdf/integrated/gpi2008.pdf
- Van der Slycken, J.; Bleys, B. (2020). "A Conceptual Exploration and Critical Inquiry into the Theoretical Foundation(s) of Economic Welfare Measures" (PDF). Ecological Economics. 176: 106753. doi:10.1016/j.ecolecon.2020.106753.