Developed country
A developed country, industrialized country (or post-industrial country), more developed country (MDC), or more economically developed country (MEDC), is a sovereign state that has a developed economy and advanced technological infrastructure relative to other less industrialized nations. Most commonly, the criteria for evaluating the degree of economic development are gross domestic product (GDP), gross national product (GNP), the per capita income, level of industrialization, amount of widespread infrastructure and general standard of living.[3] Which criteria are to be used and which countries can be classified as being developed are subjects of debate.
Developed countries have generally more advanced post-industrial economies, meaning the service sector provides more wealth than the industrial sector. They are contrasted with developing countries, which are in the process of industrialisation or are pre-industrial and almost entirely agrarian, some of which might fall into the category of Least Developed Countries. As of 2015, advanced economies comprise 60.8% of global GDP based on nominal values and 42.9% of global GDP based on purchasing-power parity (PPP) according to the International Monetary Fund.[4]
Similar terms
Terms linked to the concept developed country include "advanced country", "industrialized country", "'more developed country" (MDC), "more economically developed country" (MEDC), "Global North country", "first world country", and "post-industrial country". The term industrialized country may be somewhat ambiguous, as industrialisation is an ongoing process that is hard to define. The first industrialized country was the United Kingdom, followed by Belgium. Later it spread further to Germany, United States, France and other Western European countries. According to some economists such as Jeffrey Sachs, however, the current divide between the developed and developing world is largely a phenomenon of the 20th century.[5]
Mathis Wackernagel calls the binary labeling of countries as "neither descriptive nor explanatory. It is merely a thoughtless and destructive endorsement of GDP fetish. In reality, there are not two types of countries, but over 200 different countries, all faced with the same laws of nature, yet each with unique features."[6]
Definition and criteria
_per_capita_in_2019.svg.png.webp)
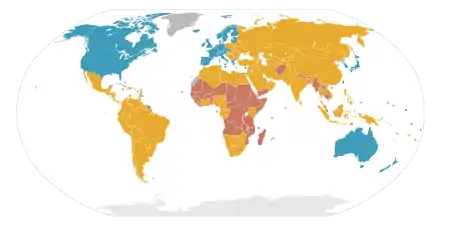
Economic criteria have tended to dominate discussions. One such criterion is income per capita; countries with high gross domestic product (GDP) per capita would thus be described as developed countries. Another economic criterion is industrialisation; countries in which the tertiary and quaternary sectors of industry dominate would thus be described as developed. More recently another measure, the Human Development Index (HDI), which combines an economic measure, national income, with other measures, indices for life expectancy and education has become prominent. This criterion would define developed countries as those with a very high (HDI) rating. The index, however, does not take into account several factors, such as the net wealth per capita or the relative quality of goods in a country. This situation tends to lower the ranking for some of the most advanced countries, such as the G7 members and others.[8][9]
According to the United Nations Statistics Division:
There is no established convention for the designation of "developed" and "developing" countries or areas in the United Nations system.[10]
And it notes that:
The designations "developed" and "developing" are intended for statistical convenience and do not necessarily express a judgement about the stage reached by a particular country or area in the development process.[11]
Human Development Index (HDI)
The UN HDI is a statistical measure that gauges a country's level of human development. While there is a strong correlation between having a high HDI score and being a prosperous economy, the UN points out that the HDI accounts for more than income or productivity. Unlike GDP per capita or per capita income, the HDI takes into account how income is turned "into education and health opportunities and therefore into higher levels of human development."
Since 1990, Norway (2001–2006, 2009–2018), Japan (1990–1991 and 1993), Canada (1992 and 1994–2000) and Iceland (2007–2008) have had the highest HDI score.
Many countries listed by IMF as "advanced", possess an HDI over 0.800, the threshold for "very high" human development. Many countries[Note 1] possessing an HDI of 0.800 and over are conversely listed by IMF as "advanced". Thus, many "advanced economies" are characterized by an HDI score of 0.800 or higher.[12]
The 2019 Human Development Report by the United Nations Development Programme was released on 9 December 2019, and calculates HDI values based on estimates for 2018. Below is the list of the "very high human development" countries:[13]
 = increase.
 = steady.
 = decrease.
- The number in parentheses represents the number of ranks the country has climbed (up or down) relative to the ranking in the year of 2017.
|
| ||||||||||||||||||||||||||||||||||||||||||||||||||||||||||||||||||||||||||||||||||||||||||||||||||||||||||||||||||||||||||||||||||||||||||||||||||||||||||||||||||||||||||||||||||||||||||||||||||||||||||||||||||||||||||||||||||||||||||||||||||||||||||||||||||||||||||||||||||||||||||||||||||||||||||||||||||||||||||||||||||||||||
As a non-UN member, the government of Taiwan calculates its own HDI, which had a value of 0.911 in 2018,[14] ranked 21 globally. Additionally, while the HDI for the Chinese special administrative region of Hong Kong is calculated by the UN, it is not for Macau. The Macanese government calculated the territory's HDI to be 0.868 in 2011. These values place both Taiwan and Macau well within the list of countries with "Very high human development".[15] Furthermore, in 2009 a United Nations project calculated the HDI for all of its members, as well as Taiwan, Macau, and many dependent territories. The HDI values for the countries of San Marino and Monaco, which have not been included in official annual HDI reports, were found to be at 0.961 and 0.956 respectively. This places both countries firmly within the category of countries with "Very high human development" as well. The dependent territories with HDI values equivalent to "Very high human development" were: Jersey, Cayman Islands, Bermuda, Guernsey, Gibraltar, Norfolk Island, Faroe Islands, Isle of Man, British Virgin Islands, Falkland Islands, Aruba, Puerto Rico, Martinique, Greenland, and Guam.[16] Of note, the HDI values in the 2009 report were calculated using the old HDI formula, while HDI values after the year 2010 are calculated with a different formula.
High-income economies
Some institutions have produced lists of developed countries: the UN (list shown above), the CIA,[17] and some providers of stock market indices (the FTSE Group, MSCI, S&P, Dow Jones, STOXX, etc.). The latter is not included here because its association of developed countries with countries with both high incomes and developed markets is not deemed as directly relevant.[Note 2]
However, many other institutions have created more general lists referred to when discussing developed countries. For example, the International Monetary Fund (IMF) identifies 39 "advanced economies".[12][18] The OECD's 37 members are known as the "developed countries club".[19][20][21] The World Bank identifies 81 "high income countries".[22] Other standards, such as the 30-50 Club (GDP per capita over $30,000 and population over 50 million) have been developed to categorize highly developed and influential countries.
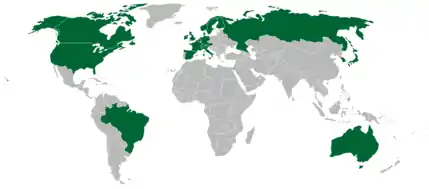
World Bank high-income economies
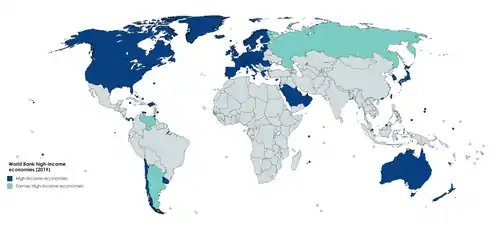
According to the World Bank the following 82 countries (including territories) are classified as "high-income economies". As of the 2021 fiscal year, high-income economies are those that had a GNI per capita of $12,536 or more in 2019.[22]
37 countries and territories in Europe:
 Andorra
 Austria
.svg.png.webp) Belgium
Belgium /
/  Channel Islands
 Croatia
 Czech Republic
 Denmark
 Estonia
 Faroe Islands
 Finland
 France
 Germany
 Gibraltar
 Greece
 Hungary
 Iceland
 Ireland
 Isle of Man
 Italy
Italy Liechtenstein
 Latvia
 Lithuania
 Luxembourg
 Malta
Malta Monaco
 Netherlands
 Norway
 Poland
 Portugal
 Romania
 San Marino
 Slovakia
 Slovenia
 Spain
Spain Sweden
 Switzerland
 United Kingdom
21 countries and territories in the Americas:
16 countries and territories in Asia:
7 countries and territories in Oceania:
2 countries in Africa:
7 former high-income economies:
 American Samoa (1987–89)
 Argentina (2013, 2015, 2017)
 Equatorial Guinea (2007–14)
.svg.png.webp) Netherlands Antilles (1994–2009)#
Netherlands Antilles (1994–2009)# Russia (2012–14)
 Venezuela (2014)
* Between 1994 and 2009, as a part of the ![]() Netherlands Antilles.
Netherlands Antilles.
# Dissolved on 10 October 2010, succeeded by Curaçao and Sint Maarten.
Development Assistance Committee members
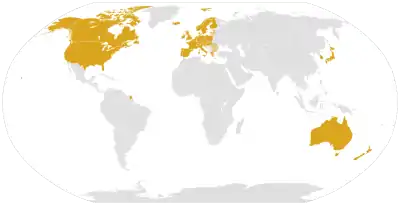
There are 29 OECD member countries and the European Union—in the Development Assistance Committee (DAC),[25] a group of the world's major donor countries that discuss issues surrounding development aid and poverty reduction in developing countries.[26] The following OECD member countries are DAC members:
23 countries in Europe:
2 countries in the Americas:
2 countries in Asia:
2 countries in Oceania:
IMF advanced economies
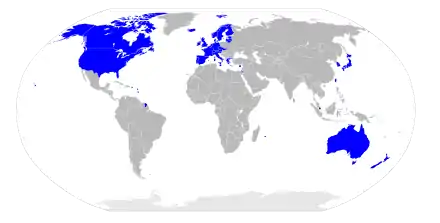
According to the International Monetary Fund, the following 39 (+8) economies are classified as "advanced economies":[12]
27 countries and 3 territories in Europe:
- Andorra d
- Austria
- Belgium
 Cyprus
- Czech Republic
- Denmark
- Estonia
- Faroe Islands d
- Finland
- France
- Germany
- Greece
- Guernsey d
 Holy See d
- Iceland
- Ireland
- Italy
- Jersey d
- Latvia
- Liechtenstein d
- Lithuania
- Luxembourg
- Malta
- Monaco d
- Netherlands
- Norway
- Portugal
- San Marino
- Slovakia
- Slovenia
- Spain
- Sweden
- Switzerland
- United Kingdom
7 countries and territories in Asia:
2 countries and 2 territories in the Americas:
2 countries in Oceania:
d The CIA has modified an older version of the IMF's list of 38 Advanced Economies, noting that the IMF's Advanced Economies list "would presumably also cover the following nine smaller countries of Andorra, Bermuda, Faroe Islands, Guernsey, Holy See, Jersey, Liechtenstein, Monaco, and San Marino[...]". San Marino was later included in the IMF's list.[17]
Paris Club members
There are 22 permanent members in the Paris Club (French: Club de Paris), a group of officials from major creditor countries whose role is to find coordinated and sustainable solutions to the payment difficulties experienced by debtor countries.
15 countries in Europe:
3 countries in the Americas:
3 countries in Asia:
1 country in Oceania:
Comparative table (2020)
Comparative table of countries with a "very high" human development (0.800 or higher), according to UNDP; OECD members; "advanced" economies, according to the IMF; "high income" economies, according to the World Bank; and income per capita (purchasing power parity) higher than $22,000, according to the IMF.
| Developed Countries | |||||
|---|---|---|---|---|---|
| Countries | HDI[13] | OECD[27] | IMF[28] | WB[29] | Per capita PPP[30] |
| 2018 | |||||
| Yes since 2005 | Yes since 2018 | Yes since 2015 | Yes since 2012 | Yes since 2011 | |
| 2016 | |||||
| Yes since 2005 | Yes since 2016 | Yes since 2014 | Yes since 2012 | Yes since 2013 | |
| 2011 | |||||
| Yes since 2003 | Yes since 2010 | Yes since 2011 | Yes since 2006 | Yes since 2011 | |
| 2010 | |||||
| Yes since 1991 | Yes since 2010 | Yes since 1997[31] | Yes since 1987 | Yes since 2004 | |
| Yes since 1998 | Yes since 2010 | Yes since 2007 | Yes since 1997 | Yes since 2004 | |
| 2009 | |||||
| Yes since 2001 | Yes since 1995 | Yes since 2009 | Yes since 2006 | Yes since 2005 | |
| Yes since 2006 | Yes since 2000 | Yes since 2009 | Yes since 2007 | Yes since 2007 | |
| 2005 | |||||
| Yes since 2005 | Yes since 1961 | Yes since 1989[32] | Yes since 1994 | Yes since 2004 | |
| Yes since 1999 | Yes since 1996 | Yes since 1997[31] | Yes since 2001 | Yes since 2005 | |
| 2002 | |||||
| Yes since 2001 | Yes since 1961 | Yes since 1989[32] | Yes since 1996 | Yes since 2002 | |
| 2001 | |||||
| Yes before 1990 | Yes since 1973 | Yes since 1945 | Yes since 1987 | Yes since 2001 | |
| 1999 | |||||
| Yes since 1995 | Yes since 1961 | Yes since 1945 | Yes since 1987 | Yes since 1999 | |
| 1997 | |||||
| Yes since 1994 | Yes since 1969 | Yes since 1945 | Yes since 1987 | Yes since 1997 | |
| Yes since 1996 | Yes since 1961 | Yes since 1945 | Yes since 1987 | Yes since 1997 | |
| 1996 | |||||
| Yes before 1990 | Yes since 1961 | Yes since 1945 | Yes since 1987 | Yes since 1996 | |
| Yes since 1992 | Yes since 1961 | Yes since 1945 | Yes since 1987 | Yes since 1996 | |
| 1995 | |||||
| Yes since 1995 | Yes since 1962 | Yes since 1945 | Yes since 1987 | Yes since 1994 | |
| Yes before 1990 | Yes since 1961 | Yes since 1945 | Yes since 1987 | Yes since 1995 | |
| 1994 | |||||
| Yes before 1990 | Yes since 1971 | Yes since 1945 | Yes since 1987 | Yes since 1994 | |
| Yes before 1990 | Yes since 1961 | Yes since 1945 | Yes since 1987 | Yes since 1994 | |
| Yes before 1990 | Yes since 1961 | Yes since 1945 | Yes since 1987 | Yes since 1994 | |
| Yes since 1993 | Yes since 1961 | Yes since 1945 | Yes since 1987 | Yes since 1994 | |
| 1993 | |||||
| Yes before 1990 | Yes since 1964 | Yes since 1945 | Yes since 1987 | Yes since 1993 | |
| 1992 | |||||
| Yes since 1992 | Yes since 1961 | Yes since 1945 | Yes since 1987 | Yes since 1992 | |
| Yes since 1992 | Yes since 1961 | Yes since 1945 | Yes since 1987 | Yes since 1985 | |
| 1991 | |||||
| Yes since 1991 | Yes since 1961 | Yes since 1945 | Yes since 1987 | Yes since 1991 | |
| Yes before 1990 | Yes since 1961 | Yes since 1945 | Yes since 1987 | Yes since 1991 | |
| Yes before 1990 | Yes since 1961 | Yes since 1945 | Yes since 1987 | Yes since 1991 | |
| 1989 | |||||
| Yes before 1990 | Yes since 1961 | Yes since 1945 | Yes since 1987 | Yes since 1989 | |
| 1987 | |||||
| Yes before 1990 | Yes since 1961 | Yes since 1945 | Yes since 1987 | Yes since 1985 | |
| Yes before 1990 | Yes since 1961 | Yes since 1945 | Yes since 1987 | Yes since 1985 | |
| Countries to be considered developed (1 pending recognition) | |||||
| Countries | HDI[13] | OECD[27] | IMF[28] | WB[29] | Per capita PPP[30] |
| Yes since 1999 | No | Yes since 1997[31] | Yes since 1987 | Yes since 1990 | |
| Yes since 2007 | Yes since 2010 | No | Yes since 2012 | Yes since 2013 | |
| Yes since 2003 | Yes since 1996 | No | Yes since 2009 | Yes since 2011 | |
| Yes since 2003 | No | Yes since 2008 | Yes since 2002 | Yes since 2003 | |
| Yes since 2001 | No | Yes since 2001 | Yes since 1988 | Yes since 1999 | |
| Yes since 2005 | Yes since 1996 | No | Yes since 2014 | Yes since 2010 | |
| In process (2 pending recognitions) | |||||
| Countries | HDI[13] | OECD[27] | IMF[28] | WB[29] | per capita PPP[30] |
| Yes since 2019 | No | No | Yes since 2017 | Yes since 2014 | |
| Yes since 2019 | No | No | Yes since 2019 | Yes since 2018 | |
| Yes since 2013 | No | No | Yes since 2019 | Yes since 2016 | |
| Yes since 2014 | No | No | Yes since 2012 | Yes since 2019 | |
| Yes since 2007 | No | No | Yes since 2017 | Yes since 2015 | |
| Yes since 2016 | No | No | Yes since 1987 | Yes since 1997 | |
| Yes since 2018 | Yes since 1961 | No | No | Yes since 2014 | |
| Yes since 2014 | No | No | Yes since 1987 | Yes before 1980 | |
| Yes since 2012 | No | No | Yes since 2001 | Yes since 1983 | |
| Yes since 2012 | No | No | Yes since 2007 | Yes since 1991 | |
| No data | No | Yes since 2012 | Yes since 2000 | Yes before 1980 | |
| Yes since 2010 | No | No | Yes since 2004 | Yes before 1980 | |
| Yes since 2004 | No | No | Yes since 1987 | Yes before 1980 | |
| Yes since 1999 | No | No | Yes since 1990 | Yes before 1980 | |
| Yes since 1996 | No | No | Yes since 1987 | Yes before 1980 | |
| Other recognitions | |||||
| Countries | HDI[13] | OECD[27] | IMF[28] | WB[29] | per capita PPP[30] |
| Yes | No | No | Yes | No data | |
| No | No | No | Yes | Yes since 2014 | |
| Yes since 2006 | No | No | No | Yes since 2017 | |
| Yes since 2017 | No | No | Yes | No | |
| Yes | No | No | No | No | |
| Yes | No | No | No | Yes since 2018 | |
| No | Yes since 2020 | No | No | No | |
| Yes since 2019 | No | No | No | No | |
| Yes since 2019 | No | No | No | No | |
| Yes | No | No | No | Yes since 2012 | |
| Yes | No | No | Yes | No data | |
| Yes | No | No | No | Yes since 2012 | |
| No | Yes since 1994 | No | No | No | |
| No data | No | No | Yes | No data | |
| Yes | No | No | No | No | |
| Yes | No | No | Yes | No | |
| Yes | No | No | No | Yes since 2010 | |
| No | No | No | Yes | Yes since 2013 | |
| Yes since 2019 | No | No | No | No | |
| Yes since 2015 | No | No | Yes since 2014 | Yes since 2012 | |
| No | No | No | Yes | Yes since 2005 | |
Rankings
The list below features some outstanding countries selected from the comparative table above with average data of quality (best place in rankings) and quantity (considered in how many of the 32 rankings) with an evaluation greater than 60%.
| Rank | Country | INDEX | QUALITY | QUANTITY | Quality of living [33] | Cost of living [34] | HDI [35] | per capita PPP [36] | Democracy | Peace [37] | Prosperity [38] | Corruption [39] | Economic Freedom Heritage [40] | Human Freedom Fraser [41] | Politic/Social Freedom House [42] | Competitiveness | Doing Business [43] | Gay friendly [44] | Environmental Performance [45] | Happiness [46] | Social Progress [47] | Global Talent [48] | PISA science | PISA read | PISA maths | Mobile internet speed [49] | Fixed internet speed | Fragile state [50] | Growth promise [51] | E-gov [52] | English skills [53] | Cities in motion [54] | Press freedom [55] | Health [56] | Rule of law [57] | Labor rights [58] |
|---|---|---|---|---|---|---|---|---|---|---|---|---|---|---|---|---|---|---|---|---|---|---|---|---|---|---|---|---|---|---|---|---|---|---|---|---|
| 2019 | 2020 | 2020 | 2018 | 2020 | 2020 | 2020 | 2020 | 2020 | 2020 | 2020 | 2019 | 2019 | 2020 | 2020 | 2020 | 2020 | 2020 | 2018 | 2018 | 2018 | 2020 | 2020 | 2020 | 2019 | 2020 | 2020 | 2020 | 2020 | 2018 | 2020 | 2020 | |||||
| AVG
(quality; quantity) >60% |
1-
((AVG ranks-1)/ (100-1)) |
#ranks/
32ranks |
top 100 | low top 100 | > very high | >22000 | full | < 1.8 | 2nd green on map | > score 70 | > mostly free | > score 7.5 | free | > score 60 | > score 60 | > score 7 | > score 60 | > score 6.4 | < tier 2 | < 2nd quartile | > score 400 | > score 400 | > score 400 | > 30mb | > 50mb | > very stable | > score 6 | > very high | > high | > relative high | < score 20 | > score 60 | > score 70 | < rating 2 | ||
| 1 | 95,4% | 0,94 | 0,97 | 8 | - | 10 | 21 | 6 | 5 | 1 | 1 | 8 | 4 | 8 | 10 | 4 | 10 | 1 | 2 | 2 | 5 | 25 | 19 | 13 | 12 | 6 | 4 | 4 | 1 | 2 | 6 | 3 | 17 | 1 | 9 | |
| 2 | 94,1% | 0,91 | 0,97 | 23 | - | 7 | 17 | 3 | 15 | 4 | 4 | 22 | 9 | 3 | 8 | 10 | 1 | 8 | 7 | 5 | 4 | 20 | 11 | 17 | 22 | 14 | 7 | 8 | 6 | 4 | 14 | 4 | 8 | 4 | 9 | |
| 3 | 93,5% | 0,90 | 0,97 | 11 | - | 8 | 14 | 11 | 21 | 6 | 8 | 14 | 14 | 4 | 4 | 42 | 5 | 11 | 6 | 10 | 6 | 16 | 27 | 9 | 6 | 26 | 12 | 2 | 10 | 1 | 8 | 5 | 3 | 5 | 9 | |
| 4 | 93,1% | 0,89 | 0,97 | 3 | - | 14 | 34 | 4 | 2 | 7 | 1 | 3 | 1 | 11 | 19 | 1 | 10 | 19 | 8 | 4 | 16 | 13 | 11 | 28 | 16 | 22 | 6 | 9 | 8 | 1 | 23 | 9 | 16 | 7 | 34 | |
| 5 | 92,7% | 0,85 | 1,00 | 3 | 99 | 16 | 24 | 8 | 6 | 14 | 12 | 9 | 6 | 7 | 14 | 23 | 1 | 20 | 11 | 7 | 13 | 9 | 6 | 12 | 9 | 17 | 8 | 10 | 28 | 1 | 30 | 16 | 14 | 9 | 34 | |
| 6 | 92,3% | 0,91 | 0,94 | 25 | - | 1 | 7 | 1 | 17 | 2 | 7 | 28 | 15 | 2 | 17 | 9 | - | 9 | 5 | 1 | 9 | 28 | 20 | 19 | 7 | 18 | 2 | 7 | 13 | 5 | 12 | 1 | 2 | 2 | 9 | |
| 7 | 92,3% | 0,91 | 0,94 | 2 | - | 2 | 10 | 10 | 10 | 3 | 4 | 5 | 2 | 12 | 5 | 36 | 15 | 3 | 3 | 6 | 1 | 24 | 28 | 11 | 11 | 4 | 3 | 1 | 16 | 18 | 11 | 8 | 7 | - | 34 | |
| 8 | 92,0% | 0,90 | 0,94 | 31 | - | 11 | 27 | 5 | 14 | 5 | 3 | 20 | 11 | 1 | 11 | 20 | - | 7 | 1 | 3 | 7 | 7 | 6 | 16 | 26 | 35 | 1 | 6 | 4 | 3 | 22 | 2 | 6 | 3 | 9 | |
| 9 | 91,8% | 0,87 | 0,97 | 3 | - | 6 | 19 | 13 | 16 | 8 | 9 | 27 | 9 | 19 | 7 | 22 | 10 | 10 | 17 | 11 | 11 | 16 | 21 | 20 | 31 | 28 | 13 | 11 | 25 | 8 | 7 | 11 | 18 | 6 | 9 | |
| 10 | 90,4% | 0,84 | 0,97 | 1 | - | 18 | 22 | 16 | 4 | 10 | 12 | 29 | 15 | 27 | 21 | 27 | 4 | 6 | 9 | 15 | 17 | 28 | 28 | 22 | 25 | 51 | 15 | 19 | 15 | 6 | 18 | 18 | 13 | 8 | 9 | |
| 11 | 88,9% | 0,87 | 0,91 | 11 | - | 8 | 20 | 9 | 13 | 16 | 12 | 4 | 5 | 9 | 16 | 14 | - | 13 | 12 | 8 | 10 | 16 | 17 | 30 | 5 | 60 | 10 | 15 | 5 | 1 | 17 | 26 | 5 | 11 | - | |
| 12 | 87,2% | 0,84 | 0,91 | 33 | - | 2 | 5 | 6 | 12 | 12 | 18 | 6 | 7 | 10 | 24 | 24 | - | 16 | 16 | 12 | 15 | 23 | 8 | 20 | 67 | 41 | 11 | 12 | 27 | 1 | 33 | 13 | 11 | - | 9 | |
| 13 | 85,3% | 0,83 | 0,88 | 41 | - | 13 | 29 | 14 | 42 | 13 | 12 | 7 | 17 | 22 | 9 | 8 | 5 | 4 | 13 | 20 | 12 | 15 | 15 | 17 | 42 | 47 | 29 | 13 | - | 1 | 1 | - | 23 | 13 | - | |
| 14 | 84,9% | 0,79 | 0,91 | 28 | - | 14 | 25 | - | 17 | 23 | 17 | - | 25 | 14 | 22 | 46 | 15 | 15 | 20 | 16 | 18 | 20 | 23 | 15 | 21 | 39 | 18 | 16 | 41 | 9 | 41 | 12 | 15 | 14 | 34 | |
| 15 | 84,2% | 0,90 | 0,78 | 25 | - | 11 | 4 | - | 7 | 15 | 4 | 1 | 28 | - | 1 | 2 | - | – | - | 29 | 3 | 2 | 2 | 2 | 14 | 1 | 17 | 3 | 11 | 10 | 9 | - | 22 | 12 | 34 | |
| 16 | 84,1% | 0,87 | 0,81 | - | - | 4 | 15 | 2 | 1 | 11 | 11 | 13 | 20 | 21 | 26 | 26 | 10 | 17 | 4 | 9 | 14 | 35 | 36 | 26 | - | - | 5 | 14 | 12 | - | 5 | 15 | 1 | - | 9 | |
| 17 | 82,4% | 0,83 | 0,81 | 18 | - | 23 | 3 | 12 | – | 9 | 9 | 19 | 11 | 5 | 18 | 72 | - | 2 | 10 | 14 | 8 | 34 | 38 | 34 | 15 | 19 | 9 | 5 | 33 | 11 | - | 17 | 4 | - | - | |
| 18 | 81,9% | 0,73 | 0,91 | 86 | 82 | 29 | 44 | - | 30 | 21 | 18 | 10 | 8 | 24 | 31 | 18 | - | 34 | - | 24 | 24 | 5 | 5 | 8 | 32 | 50 | 31 | 18 | 3 | 26 | 55 | 14 | 31 | 10 | 34 | |
| 19 | 81,4% | 0,82 | 0,81 | 49 | - | 19 | 31 | - | 9 | 19 | 20 | 30 | 11 | 13 | 6 | 29 | - | 12 | - | 13 | 19 | 6 | 15 | 6 | 51 | 23 | 21 | 17 | 14 | - | 4 | - | 12 | 15 | 34 | |
| 20 | 81,4% | 0,72 | 0,91 | 37 | 80 | 38 | 46 | 22 | 3 | 27 | - | - | 26 | 15 | 34 | 39 | 10 | 27 | - | 21 | 28 | 27 | 25 | 29 | 38 | 25 | 14 | 27 | 35 | 7 | 52 | 10 | 32 | 23 | 34 | |
| 21 | 79,6% | 0,78 | 0,81 | 39 | - | 26 | 28 | 20 | – | 22 | - | - | 33 | 41 | 15 | 32 | - | 5 | 23 | 18 | 21 | 25 | 23 | 26 | 30 | 8 | 19 | 21 | 19 | 28 | 3 | - | 20 | 20 | 34 | |
| 22 | 78,6% | 0,79 | 0,78 | 34 | 89 | 17 | 12 | - | – | 18 | - | 17 | 17 | 52 | 2 | 6 | - | 24 | 18 | 28 | 2 | 19 | 13 | 38 | 27 | 11 | 30 | 20 | - | 1 | 2 | - | 29 | 21 | - | |
| 23 | 76,9% | 0,73 | 0,81 | 43 | 73 | 25 | 33 | 17 | 38 | 24 | - | - | 29 | 34 | 23 | 30 | 5 | 14 | 28 | 19 | 32 | 30 | - | 35 | 40 | 13 | - | 31 | 17 | - | 25 | - | 19 | 19 | 34 | |
| 24 | 75,9% | 0,71 | 0,81 | 69 | 70 | 27 | 40 | - | 8 | 29 | - | 23 | 24 | 38 | 32 | 41 | - | 20 | 19 | 25 | 25 | 22 | 26 | 22 | - | - | 24 | 28 | 39 | 19 | 39 | - | 28 | 18 | 34 | |
| 25 | 73,4% | 0,78 | 0,69 | 77 | - | 23 | 32 | - | – | 28 | - | 25 | 26 | 61 | 13 | 5 | - | 28 | - | 17 | 27 | 8 | 9 | 7 | 1 | 12 | 20 | 23 | - | - | 19 | - | 25 | 17 | - | |
| 26 | 72,4% | 0,67 | 0,78 | 81 | 71 | 34 | 43 | - | 36 | 34 | - | 16 | 21 | 40 | 39 | 11 | - | 29 | - | 32 | 35 | 31 | 33 | 35 | 28 | 27 | 25 | 30 | 20 | 24 | - | - | 45 | - | 34 | |
| 27 | 72,3% | 0,60 | 0,84 | 78 | 72 | 55 | 65 | 15 | 35 | 39 | 21 | - | 38 | 6 | 54 | - | 5 | - | 26 | 38 | 51 | 53 | 49 | 59 | 60 | 62 | 22 | 42 | 26 | - | - | 19 | 68 | 22 | 9 | |
| 28 | 69,5% | 0,70 | 0,69 | 74 | 88 | 22 | 38 | - | 11 | 26 | - | - | 33 | 18 | 35 | 37 | - | 18 | - | 22 | 31 | 14 | 22 | 13 | 35 | 45 | 16 | 29 | 23 | - | - | - | 21 | - | - | |
| 29 | 69,1% | 0,63 | 0,75 | 90 | - | 37 | 50 | - | 34 | 32 | - | 32 | 22 | 45 | 41 | 19 | - | 40 | - | 35 | 33 | 29 | 30 | 24 | 61 | 31 | - | 34 | 49 | 29 | - | 22 | 43 | - | 34 | |
| 30 | 68,0% | 0,64 | 0,72 | 41 | 92 | 29 | 31 | - | 31 | 31 | - | - | 31 | 49 | 30 | 58 | - | 20 | - | 23 | 36 | 39 | 33 | 32 | 48 | 49 | - | 39 | 37 | - | 42 | - | 9 | - | 9 | |
| 31 | 67,6% | 0,63 | 0,72 | 82 | 47 | 35 | 44 | - | 29 | 36 | - | - | 45 | 59 | 37 | 40 | - | 41 | - | 31 | 44 | 12 | 10 | 10 | 54 | 33 | - | 35 | 24 | 16 | 54 | - | 39 | - | - | |
| 32 | 67,4% | 0,66 | 0,69 | - | 100 | 28 | 28 | - | - | 25 | - | - | 23 | 42 | 38 | 88 | 1 | 23 | 22 | 30 | 23 | 43 | 45 | 39 | 39 | 30 | 23 | 24 | 22 | - | - | - | 27 | - | - | |
| 33 | 65,1% | 0,71 | 0,59 | 74 | - | 31 | 9 | - | 41 | 42 | 21 | 18 | - | - | 25 | 16 | - | - | 21 | - | 22 | 49 | 47 | 51 | 2 | 29 | 27 | 22 | 21 | - | - | - | - | - | - | |
| 34 | 65,0% | 0,61 | 0,69 | 80 | - | 39 | - | - | 25 | 35 | - | - | 36 | 51 | 42 | 45 | - | 26 | - | 36 | 39 | 41 | 42 | 33 | 49 | 44 | 28 | - | 48 | 22 | 62 | - | 36 | - | 9 | |
| 35 | 63,7% | 0,68 | 0,59 | - | - | 19 | 36 | - | - | 30 | - | 26 | - | 76 | 20 | 35 | - | 33 | 14 | 33 | 20 | 42 | 38 | 42 | - | 32 | - | 25 | 30 | - | - | - | 35 | - | 34 | |
| 36 | 63,5% | 0,61 | 0,66 | 86 | 95 | 33 | 37 | - | - | 33 | - | 37 | 33 | 20 | 44 | 54 | - | 35 | - | 26 | 30 | 47 | 51 | 45 | 20 | - | - | 26 | 18 | - | - | 27 | 26 | - | - | |
| 37 | 61,6% | 0,58 | 0,66 | 93 | 67 | 43 | 62 | 21 | 45 | 37 | - | 15 | 30 | 44 | 33 | 59 | - | - | - | 34 | 34 | 45 | 44 | 60 | - | 21 | - | 32 | 34 | - | - | - | 49 | - | - | |
| 38 | 61,1% | 0,60 | 0,63 | 76 | 59 | 40 | 46 | - | 24 | 46 | - | - | 49 | - | 47 | 52 | - | 37 | - | - | 52 | 32 | 33 | 35 | 37 | 9 | - | 38 | 52 | 14 | - | - | 40 | - | - |
See also
Notes
- Namely sovereign states, i.e., excluding Macau: In 2003, the government of Macau calculated its HDI as being 0.909 (the UN does not calculate Macau's HDI); In January 2007, the People's Daily Archived 7 December 2008 at the Wayback Machine reported (from China Modernization Report 2007): "In 2004... Macau... had reached the level of developed countries". The UNCTAD Archived 10 July 2007 at the Wayback Machine organisation (of the UN), as well as the CIA Archived 9 April 2008 at the Wayback Machine, classify Macau as a "developing" territory. The World Bank Archived 28 August 2019 at the Wayback Machine classifies Macau as a high income economy (along with developed economies as well as with few developing economies).
- The Developed Countries Glossary Archived 20 December 2014 at the Wayback Machine entry reads: "The following countries are classified by FTSE as developed countries: Australia, Austria, Belgium/Luxembourg, Canada, Denmark, Finland, France, Germany, Greece, Hong Kong (China), Ireland, Israel, Italy, Japan, Netherlands, New Zealand, Norway, Portugal, Singapore, South Korea, Spain, Sweden, Switzerland, United Kingdom and the United States."
- Geographically a part of Asia, geopolitically a part of Europe.
- Singapore is not a member of the OECD, and has reportedly turned down offers into joining it, meaning that such recognition will remain pending in the near future. However, the country is still considered by other institutions such as the World Bank and the United Nations as developed, and membership to the OECD is not necessarily a criteria for developed status, as well as a country being a part of the OECD does not also mean that a country is developed (e.g. Colombia and Mexico). Singapore has a high-income economy, with the second-highest GDP per capita (PPP) in the world, as well as the highest Human Development Index rankings in the Asia-Pacific. In 2020, the country had also ranked first on the Human Capital Index.
References
- "World Economic and Financial Surveys World Economic Outlook Database—WEO Groups and Aggregates Information". IMF.org. International Monetary Fund. Archived from the original on 22 December 2019. Retrieved 12 May 2020.
- Least Developed Countries Archived 17 May 2011 at the Wayback Machine (2018 list Archived 21 December 2019 at the Wayback Machine)
- Developed Economy Definition Archived 22 March 2016 at the Wayback Machine. Investopedia (16 April 2010). Retrieved 2013-07-12.
- "Report for Selected Country Groups and Subjects". www.imf.org. Archived from the original on 4 March 2016.
- Sachs, Jeffrey (2005). The End of Poverty. New York, New York: The Penguin Press. ISBN 1-59420-045-9.
- Wackernagel, Mathis; Beyers, Bert (2019). Ecological Footprint: Managing Our Biocapacity Budget. Gabriola Island, BC, Canada: New Society Publishers. p. 132. ISBN 978-0865719118. Archived from the original on 30 December 2019. Retrieved 20 January 2021.
- Data from the United Nations is used.
- The Courier. Commission of the European Communities. 1994. Archived from the original on 15 March 2020. Retrieved 20 January 2021.
- "Human development index". Economics Help. Archived from the original on 17 December 2020. Retrieved 23 September 2018.
- "Millennium Development Indicators: World and regional groupings". United Nations Statistics Division. 2003. Note b. Archived from the original on 10 February 2005. Retrieved 13 May 2017.
- "Standard Country and Area Codes Classifications (M49): Developed Regions". United Nations Statistics Division. Archived from the original on 11 July 2017. Retrieved 13 May 2017.
- "IMF Advanced Economies List. World Economic Outlook, April 2016, p. 148" (PDF). Archived from the original (PDF) on 21 April 2016.
- "Human Development Report 2019 – "Human Development Indices and Indicators"" (PDF). HDRO (Human Development Report Office) United Nations Development Programme. pp. 22–25. Archived (PDF) from the original on 9 December 2019. Retrieved 9 December 2019.
- "國情統計通報" (PDF) (in Chinese). Directorate General of Budget, Accounting and Statistics, Executive Yuan, R.O.C. 2018. Archived (PDF) from the original on 12 April 2019. Retrieved 26 January 2019.
- "Macau in Figures, 2013". Archived from the original on 24 October 2013.
- Filling Gaps in the Human Development Index Archived 5 March 2016 at the Wayback Machine, United Nations ESCAP, February 2009
- CIA (2008). "Appendix B. International Organizations and Groups". World Factbook. Archived from the original on 9 April 2008. Retrieved 10 April 2008.
- World Economic Outlook Archived 21 April 2016 at the Wayback Machine, International Monetary Fund, September 2011, p. 165.
- "Archived copy". Archived from the original on 21 February 2009. Retrieved 25 January 2009.CS1 maint: archived copy as title (link)
- Indiana Express Archived 27 January 2010 at the Wayback Machine
- Minutes of Forum #26:Global Strategy Series 2 – Japan as It Should Be (Outline) | Economic and Social Research Institute, Cabinet Office, Government of Japan Archived 30 October 2007 at the Wayback Machine. Esri.go.jp. Retrieved 12 July 2013.
- Country and Lending Groups. Archived 11 January 2018 at the Wayback Machine, World Bank. Accessed on 1 July 2020.
- "Doing Business 2019 Fact Sheet: OECD High-Income" (PDF). World Bank. Archived (PDF) from the original on 1 November 2018. Retrieved 31 October 2018.
- "Doing Business 2019 Regional Profile: OECD High Income" (PDF). World Bank. Archived (PDF) from the original on 1 November 2018. Retrieved 31 October 2018.
- Peer reviews of DAC members – Organisation for Economic Co-operation and Development Archived 27 May 2013 at the Wayback Machine. Oecd.org. Retrieved 22 October 2013.
- DAC website >> "The DAC in Dates" Archived 15 February 2010 at the Wayback Machine, On the DAC's self-description, see the introductory letter. On other events, refer to the relevant section by date.
- "Our global reach – OECD". www.oecd.org. Archived from the original on 24 September 2015. Retrieved 20 January 2021.
- "World Economic Outlook Database – Changes to the Database". www.imf.org. Archived from the original on 29 December 2017. Retrieved 7 February 2019.
- "World Bank Country and Lending Groups – World Bank Data Help Desk". datahelpdesk.worldbank.org. Archived from the original on 28 October 2019. Retrieved 20 January 2021.
- "World Economic Outlook Database, October 2019". www.imf.org. International Monetary Fund. Archived from the original on 28 June 2020. Retrieved 16 March 2020.
- "International Monetary Fund Annual Report 1997". International Monetary Fund. Archived from the original on 25 June 2020. Retrieved 8 May 2020.
- "World Economic Outlook, October 1989" (PDF). International Monetary Fund. p. 12. Archived (PDF) from the original on 28 June 2020. Retrieved 8 May 2020.
- "Quality of Living City Ranking | Mercer". mobilityexchange.mercer.com. Archived from the original on 17 April 2020. Retrieved 27 March 2019.
- "Cost of Living Index. Updated Sep 2019". Expatistan, cost of living comparisons. Archived from the original on 16 January 2021. Retrieved 15 September 2019.
- "Human Development Report 2018 – "Human Development Indices and Indicators"" (PDF). HDRO (Human Development Report Office) United Nations Development Programme. pp. 22–25. Archived (PDF) from the original on 15 May 2020. Retrieved 14 September 2018.
- "World Economic Outlook Database April 2019". www.imf.org. Archived from the original on 24 July 2019. Retrieved 14 May 2019.
- Humanity, Vision of. "Global Peace Index". Archived from the original on 19 June 2019. Retrieved 20 January 2021.
- "Legatum Prosperity Index 2019 :: Legatum Prosperity Index 2019". www.prosperity.com. Archived from the original on 5 January 2021. Retrieved 20 January 2021.
- "Corruption Perceptions Index". Transparency.org. Archived from the original on 24 July 2013. Retrieved 20 January 2021.
- "Country Rankings: World & Global Economy Rankings on Economic Freedom". www.heritage.org. Archived from the original on 16 September 2017. Retrieved 20 January 2021.
- "You are being redirected..." www.fraserinstitute.org. Archived from the original on 10 November 2019. Retrieved 15 September 2019.
- "Freedom House rates 210 countries and territories in Freedom in the World, and 65 countries in Freedom on the Net". Archived from the original on 1 January 2021. Retrieved 20 January 2021.
- "Rankings". World Bank. Archived from the original on 16 January 2020. Retrieved 27 March 2019.
- "SPARTACUS Gay Travel Index 2019 | Spartacus Gay Travel Blog". Archived from the original on 7 November 2020. Retrieved 27 March 2019.
- "Downloads | Environmental Performance Index". epi.envirocenter.yale.edu. Archived from the original on 22 April 2020. Retrieved 27 March 2019.
- "Home". worldhappiness.report. Archived from the original on 30 November 2020. Retrieved 27 March 2019.
- "2018 Social Progress Index". 2018 Social Progress Index. Archived from the original on 25 January 2019. Retrieved 27 March 2019.
- "GTCI Report 2019 – Country Data". GTCI Report 2019. Archived from the original on 1 January 2021. Retrieved 27 March 2019.
- "Speedtest Global Index – Monthly comparisons of internet speeds from around the world". Speedtest Global Index. Archived from the original on 4 January 2018. Retrieved 14 May 2019.
- "Global Data | Fragile States Index". fragilestatesindex.org. Archived from the original on 15 July 2019. Retrieved 15 September 2019.
- Selfin, Vikas Papriwal,Ravi Suri,Yael (21 July 2019). "The Growth Promise Indicators – 2019 report – KPMG | AE". KPMG. Archived from the original on 29 November 2020. Retrieved 15 September 2019.
- "Data Center". publicadministration.un.org. Archived from the original on 31 October 2020. Retrieved 15 September 2019.
- "EF EPI 2018 – EF English Proficiency Index – Downloads". www.ef.edu. Archived from the original on 29 July 2020. Retrieved 15 September 2019.
- "cities in motion". Archived from the original on 27 November 2020. Retrieved 20 January 2021.
- "Press". Archived from the original on 22 May 2020. Retrieved 20 January 2021.
- "the lancet". Archived from the original on 23 December 2020. Retrieved 20 January 2021.
- "Rule of law". Archived from the original on 17 January 2021. Retrieved 20 January 2021.
- "labor rights". Archived from the original on 1 October 2020. Retrieved 20 January 2021.
External links
| Wikiquote has quotations related to: Developed country |
- IMF (advanced economies)
- The Economist (quality of life survey)
- The World Factbook (developed countries)
- United Nations Statistics Division (definition)
- List of countries, United Nations Statistics Division (developed regions)
- World Bank (high-income economies)
| Authority control |
|
|---|
