List of countries by percentage of population living in poverty
Countries by percentage of population living in poverty, as recorded by World bank and other sources.
Methodology
"Poverty" is defined as an economic condition by the lack of both money and basic necessities needed to successfully live, such as food, water, utilities, and housing. There are many working definitions of "poverty", with considerable debate on how to best define the term.
Lack of income security, economic stability and the predictability of one's continued means to meet basic needs all serve as absolute indicators of poverty. Poverty may therefore also be defined as the economic condition of lacking predictable and stable means of meeting basic life needs.
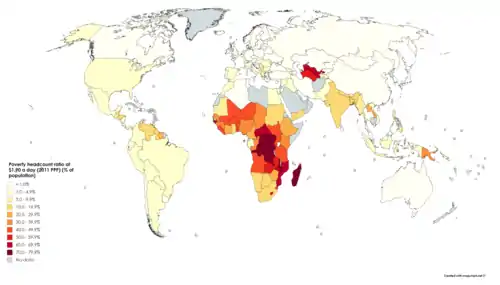
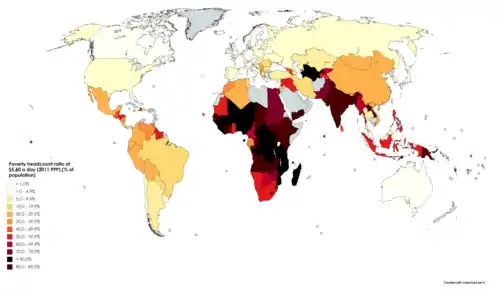
The first table lists countries by the percentage of their population with an income of less than $1.90 (the extreme poverty line), $3.20 and $5.50 US dollars a day in 2011 international (PPP) prices. The data is from the most recent year available from the World Bank API.
The second table lists countries by the percentage of the population living below the national poverty line—the poverty line deemed appropriate for a country by its authorities. National estimates are based on population-weighted subgroup estimates from household surveys.
Definitions of the poverty line vary considerably among nations. For example, rich nations generally employ more generous standards of poverty than poor nations. Even among rich nations, the standards differ greatly. Thus, the numbers are not comparable among countries. Even when nations do use the same method, some issues may remain.[2]
Only countries for which sourced data is available are listed. Data of countries, including Libya and Saudi Arabia, remains unavailable. It is usually accepted, that over one third (33.3%) of the population in Libya and Saudi Arabia live below the poverty line.[3][4]
Percent of population living on less than $1.90, $3.20 and $5.50 a day
Percent of population (including non-citizens) living on less than $1.90, $3.20, and $5.50 a day, 2011 international (PPP) dollars as per the World Bank.[1][5][6]
| Country | < $1.90[1] | < $3.20[5] | < $5.50[6] | Year | Continent |
|---|---|---|---|---|---|
| N/A | N/A | N/A | N/A | Asia | |
| 1.3% | 8.2% | 33.8% | 2017 | Europe | |
| 0.4% | 3.7% | 28.6% | 2011 | Africa | |
| N/A | N/A | N/A | N/A | Europe | |
| 51.8% | 73.2% | 89.3% | 2018 | Africa | |
| N/A | N/A | N/A | N/A | North America | |
| 1.3% | 1.3% | 12.2% | 2018 | South America | |
| 1.4% | 9.4% | 42.5% | 2018 | Asia | |
| 0.5% | 0.7% | 0.7% | 2014 | Oceania | |
| 0.3% | 0.4% | 0.7% | 2017 | Europe | |
| 0.0% | 0.0% | 8.2% | 2005 | Asia | |
| N/A | N/A | N/A | N/A | North America | |
| N/A | N/A | N/A | N/A | Asia | |
| 14.8% | 52.9% | 84.5% | 2016 | Asia | |
| N/A | N/A | N/A | N/A | North America | |
| 0.0% | 0.0% | 0.4% | 2018 | Europe | |
| 0.1% | 0.2% | 0.3% | 2017 | Europe | |
| 13.9% | 28.1% | 53.0% | 1999 | North America | |
| 49.5% | 76.2% | 90.6% | 2015 | Africa | |
| 1.5% | 12.0% | 38.6% | 2017 | Asia | |
| 4.5% | 4.1% | 22.8% | 2018 | South America | |
| 0.1% | 0.8% | 3.9% | 2011 | Europe | |
| 16.1% | 38.5% | 60.4% | 2015 | Africa | |
| 4.4% | 9.2% | 19.8% | 2018 | South America | |
| N/A | N/A | N/A | N/A | Asia | |
| 1.3% | 3.1% | 7.5% | 2017 | Europe | |
| 43.7% | 76.4% | 92.3% | 2014 | Africa | |
| 71.8% | 89.3% | 96.8% | 2013 | Africa | |
| N/A | N/A | N/A | N/A | Asia | |
| 23.8% | 44.7% | 68.9% | 2014 | Africa | |
| 0.5% | 0.5% | 0.7% | 2013 | North America | |
| 3.2% | 14.9% | 40.8% | 2015 | Africa | |
| 66.3% | 83.1% | 92.8% | 2008 | Africa | |
| 38.4% | 66.5% | 86.2% | 2011 | Africa | |
| 0.3% | 0.7% | 3.7% | 2017 | South America | |
| 0.5% | 5.4% | 23.9% | 2016 | Asia | |
| 4.1% | 10.9% | 27.8% | 2018 | South America | |
| 17.6% | 36.9% | 62.3% | 2014 | Africa | |
| 76.6% | 91.0% | 97.7% | 2012 | Africa | |
| 37.0% | 61.3% | 82.4% | 2011 | Africa | |
| 1.4% | 3.6% | 10.9% | 2018 | North America | |
| 0.5% | 1.2% | 3.8% | 2017 | Europe | |
| N/A | N/A | N/A | N/A | North America | |
| 0.0% | 0.1% | 0.1% | 2017 | Europe | |
| 0.0% | 0.1% | 0.4% | 2017 | Europe | |
| 0.1% | 0.2% | 0.2% | 2017 | Europe | |
| 17.1% | 40.2% | 70.6% | 2017 | Africa | |
| N/A | N/A | N/A | N/A | North America | |
| 0.4% | 2.6% | 13.8% | 2018 | North America | |
| 30.7% | 73.3% | 94.0% | 2014 | Asia | |
| 3.3% | 9.7% | 24.2% | 2018 | South America | |
| 3.2% | 26.1% | 70.4% | 2017 | Africa | |
| 1.5% | 9.7% | 25.7% | 2018 | North America | |
| N/A | N/A | N/A | N/A | Africa | |
| N/A | N/A | N/A | N/A | Africa | |
| 0.3% | 0.3% | 1.0% | 2017 | Europe | |
| 42.0% | 64.4% | 82.0% | 2009 | Africa | |
| 27.3% | 62.2% | 85.0% | 2015 | Africa | |
| 1.4% | 14.1% | 48.6% | 2013 | Oceania | |
| 0.1% | 0.1% | 0.1% | 2017 | Europe | |
| 0.0% | 0.2% | 0.2% | 2015 | Europe | |
| 3.4% | 11.2% | 32.2% | 2017 | Africa | |
| 10.1% | 37.8% | 72.5% | 2015 | Africa | |
| 4.5% | 15.7% | 42.9% | 2018 | Europe | |
| 0.0% | 0.0% | 0.2% | 2015 | Europe | |
| 13.3% | 30.5% | 56.9% | 2016 | Africa | |
| 0.9% | 0.7% | 4.7% | 2017 | Europe | |
| N/A | N/A | N/A | N/A | North America | |
| 8.7% | 24.2% | 48.8% | 2014 | North America | |
| 35.3% | 70.3% | 92.3% | 2012 | Africa | |
| 67.1% | 84.5% | 93.4% | 2010 | Africa | |
| 14.0% | 29.5% | 56.4% | 1998 | South America | |
| 25.0% | 50.8% | 78.9% | 2012 | North America | |
| 16.5% | 30.0% | 50.3% | 2018 | North America | |
| 0.6% | 0.6% | 3.0% | 2017 | Europe | |
| 0.0% | 0.0% | 0.2% | 2014 | Europe | |
| 13.4% | 50.4% | 82.3% | 2015 | Asia | |
| 3.6% | 21.5% | 53.2% | 2018 | Asia | |
| 0.3% | 2.5% | 11.6% | 2016 | Asia | |
| 2.5% | 17.9% | 57.3% | 2012 | Asia | |
| 0.2% | 0.5% | 0.7% | 2015 | Europe | |
| 0.2% | 0.7% | 2.7% | 2016 | Asia | |
| 1.4% | 1.3% | 3.1% | 2017 | Europe | |
| 28.2% | 57.4% | 82.3% | 2015 | Africa | |
| 1.7% | 9.1% | 29.7% | 2004 | North America | |
| 0.2% | 0.5% | 1.0% | 2008 | Asia | |
| 0.1% | 2.1% | 18.1% | 2010 | Asia | |
| 0.0% | 0.4% | 8.6% | 2017 | Asia | |
| 37.1% | 67% | 87% | 2015 | Africa | |
| 12.9% | 34.6% | 69.4% | 2006 | Oceania | |
| N/A | N/A | N/A | N/A | Asia | |
| 0.2% | 0.5% | 1.2% | 2012 | Asia | |
| 0.2% | 2.6% | 21.6% | 2017 | Europe | |
| N/A | N/A | N/A | N/A | Asia | |
| 0.9% | 15.5% | 61.3% | 2018 | Asia | |
| 22.7% | 58.7% | 85.0% | 2012 | Asia | |
| 0.7% | 1.5% | 4.0% | 2015 | Europe | |
| 0.0% | 0.0% | 1.9% | 2011 | Asia | |
| 59.7% | 78.1% | 89.9% | 2010 | Africa | |
| 40.9% | 72.6% | 92.2% | 2016 | Africa | |
| N/A | N/A | N/A | N/A | Africa | |
| N/A | N/A | N/A | N/A | Europe | |
| 0.7% | 1.0% | 3.8% | 2018 | Europe | |
| 0.2% | 0.5% | 0.5% | 2015 | Europe | |
| 77.6% | 91.0% | 97.3% | 2012 | Africa | |
| 70.3% | 89.4% | 96.7% | 2016 | Africa | |
| 0.0% | 0.2% | 2.7% | 2015 | Asia | |
| 7.3% | 24.4% | 54.3% | 2009 | Asia | |
| 49.7% | 79.3% | 94.9% | 2009 | Africa | |
| 0.0% | 0.2% | 0.2% | 2015 | Europe | |
| N/A | N/A | N/A | N/A | Oceania | |
| 6.0% | 24.1% | 58.8% | 2014 | Africa | |
| 0.2% | 0.4% | 12.7% | 2017 | Africa | |
| 1.7% | 6.6% | 23.0% | 2018 | North America | |
| 15.4% | 38.7% | 69.1% | 2013 | Oceania | |
| 0.0% | 0.9% | 13.3% | 2018 | Europe | |
| N/A | N/A | N/A | N/A | Europe | |
| 0.5% | 5.6% | 28.9% | 2018 | Asia | |
| 0.0% | 0.8% | 4.8% | 2014 | Europe | |
| 1.0% | 7.7% | 31.3% | 2013 | Africa | |
| 62.4% | 81.5% | 91.8% | 2014 | Africa | |
| 6.2% | 29.5% | 67.2% | 2015 | Asia | |
| 13.4% | 29.6% | 50.1% | 2015 | Africa | |
| N/A | N/A | N/A | N/A | Oceania | |
| 15.0% | 50.8% | 83.0% | 2010 | Asia | |
| 0.0% | 0.2% | 0.5% | 2015 | Europe | |
| N/A | N/A | N/A | N/A | Oceania | |
| 3.2% | 12.8% | 34.8% | 2014 | North America | |
| 44.5% | 76.9% | 93.4% | 2014 | Africa | |
| 39.1% | 71% | 92% | 2018 | Africa | |
| 5.2% | 9.7% | 23.1% | 2015 | Europe | |
| 0.2% | 0.2% | 0.5% | 2017 | Europe | |
| N/A | N/A | N/A | N/A | Asia | |
| 4% | 35% | 76% | 2015 | Asia | |
| N/A | N/A | N/A | N/A | Oceania | |
| 1.0% | 3.4% | 23.6% | 2016 | Asia | |
| 1.7% | 5.2% | 12.7% | 2018 | North America | |
| 38.0% | 65.6% | 86.9% | 2009 | Oceania | |
| 1.6% | 5.9% | 17.0% | 2018 | South America | |
| 2.6% | 8.3% | 22.1% | 2018 | South America | |
| 6.0% | 18.7% | 30.8% | 2015 | Asia | |
| 0.0% | 0.1% | 2.1% | 2016 | Europe | |
| 0.4% | 0.3% | 1.8% | 2017 | Europe | |
| N/A | N/A | N/A | N/A | Asia | |
| 3.5% | 7% | 15.6% | 2017 | Europe | |
| 0.0% | 0.2% | 2.3% | 2018 | Asia, Europe | |
| 55.5% | 79.7% | 91.6% | 2016 | Africa | |
| N/A | N/A | N/A | N/A | North America | |
| 4.7% | 10.6% | 20.3% | 2016 | North America | |
| N/A | N/A | N/A | N/A | North America | |
| 1.1% | 9.6% | 33.9% | 2013 | Oceania | |
| N/A | N/A | N/A | N/A | Europe | |
| 32.3% | 70.1% | 92.3% | 2010 | Africa | |
| N/A | N/A | N/A | N/A | Asia | |
| 38.0% | 67.5% | 88.1% | 2011 | Africa | |
| 5.5% | 10% | 20.3% | 2017 | Europe | |
| 1.1% | 2.5% | 6.6% | 2013 | Africa | |
| 40.1% | 74.4% | 92.1% | 2018 | Africa | |
| N/A | N/A | N/A | N/A | Asia | |
| 1.3% | 1.3% | 3.2% | 2016 | Europe | |
| 0.0% | 0.0% | 0.1% | 2017 | Europe | |
| 25.1% | 58.8% | 84.7% | 2013 | Oceania | |
| N/A | N/A | N/A | N/A | Africa | |
| 18.9% | 37.6% | 57.1% | 2014 | Africa | |
| 42.7% | 64.8% | 84.8% | 2009 | Africa | |
| 0.7% | 0.7% | 2.2% | 2017 | Europe | |
| 0.8% | 10.9% | 40.5% | 2016 | Asia | |
| 14.9% | 40.5% | 73.2% | 2009 | Africa | |
| 23.4% | 42.8% | 55.7% | 1999 | South America | |
| 0.2% | 0.2% | 0.5% | 2017 | Europe | |
| 0.0% | 0.0% | 0.0% | 2015 | Europe | |
| 1.7% | 15.3% | 50.4% | 2004 | Asia | |
| 4.8% | 20.3% | 54.2% | 2015 | Asia | |
| 49.1% | 79.0% | 93.1% | 2011 | Africa | |
| 0.0% | 0.5% | 8.6% | 2018 | Asia | |
| 49.2% | 73.2% | 90.1% | 2015 | Africa | |
| 1.0% | 7.5% | 27.5% | 2015 | Asia | |
| 3.4% | 13.1% | 32.9% | 1992 | South America | |
| 0.3% | 3.2% | 18.3% | 2015 | Africa | |
| 0.0% | 1% | 3% | 2019 | Asia, Europe | |
| 51.4% | 77.8% | 92.5% | 1998 | Asia | |
| 3.3% | 17.6% | 46.7% | 2010 | Oceania | |
| 41.7% | 69.9% | 87.8% | 2016 | Africa | |
| 0.0% | 0.4% | 4.0% | 2018 | Europe | |
| N/A | N/A | N/A | N/A | Asia | |
| 0.2% | 0.2% | 0.7% | 2015 | Europe | |
| 1.0% | 1.0% | 1.7% | 2016 | North America | |
| 0.1% | 0.4% | 2.9% | 2018 | South America | |
| 62.1% | 86.4% | 96.4% | 2003 | Asia | |
| 13.1% | 39.2% | 72.3% | 2010 | Oceania | |
| N/A | N/A | N/A | N/A | Europe | |
| 10.2% | 17.8% | 35.6% | 2006 | South America | |
| 1.9% | 7.0% | 23.6% | 2018 | Asia | |
| 18.8% | 52.2% | 81.6% | 2014 | Asia | |
| 57.5% | 74.3% | 87.2% | 2015 | Africa | |
| 21.4% | 47.2% | 74.0% | 2011 | Africa |
Population living below national poverty line
The percentage of the population living below national poverty line (%) - poverty line deemed appropriate for a country by its authorities (however definitions of the poverty line vary considerably among nations).
| Country | World Bank[8] |
Year | CIA[9] | Year | Other | Year | Continent |
|---|---|---|---|---|---|---|---|
| 54.5% | 2016 | 54.5% | 2017 | N/A | N/A | Asia | |
| 14.3% | 2012 | 14.3% | 2012 | N/A | N/A | Europe | |
| 5.5% | 2011 | 23.0% | 2006 | N/A | N/A | Africa | |
| N/A | N/A | N/A | N/A | N/A | N/A | Europe | |
| 36.6% | 2008 | 36.6% | 2008 | N/A | N/A | Africa | |
| N/A | N/A | 23.0% | 2002 | N/A | N/A | North America | |
| N/A | N/A | N/A | N/A | N/A | N/A | North America | |
| 25.7% | 2017 | 25.7% | 2017 | 35.4% | 2019[10] | South America | |
| 25.7% | 2017 | 32.0% | 2013 | N/A | N/A | Asia | |
| N/A | N/A | N/A | N/A | N/A | N/A | Oceania | |
| N/A | N/A | 3.0% | 2017 | N/A | N/A | Europe | |
| 6.0% | 2012 | 4.9% | 2015 | N/A | N/A | Asia, Europe | |
| N/A | N/A | 9.3% | 2010 | N/A | N/A | North America | |
| N/A | N/A | N/A | N/A | N/A | N/A | Asia | |
| 24.3% | 2016 | 24.3% | 2016 | N/A | N/A | Asia | |
| N/A | N/A | N/A | N/A | N/A | N/A | North America | |
| 5.9% | 2017 | 5.7% | 2016 | N/A | N/A | Europe | |
| N/A | N/A | 15.1% | 2013 | N/A | N/A | Europe | |
| N/A | N/A | 41.0% | 2013 | N/A | N/A | North America | |
| 40.1% | 2015 | 36.2% | 2011 | N/A | N/A | Africa | |
| N/A | N/A | 11.0% | 2008 | N/A | N/A | North America | |
| 8.2% | 2017 | 12.0% | 2012 | N/A | N/A | Asia | |
| 36.4% | 2017 | 38.6% | 2015 | 54.0% | 2007[11] | South America | |
| 16.9% | 2015 | 16.9% | 2015 | N/A | N/A | Europe | |
| 19.3% | 2009 | 19.3% | 2009 | N/A | N/A | Africa | |
| 26.5% | 2017 | 4.2% | 2016 | 12.1% | 2011[11] | South America | |
| N/A | N/A | N/A | N/A | N/A | N/A | Asia | |
| 23.4% | 2016 | 23.4% | 2016 | N/A | N/A | Europe | |
| 40.1% | 2014 | 40.1% | 2009 | N/A | N/A | Africa | |
| 64.9% | 2014 | 64.6% | 2014 | N/A | N/A | Africa | |
| 17.7% | 2012 | 16.5% | 2016 | N/A | N/A | Asia | |
| 37.5% | 2014 | 30.0% | 2001 | N/A | N/A | Africa | |
| N/A | N/A | 9.4% | 2008 | 4.9% | 2004[12] | North America | |
| 35.0% | 2015 | 30.0% | 2000 | N/A | N/A | Africa | |
| 62.0% | 2008 | N/A | N/A | N/A | N/A | Africa | |
| 46.7% | 2011 | 46.7% | 2011 | N/A | N/A | Africa | |
| 8.6% | 2017 | 14.4% | 2013 | 10.4% | 2011[13] | South America | |
| 3.1% | 2017 | 3.3% | 2016 | N/A | N/A | Asia | |
| 27.0% | 2018 | 28.0% | 2017 | 45.5% | 2012[11] | South America | |
| 42.4% | 2013 | 44.8% | 2004 | N/A | N/A | Africa | |
| 63.9% | 2012 | 63.0% | 2014 | N/A | N/A | Africa | |
| 46.5% | 2011 | 46.5% | 2011 | N/A | N/A | Africa | |
| 20.0% | 2017 | 21.7% | 2014 | 18.9% | 2009[11] | North America | |
| 19.5% | 2015 | 19.5% | 2015 | N/A | N/A | Europe | |
| N/A | N/A | N/A | N/A | N/A | N/A | North America | |
| N/A | N/A | N/A | N/A | N/A | N/A | Europe | |
| 9.7% | 2013 | 9.7% | 2015 | N/A | N/A | Europe | |
| N/A | N/A | 13.4% | 2011 | N/A | N/A | Europe | |
| 21.1% | 2017 | 23.0% | 2015 | N/A | N/A | Africa | |
| N/A | N/A | 29.0% | 2009 | N/A | N/A | North America | |
| 30.5% | 2016 | 30.5% | 2016 | 41.1% | 2009[11] | North America | |
| 41.8% | 2014 | 41.8% | 2014 | N/A | N/A | Asia | |
| 23.2% | 2018 | 21.5% | 2017 | 40.2% | 2009[11][14] | South America | |
| 27.8% | 2015 | 27.8% | 2016 | N/A | N/A | Africa | |
| 29.2% | 2017 | 32.7% | 2016 | 47.9% | 2009[11] | South America | |
| 76.8% | 2006 | 44.0% | 2011 | N/A | N/A | Africa | |
| 69.0% | 1993 | 50.0% | 2004 | N/A | N/A | Africa | |
| 21.8% | 2013 | 21.1% | 2016 | N/A | N/A | Europe | |
| 63.0% | 2009 | 63.0% | 2010 | N/A | N/A | Africa | |
| 23.5% | 2015 | 29.6% | 2014 | N/A | N/A | Africa | |
| N/A | N/A | 9.8% | 2013 | 17.3% | 2015[15] | Europe | |
| N/A | N/A | 10.0% | 2015 | N/A | N/A | Europe | |
| 34.0% | 2013 | 31.0% | 2009 | N/A | N/A | Oceania | |
| N/A | N/A | N/A | N/A | 13.7% | 2013[16] | Europe | |
| N/A | N/A | 14.2% | 2015 | N/A | N/A | Europe | |
| N/A | N/A | 19.7% | 2009 | N/A | N/A | Oceania | |
| 33.4% | 2017 | 34.3% | 2015 | N/A | N/A | Africa | |
| 48.6% | 2015 | 48.4% | 2010 | N/A | N/A | Africa | |
| N/A | N/A | 30.0% | 2011 | N/A | N/A | Asia | |
| 21.9% | 2017 | 9.2% | 2010 | 21.9% | 2017[17] | Asia, Europe | |
| N/A | N/A | 16.7% | 2015 | N/A | N/A | Europe | |
| 23.4% | 2016 | 24.2% | 2013 | N/A | N/A | Africa | |
| N/A | N/A | 36.0% | 2014 | N/A | N/A | Europe | |
| N/A | N/A | 16.2% | 2015 | N/A | N/A | North America | |
| N/A | N/A | 38.0% | 2008 | N/A | N/A | North America | |
| N/A | N/A | 23.0% | 2001 | N/A | N/A | Oceania | |
| 59.3% | 2014 | 59.3% | 2014 | 54.8% | 2006[11] | North America | |
| 55.2% | 2012 | 47.0% | 2006 | N/A | N/A | Africa | |
| 69.3% | 2010 | 67.0% | 2015 | N/A | N/A | Africa | |
| N/A | N/A | 35.0% | 2006 | N/A | N/A | South America | |
| 58.5% | 2012 | 58.5% | 2012 | N/A | N/A | North America | |
| 61.9% | 2018 | 29.6% | 2014 | 68.9% | 2007[11] | North America | |
| N/A | N/A | 19.9% | 2016 | N/A | N/A | Asia | |
| 14.9% | 2014 | 14.9% | 2015 | N/A | N/A | Europe | |
| N/A | N/A | N/A | N/A | N/A | N/A | Europe | |
| 21.9% | 2011 | 21.9% | 2011 | 3% | 2019 [18] | Asia | |
| 10.6% | 2017 | 10.9% | 2016 | N/A | N/A | Asia | |
| N/A | N/A | 18.7% | 2007 | N/A | N/A | Asia | |
| 18.9% | 2012 | 23.0% | 2014 | N/A | N/A | Asia | |
| N/A | N/A | 8.2% | 2013 | 6.8% | 2004[19] | Europe | |
| N/A | N/A | 22.0% | 2014 | N/A | N/A | Asia | |
| N/A | N/A | 29.9% | 2012 | 10.3% | 2014[20] | Europe | |
| 46.3% | 2015 | 46.3% | 2015 | N/A | N/A | Africa | |
| 19.9% | 2012 | 17.1% | 2016 | N/A | N/A | North America | |
| N/A | N/A | 16.1% | 2013 | N/A | N/A | Asia | |
| 14.4% | 2010 | 14.2% | 2002 | N/A | N/A | Asia | |
| 2.5% | 2017 | 2.6% | 2016 | N/A | N/A | Asia, Europe | |
| 36.1% | 2015 | 36.1% | 2016 | N/A | N/A | Africa | |
| 21.8% | 2006 | N/A | N/A | N/A | N/A | Oceania | |
| N/A | N/A | N/A | N/A | N/A | N/A | Asia | |
| N/A | N/A | 14.4% | 2016 | N/A | N/A | Asia | |
| 17.6% | 2015 | 17.6% | 2015 | N/A | N/A | Europe | |
| N/A | N/A | N/A | N/A | N/A | N/A | Asia | |
| 25.6% | 2017 | 32.1% | 2015 | N/A | N/A | Asia | |
| 23.4% | 2012 | 22.0% | 2013 | N/A | N/A | Asia | |
| 22.5% | 2014 | 25.5% | 2015 | N/A | N/A | Europe | |
| 27.4% | 2012 | 28.6% | 2004 | N/A | N/A | Asia | |
| 57.1% | 2010 | 57.0% | 2016 | N/A | N/A | Africa | |
| 50.9% | 2016 | 54.1% | 2014 | N/A | N/A | Africa | |
| N/A | N/A | N/A | N/A | N/A | N/A | Africa | |
| N/A | N/A | N/A | N/A | N/A | N/A | Europe | |
| 22.2% | 2014 | 22.2% | 2015 | N/A | N/A | Europe | |
| N/A | N/A | N/A | N/A | N/A | N/A | Europe | |
| 70.7% | 2012 | 70.7% | 2012 | N/A | N/A | Africa | |
| 51.5% | 2016 | 50.7% | 2010 | N/A | N/A | Africa | |
| 0.4% | 2015 | 3.8% | 2009 | N/A | N/A | Asia | |
| 8.2% | 2016 | 15.0% | 2009 | N/A | N/A | Asia | |
| 41.1% | 2009 | 36.1% | 2005 | N/A | N/A | Africa | |
| N/A | N/A | 16.3% | 2015 | N/A | N/A | Europe | |
| N/A | N/A | N/A | N/A | N/A | N/A | Oceania | |
| 31.0% | 2014 | 31.0% | 2014 | N/A | N/A | Africa | |
| 7.9% | 2012 | 8.0% | 2006 | N/A | N/A | Africa | |
| 43.6% | 2016 | 46.2% | 2014 | 48.0% | 2013[11] | North America | |
| 41.2% | 2013 | 26.7% | 2000 | N/A | N/A | Oceania | |
| 9.6% | 2015 | 9.6% | 2015 | N/A | N/A | Europe | |
| N/A | N/A | N/A | N/A | N/A | N/A | Europe | |
| 21.6% | 2014 | 29.6% | 2016 | N/A | N/A | Asia | |
| 24.0% | 2015 | 8.6% | 2013 | N/A | N/A | Europe | |
| 4.8% | 2013 | 15.0% | 2007 | N/A | N/A | Africa | |
| 46.1% | 2014 | 46.1% | 2015 | N/A | N/A | Africa | |
| 32.1% | 2015 | 25.6% | 2016 | N/A | N/A | Asia | |
| 17.4% | 2015 | 28.7% | 2010 | N/A | N/A | Africa | |
| N/A | N/A | N/A | N/A | N/A | N/A | Oceania | |
| 25.2% | 2010 | 25.2% | 2011 | N/A | N/A | Asia | |
| N/A | N/A | 8.8% | 2015 | N/A | N/A | Europe | |
| N/A | N/A | 17.0% | 2008 | N/A | N/A | Oceania | |
| N/A | N/A | N/A | N/A | N/A | N/A | Oceania | |
| 24.9% | 2016 | 29.6% | 2015 | 61.9% | 2005[11] | North America | |
| 44.5% | 2014 | 45.4% | 2014 | N/A | N/A | Africa | |
| 40.1% | 2018 | 46.0% | 2015 | N/A | N/A | Africa | |
| 22.2% | 2017 | 21.5% | 2015 | 30.4% | 2011[21] | Europe | |
| N/A | N/A | N/A | N/A | 4.3% | 2007[22] | Europe | |
| N/A | N/A | N/A | N/A | N/A | N/A | Asia | |
| 3.9% | 2015 | 29.5% | 2013 | 40.0% | 2012[23] | Asia | |
| 24.9% | 2006 | N/A | N/A | N/A | N/A | Oceania | |
| 29.2% | 2016 | N/A | N/A | N/A | N/A | Asia | |
| 22.1% | 2016 | 23.0% | 2015 | 26.4% | 2009[11] | North America | |
| 39.9% | 2009 | 37.0% | 2002 | N/A | N/A | Oceania | |
| 26.4% | 2017 | 22.2% | 2015 | 56.0% | 2009[11] | South America | |
| 21.7% | 2017 | 22.7% | 2014 | 34.8% | 2009[11] | South America | |
| 16.6% | 2018 | 21.6% | 2017 | N/A | N/A | Asia | |
| 15.0% | 2016 | 17.6% | 2015 | N/A | N/A | Europe | |
| N/A | N/A | 19.0% | 2015 | N/A | N/A | Europe | |
| N/A | N/A | N/A | N/A | N/A | N/A | Asia | |
| 23.6% | 2016 | 22.4% | 2012 | N/A | N/A | Europe | |
| 13.2% | 2017 | 13.3% | 2015 | 13.8% | 2017[24] | Asia, Europe | |
| 38.2% | 2016 | 39.1% | 2015 | N/A | N/A | Africa | |
| N/A | N/A | N/A | N/A | N/A | N/A | North America | |
| 25.0% | 2016 | N/A | N/A | N/A | N/A | North America | |
| N/A | N/A | N/A | N/A | N/A | N/A | North America | |
| 20.3% | 2013 | N/A | N/A | N/A | N/A | Oceania | |
| N/A | N/A | N/A | N/A | N/A | N/A | Europe | |
| 66.2% | 2010 | 66.2% | 2009 | N/A | N/A | Africa | |
| N/A | N/A | N/A | N/A | 12.7% | 2012 [25] | Asia | |
| 46.7% | 2011 | 46.7% | 2011 | N/A | N/A | Africa | |
| 25.7% | 2016 | 8.9% | 2014 | N/A | N/A | Europe | |
| 39.3% | 2013 | 39.3% | 2013 | N/A | N/A | Africa | |
| 52.9% | 2011 | 70.2% | 2004 | N/A | N/A | Africa | |
| N/A | N/A | N/A | N/A | N/A | N/A | Asia | |
| 12.6% | 2013 | 12.3% | 2015 | N/A | N/A | Europe | |
| 14.3% | 2014 | 13.9% | 2016 | N/A | N/A | Europe | |
| 12.7% | 2013 | N/A | N/A | N/A | N/A | Oceania | |
| N/A | N/A | N/A | N/A | N/A | N/A | Africa | |
| 55.5% | 2014 | 16.6% | 2016 | N/A | N/A | Africa | |
| 82.3% | 2016 | 66.0% | 2015 | N/A | N/A | Africa | |
| N/A | N/A | 21.1% | 2012 | 21.1% | 2012[26] | Europe | |
| 4.1% | 2016 | 6.7% | 2012 | N/A | N/A | Asia | |
| 46.5% | 2009 | 46.5% | 2009 | N/A | N/A | Africa | |
| N/A | N/A | 70.0% | 2002 | N/A | N/A | South America | |
| N/A | N/A | 15.0% | 2014 | N/A | N/A | Europe | |
| N/A | N/A | 6.6% | 2014 | N/A | N/A | Europe | |
| 35.2% | 2007 | 82.5% | 2014 | N/A | N/A | Asia | |
| N/A | N/A | 1.5% | 2012 | N/A | N/A | Asia | |
| 31.3% | 2015 | 31.5% | 2016 | N/A | N/A | Asia | |
| 28.2% | 2011 | 22.8% | 2015 | N/A | N/A | Africa | |
| 8.6% | 2016 | 7.2% | 2015 | N/A | N/A | Asia | |
| 55.1% | 2015 | 55.1% | 2015 | N/A | N/A | Africa | |
| 22.5% | 2009 | 22.5% | 2010 | N/A | N/A | Oceania | |
| N/A | N/A | 20.0% | 2014 | N/A | N/A | North America | |
| 15.2% | 2015 | 15.5% | 2010 | 3.8% | 2005[27] | Africa | |
| 13.5% | 2017 | 21.9% | 2015 | 20.5% | 2005[28] | Asia, Europe | |
| N/A | N/A | 0.2% | 2012 | N/A | N/A | Asia | |
| 26.3% | 2010 | 26.3% | 2010 | N/A | N/A | Oceania | |
| 21.4% | 2016 | 21.4% | 2017 | N/A | N/A | Africa | |
| 2.4% | 2017 | 3.8% | 2016 | 24.3% | 2013[29] | Europe | |
| N/A | N/A | 19.5% | 2003 | N/A | N/A | Asia | |
| N/A | N/A | 15.0% | 2013 | N/A | N/A | Europe | |
| N/A | N/A | 11.8% | 2018 | 14.5% | 2013[30] | North America | |
| 7.9% | 2017 | 9.7% | 2015 | 6.7% | 2012[31] | South America | |
| 14.1% | 2013 | 14.0% | 2016 | N/A | N/A | Asia | |
| 12.7% | 2010 | N/A | N/A | N/A | N/A | Oceania | |
| N/A | N/A | N/A | N/A | N/A | N/A | Europe | |
| 33.1% | 2015 | 19.7% | 2015 | 27.6% | 2008[11] | South America | |
| 9.8% | 2016 | 8.0% | 2017 | N/A | N/A | Asia | |
| N/A | N/A | 28.9% | 2002 | N/A | N/A | North America | |
| N/A | N/A | 18.0% | 2011 | N/A | N/A | Asia | |
| 48.6% | 2014 | 54.0% | 2014 | N/A | N/A | Asia | |
| 54.4% | 2015 | 54.4% | 2015 | N/A | N/A | Africa | |
| 72.3% | 2011 | 72.3% | 2012 | N/A | N/A | Africa |
See also
References
- "Poverty headcount ratio at $1.90 a day (2011 PPP) (% of population)". World Bank.
- ""Archived copy". Archived from the original on 2016-04-30. Retrieved 2014-01-10.CS1 maint: archived copy as title (link)" Eurostat 2010
- "Libya Economy 2017, CIA World Factbook". www.theodora.com.
- One third of the Saudi Arabia's population lives under the poverty line Archived 2016-05-09 at the Wayback Machine, 5 August 2013
- "Poverty headcount ratio at $3.20 a day (2011 PPP) (% of population)". World Bank.
- "Poverty headcount ratio at $5.50 a day (2011 PPP) (% of population)". World Bank.
- "Latest Poverty and Equity Brief for April 2020" (PDF). worldbank.org. April 2020.
- "World Databank". Databank.worldbank.org. 2015. Retrieved 2017-07-03.
- Population below poverty line, The World Factbook, CIA, accessed on July 19, 2017.
- "La pobreza subió al 35,4% y ya alcanza a 15,9 millones de argentinos, según el Indec". www.infobae.com.
- "Panorama social de América Latina 2010" (PDF). ECLAC (in Spanish). Archived from the original (PDF) on July 7, 2011. Retrieved December 1, 2010.
- Basic Needs Poverty Measure, an absolute poverty measure calculated by the Fraser Institute. (See related article, Poverty in Canada.)
- "La CASEN 2011, precisiones de la CEPAL" (PDF) (in Spanish). United Nations Economic Commission for Latin America and the Caribbean. 1 September 2012. Retrieved 1 September 2012. Note: The figure is on page 5 of the report.
- Urban areas.
- "Europe 2020 indicators - poverty and social exclusion - Statistics Explained". ec.europa.eu.
- http://www.kauppalehti.fi/uutiset/suomessa-koyhyysrajan-alla-elaa-13-7-prosenttia/UmMLpRj2
- http://geostat.ge/cms/site_images/_files/english/households/Absolute%20Poverty.xls
- "World Poverty Clock". worldpoverty.io. Retrieved 2020-11-02.
- "Poverty in Italy". www.istat.it. 30 November 2014.
- "Poverty Line" (PDF). Stat.gov.mk. Retrieved 2012-11-17.
- Poverty data: Norway. Country Reports on Human Rights Practices - 2007, US Department of State; Population: Norway - CIA The World Factbook.
- " "Below the line: Increasing poverty affecting 40% population, says report". The Express Tribune. 22 January 2014. Retrieved 27 September 2020.
Federal Minister for Planning and Development Ahsan Iqbal noted that poverty had gone from 34 per cent in 2007 to 40 per cent in 2012 and was adding to the already-substantial number of development challenges.
- Rosstat (in Russian).
- "المملكة الأقل عربياً في نسبة الفقر.. والعاشرة عالمياً في تدني نسبة الفقراء". Retrieved 2016-06-30.
- "El 21,1% de la población española, por debajo del umbral de pobreza". cadenaser.com. Retrieved 2015-07-04.
- "Newsletter-ang.pub" (PDF). Investintunisia.tn. Retrieved 2012-11-17.
- "::Welcome to Turkish Statistical Institute(TurkStat)'s Web Pages::". TurkStat. Retrieved 2012-11-17.
- "About Ukraine". UNDP in Ukraine.
- "2017 Poverty Statistics in the United States: 2017". US Census.
- http://www.diariotextual.com/economia/item/1764-cepal-argentina-es-el-pa%C3%ADs-con-menos-pobreza-de-am%C3%A9rica-latina.html Archived 2015-12-24 at the Wayback Machine.
External links
- Global Distribution of Poverty Global poverty datasets and map collection
- http://www.nationmaster.com/country-info/stats/Economy/Population-below-poverty-line
Poverty in Asia | |
|---|---|
| Sovereign states |
|
| States with limited recognition |
|
| Dependencies and other territories |
|
| |