Poverty in the United Kingdom
A significant portion of the population of the United Kingdom are considered to be in poverty under some measures of poverty.
Data based on incomes published in 2016 by Department for Work and Pensions (DWP) show that, after housing costs have been taken into consideration, the number of people living in the UK in relative poverty to be 13.44m (21% of the population).[1] In 2015, a report by Institute for Fiscal Studies reported that 21.6% of Britons were now in relative poverty. The report showed that there had been a fall in poverty in the first few years of the twenty-first century, but the rate of poverty remained broadly flat in the decade after 2004/5.[2]
Full Fact found that the British poverty rate is "almost exactly the same level as the EU average (17%)", much lower than the DWP figures due to differences in calculation methods between countries.[3]
The Poverty and Social Exclusion project at Bristol University, in 2014,[4] said that the proportion of households lacking three items or activities deemed necessary for life in the UK at that time (as defined by a survey of the wider population) has increased from 14% in 1983 to 33% in 2012.[5][6]
In 2018, Philip Alston, the UN Special Rapporteur on extreme poverty and human rights said that British Government policies and cuts to social support "are entrenching high levels of poverty and inflicting unnecessary misery", "driven by a political desire to undertake social re-engineering rather than economic necessity".[7][8] His report was rejected by the British Government, pointing to rising household incomes, declining income inequality and one million people fewer in absolute poverty since 2010.[9]
History
Before 1950s
By the end of the 19th century more than 25% of the population was living at or below the subsistence level due to low wages.[10] Only 75 per cent of population had enough money to access food, clothes, rent and fuel.[10] In 1900, millions of population lived in terrible conditions such as damp and badly built houses.[11] Persons without waged employment were generally supported by the poor law administration. At the same time, overcrowding led to the spread of disease. Things greatly improved after the First World War, and although poverty had not completely disappeared by the 1930s, it was much less than ever before.[10]
1950s and 1960s
In the early 1950s, it was believed by numerous people that poverty had been all but abolished from Britain, with only a few isolated pockets of deprivation still remaining.[12] Much of this assumption was derived from a 1951 study which showed that in 1950 only 1.5% of the survey population lived in poverty, compared with 18% in 1936 when a previous study had been conducted in York Joseph Rowntree Charitable Trust. A leader in The Times spoke positively of this 'remarkable improvement – no less than the virtual abolition of the sheerest want.'[13]
Over the course of the 1950s and 1960s, however, a "rediscovery" of poverty took place, with various surveys showing that a substantial proportion of Britons were impoverished, with between 4% and 12% of the population estimated to be living below the Supplementary Benefits’ scales. In 1969, Professor A. Atkinson stated that
- "it seems fair to conclude that the proportion of the population with incomes below the National Assistance/Supplementary Benefits scale lies towards the upper end of the 4-9 per cent."
According to this definition, between 2-5 million Britons were trapped in poverty. In addition, some 2.6 million people were in receipt of Supplementary Benefits and therefore living on the poverty line. This meant that at least 10% of the population were in poverty at this time. Bad housing conditions also constituted a major cause of poverty in the postwar era. In the early Sixties, it was estimated that three million families lived in "slums, near slums on grossly overcrowded conditions," while a 1967 housing survey of England and Wales found that 11.7% of all dwellings were unfit.[14]
In their 1965 study on poverty, "The Poor and the Poorest," Professors Peter Townsend and Brian Abel-Smith decided to measure poverty on the basis of the National Assistance levels of living and estimated that some 14% (around 7.5 million) of Britons lived in poverty.[12] Townsend and Abel-Smith also estimated that since the mid-1950s the percentage of the population living in poverty had risen from 8% to 14%.[15]
Differences in health between the classes
The continued existence of poverty in the 1960s was also characterised by differences in health between different social classes. In 1964-65 the incidence of infant deaths was more than half as much higher in the two lowest social classes than in the two highest social classes. In 1961-62 28% of all men recorded at least one spell of sickness of four days or more. For the lowest social classes, however, 35% of men had experienced this, compared with 18% of men in the highest social classes.[14] There is evidence that in large families the height of children was less than that for the average, while families with three or more children were more likely to be inadequately nourished.[16]
1970s and 1980s
In his 1979 work "Poverty in the UK", Townsend suggested that 15 million people lived in or on the margins of poverty. He also argued that to get a proper measure of relative deprivation, there was a need to take into account other factors apart from income measures such as peoples’ environment, employment, and housing standards.[12]
According to one study, 365,000 families in Britain (excluding Northern Ireland) in 1966 were in poverty by an old assistance standard, and 450,000 families by a new standard.[16] In another study on poverty, Wilfred Beckerman estimated that 9.9% of the British population lived below a standardised poverty line in 1973, compared with 6.1% of the population of Belgium.[17]
Low pay was also a major cause of poverty,[18][19] with a report by the TUC in 1968 finding that about 5 million females and about 2.5 million males earned less than £15 a week.[13] According to one study, around 20% to 23% of employees in the late 1960s had low hourly wages.[20] In 1974, a quarter of adult employees in Britain earned less than £27 a week or less before tax, only slightly above the officially defined poverty line for an average family.[21] Regional differences in pay also remained pronounced during the post-war period.[22] Slum housing also remained a problem, with 12% of British households living in houses or flats considered to be unfit for human habitation in 1972.[23] In 1975, government statistics estimated that 1,800,000 children lived in poverty.[22]
Nevertheless, the number of people estimated to be living in poor housing conditions was lower at the start of the 1970s than at the start of the 1960s. In 1961, 4,700,000 households lived in unfit or substandard homes, compared with 2,846,000 in 1971.[24]
During the late 1960s and 1970s, progress was made in reducing the level of post-war poverty and inequality,[25] with 3 million families in Britain in poverty in 1977, compared with 5 million in 1961.[26] According to the 1971 Supplementary Benefits scale, the percentage of individuals living in poverty fell from 9.4% in 1963 to 2.3% in 1973.[27] Low pay continued to remain a major problem by the end of the 1970s, however, particularly amongst manual workers.[28]
Based on various measurements, however, the number of Britons living in poverty rose significantly from 1979 to 1985. The number of Britons living in poverty (when defined as living below the Supplementary Benefit level) rose from 2,090,000 to 2,420,000 during that period, while the number of people living in poverty when defined as living on or below the Supplementary Benefit level rose from 6,070,000 to 9,380,000. Using a poverty measurement of living at 140% of the Supplementary Benefit level or below, the rise was from 11,570,000 to 15,420,000.[29]
From 1979 to 1987, the number of Britons living in poverty (defined as living on less than half the national average income) doubled, from roughly 10% to 20% of the whole population. In 1989, almost 6 million full-time workers, representing 37% of the total full-time workforce, earned less than the "decency threshold" defined by the Council of Europe as 68% of average full-time earnings.[30] In 1994, 76.7% of all part-time workers earned less than this threshold.[31]
Comparison with the rest of Europe
Figures from the European Commission estimated that from 1975 to 1985 the number of people living in poverty had doubled in Britain, from just over 3 million to 6.5 million. In 1975, the United Kingdom had fewer people living in poverty than Germany, Italy, Belgium, and Luxembourg. By 1989, Britain had a higher poverty than each of these four countries. In 1989, 12% of the British population was estimated to be living in poverty, compared with 11.7% in Italy, 8.5% in Germany, 7.9% in Luxembourg, 7.4% in the Netherlands, and 7.2% in Belgium.[29]
1990s to 2000s
From the late 1990s onwards, however, poverty began to fall steadily, helped by policies such as big increases in National Insurance benefits[32] and the National Minimum Wage Act 1998.[33] Using the 60% of median income after housing costs poverty line, the percentage of the British population living in poverty rose to 25.3% in 1996/97, compared with 13.7% in 1979.
From 1997/98 to 2004/05 (using the same 60% of median income after housing costs measurement), the percentage of the population living in poverty fell from 24.4% to 20.5%.[34] A 2000 report by the Joseph Rowntree Foundation estimated that 4 million people lacked access to a healthy diet,[35] while a review of EU food and health policies estimated that food poverty was far higher in the UK than any other EU member state.[36]
Poverty in the UK in the 21st century
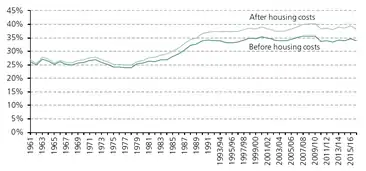
_in_the_UK%252C_1997-2014.png.webp)
Rates of poverty fell just before the turn of the century and continued to do so until 2004–5. The Institute of Fiscal Studies has counted the number of people in poverty as falling from c.37% in 1996/7 (21.8m people) to c.22% in 2004/5 (13.2m), a figure that remained the same in 2014/5 (14.1m taking population growth into account).[34][37]
The trend for Relative Poverty is the same (a fall in the number of poor from 1997/8 until 2004/5 and a relatively stable amount since then), although the earlier numbers are lower. Alternatively it is suggested poverty rose from about 2008 to 2012 but remained stable since then.[38] Socially excluded people are ten times more likely to die early than the general population.[39]
Changes to the benefit system from April 2017, such as not allowing some claimants to claim for more than two children, are predicted to increase the number of families in poverty and push a quarter of a million additional children into poverty. Policy in Practice estimates the two child limit will increase child poverty by 10% during this parliament. The Child Poverty Action Group charity (CPAG), claim it will reduce children's life chances. Alison Thewliss said, "When Theresa May stood on the steps of Downing Street last year, she said that her new government would strive to help the ‘just about managing’ in society. It appears that this was just empty rhetoric. (...) The reality is that two-thirds of those affected are already in work."[40][41] A doctor claims it is not unusual for up to seven people to live in a one bedroom flat. Parents sometimes do without food themselves in order to care for children, and others cannot afford clothes, toothbrushes, or toothpaste. Basic hygiene products like shampoo and sanitary towels are sometimes hard for poor people to afford, and some must choose between buying hygiene products and buying food. Just under one in five British children under 15 suffers food insecurity. That means sufficient safe, nutritious food cannot be guaranteed.[42][43] The minimum wage is insufficient to cover basic living expenses.[44] Nearly half of schools provide anti poverty services like food banks, clothes banks or emergency loans to families. Alison Garnham of the Child Poverty Action Group said, "With nine children in every classroom of 30 falling below the official poverty line, it is time to rebuild the safety net for struggling families."[45]
Children become sick because they cannot keep warm at home; overcrowding and damp worsens respiratory conditions. Alison Garnham of CPAG said, "Day in, day out, doctors see the damage rising poverty does to children's health. Low family incomes, inadequate housing and cuts to support services are jeopardising the health of our most vulnerable children. (...) Re-instating the UK's poverty-reduction targets would be an obvious place to start."[46]
Eurostat figures show that the numbers of Britons at risk of poverty fell to 15.9% in 2014, down from 17.1% in 2010 and 19% in 2005 (after social transfers were taken into account).[47] However, the Joseph Rowntree Foundation (JRF) fears that people who are "just about managing" could fall into poverty, as it forecast that the wages of people in low income and benefits might not keep pace with inflation.[38] One third of British households are living below what is considered an adequate income according to the JRF research.[48] Campbell Robb of the JRF said, "Millions of families across the country are teetering on a precipice, with 400,000 pensioners and over one million more children likely to fall into poverty and suffer the very real and awful consequences that brings if things do not change. One of the biggest drivers of the rise in child poverty is policy choices, which is why it is essential that the Prime Minister and Chancellor use the upcoming Budget to put in place measures to stop this happening. An excellent start would be to ensure families can keep more of their earnings under the Universal Credit."[49]
Poverty exists in rural communities as well as in urban areas. Rural poverty is frequently overlooked.[50]
The most common form of child poverty today is poverty in working families. Roughly 30% of British children are now classed as poor and of those two-thirds are from working families. Analysts claim cuts to working-age benefits would likely increase poverty rates greatly during the three years following 2017. Campbell Robb said, “These troubling figures are warning signs we could be at the beginning of a sharp rise in poverty, with forecasts suggesting child poverty could rise further by 2021.”[51][52]
In work poverty can be compounded by employees who do not get the pay that they are entitled to. A 2017 report by Middlesex University and Trust for London revealed that at least 2 million workers in Britain are losing an estimated £3 billion in unpaid holiday pay and wages per year. It suggested that withholding holiday pay, not paying wages and workers losing a couple of hours money per week are some of the deliberate strategies used by employers to improve their profits.[53]
Food Standards Agency (FSA) research suggests some poor people miss meals or do without healthy food due to financial pressure. One third of unemployed people have cut out meals or reduced the quality of their diet due to lack of cash. 8% of respondents to a survey have low or very low food security, implying just under four million adults regularly struggle to get enough to eat. Other studies showed benefit freezes together with rising food prices are major factors in food insecurity. Rachel Loopstra who lectures in nutrition at King’s College London, said: “These robust survey data confirm how serious the scale of the problem of people not having enough money for food to eat is in the UK, and are consistent with reports of increasing food bank usage. Anna Taylor of the 'Food Foundation' thinktank, said: “To take so many British people off the breadline the government must drive uptake of the Healthy Start programme for young and low-income mothers, tackle gaps in food provision during school holidays, and review our welfare policies to protect the diets of society’s most vulnerable.” Campaigners and MPs have urged the British government to monitor food insecurity. Ministers so far refused but the Scottish government agreed to enact a food insecurity measure. Women and young people are more likely to live in food insecure households.[54]
The Institute for Fiscal Studies says the benefit rate freeze and child tax credit cuts, together with the rollout of universal credit, which is less generous due to changes in work allowances, means, “large losses” for low-income households. John McDonnell said the IFS analysis showed a “clear threat” to working people’s living standards, while the Liberal Democrats said that the “savage cuts” would make millions of households poorer. Projected benefit cuts will lead to the poorest working-age households losing between 4% and 10% of their income a year, according to the IFS.[55] Fewer than one in ten British people believe all work is fair and decent, and 75% think more should be done to make work fairer. Many British people suffer insecure work with zero hours contracts.[56] Nearly half of workers are anxious over basic household expenses like food, transport and energy. One in six workers had left the heating off despite it being cold to save on fuel bills, and similar numbers had pawned possessions in the previous year because they were short of money.[57] Rents are rising and housing benefit is not rising to match this. Families are forced into increasing poverty, some facing a daily struggle to pay their rent and put food on their table. Some risk homelessness. Families with children are most affected and two thirds of affected families are in work.[58] Homelessness has risen over the last six years and the National Audit Office thinks welfare reforms and a freeze in housing benefit are a likely cause.[59] Over a million vulnerable people with low incomes are experiencing worse poverty because they have to rent in the private rental sector since social accommodation is in very short supply. A shortage of social housing caused the private rented sector to double over 25 years. That forced more households, sizable numbers on benefits with dependent children or a disabled person, to pay appreciably more for inappropriate housing. Benefit sanctions drive tenants into rent arreas, can lead to evictions and homelessness. Dr Julie Rugg of the centre for housing policy at the University of York said, “Because of sanctions you’re more likely to fall into arrears and to be asked to leave because you are in arrears, The welfare system change has created vulnerability. It didn’t used to be the case 10 years ago but it is now. People know the benefits system is tightening up but they might not realise that if you’re at the bottom end and receiving benefits then your situation can be pretty precarious indeed.” 38% of the private rented sector today is low income households, classed as vulnerable and 90% of these are either in poverty or living in overcrowded conditions. The short supply of social housing enables private landlords to charge more than housing associations, frequently for worse accommodation.[60]
An All Party Parliamentary Group on Hunger warned that too many poorer British children are hungry or malnourished during school holidays. Some subsist on a diet of crisps or stodgy food. One million children who receive free school meals during term time are at risk, as are two million more from working poor families. For both types, school holidays add to financial pressure on families through the need to pay for childcare, food and fuel. These children return to school in bad physical shape, learn less well and get behind children who were better fed during school holidays. The life chances of underfed children are damaged.[61][62]
When housing benefit does not fully cover rent, people can struggle to pay rent and buy other necessities as well. This can lead to increasing debt. Anne Baxendale of Shelter, said: “We are deeply concerned that the current freeze on housing benefit is piling a huge amount of pressure on to thousands of private renters who are already teetering on the brink of homelessness.” People are forced out of their homes because they cannot pay their rent and all their other bills.[63][64]
As of 2017, 20% of Britons live in poverty including 8 million working-age adults, 4 million children and 1.9 million pensioners. Research by the JRF found nearly 400,000 more British children and 300,000 more British pensioners were in poverty in 2016-17 compared with 2012–13.[65]
From April 2018, child benefit will be limited to the first two children, which will affect 150,000 families. Withdrawal of family element from new Universal Credit claims and tax credit claims for families with children will affect 400,000 families.[66]
Single parents are particularly heavily affected by benefit sanctions. A 2018 report from Gingerbread and Trust for London showed that three times as many single parents were sanctioned under JSA in 2016/17 than 2005/06. These sanctions can compound the financial hardship of those already on a low income.[67]
In 2018, Citizens Advice stated that up to 140,000 households went without power as they could not afford to top up prepayment meters and most such households included children or someone with a long-term health problem. The Living Wage Foundation stated many poorest parents went without meals, a third of parents on low incomes do this regularly through lack of money. Roughly half of those families are behind with household bills.[68]
TUC sponsored research indicates that 3.1 million children in working families will be below the official breadline in 2018, this is a million more than in 2010. About 600,000 children with working parents became poor due to the government's benefit cuts and public sector pay limits, the report by the consultancy Landman Economics stated. The research found that the biggest increase in child poverty among working families will be in the East Midlands, followed by the West Midlands and Northern Ireland.[69] Teachers and teaching assistants bring items into schools like food, sanitary products and toilet paper for children from families that are short of these things.[70]
Inflation has been rising while the level of many benefits has remained fixed in money terms. This is causing hardship to low-income families and there are calls for the level of benefits to be increased.[71] Over 14 million people, as well as 4.5 million children, live below the breadline, and over half are trapped in poverty for years. Poverty is particularly frequent in families with a disabled person, single-parent families, and households where no one works or that are dependent for income on irregular or zero-hours jobs. 12% of the British population have spent the bulk or all of the four years to 2018 below the breadline. Alison Garnham of the Child Poverty Action Group said, “What we now need is for government to move on from its denial of the problem, set targets for reducing and eradicating child poverty, and implement policies to support low-income families.” The Institute for Fiscal Studies predicted children living in poverty will reach a record 5.2 million over the five years from 2018 as government welfare cuts take effect, more than reversing all the progress made over the previous 20 years.[72]
Many poor people live in areas where there is no large supermarket nearby and must rely on corner shops where food range is smaller. Poor people in these areas cannot easily afford to buy fresh fruit and vegetables or to travel to large supermarkets where there is healthier food. Such areas include Marfleet in Hull, Hartcliffe in Bristol, Hattersley in Greater Manchester, Everton in Liverpool and Sparkbrook in Birmingham. Eight of the ten most deprived areas in Scotland are in Glasgow, and three of the nine worst in Wales are in Cardiff. Poor people, older people and disabled people are most affected when fresh food is not available locally. nearly 4 million British children are judged to live in households that would find it difficult to afford enough fruit, vegetables and other healthy foods to reach official guidelines, the Food Foundation maintains. Food prices increased by 7.7% from 2002 to 2016, while the poorest families' incomes fell by 7.1%.[73]
Rising poverty and austerity put pressure on low income families and increase the number of children taken into care. Children in the poorest areas were 19 times more likely to be subject to a child protection plan or to be subject to care proceedings than children in wealthier areas.[74] Citizens Advice maintains over a third of people subject to the freeze on benefits have under £100 a month to live on after paying rent, council tax, paying for gas, electricity and food.[75]
There were 56,210 emergency admissions for pneumonia in England from April 2018 to March 2019 among patients 18 years old or younger. From April 2008 to March 2009 there were only 36,862 such admissions. Hospital admissions were higher in deprived parts of England. WHO maintains crowded housing, indoor air pollution, parental smoking, lack of breastfeeding, and malnutrition are known to increase the risk of childhood pneumonia.[76]
Disabled people and their carers are disproportionately frequently in poverty. Disabled living is more expensive than living for able bodied people and disabled benefits do not cover the extra cost. Disabled people frequently claim other benefits as well as disabled benefits and many of these benefits have been frozen during austerity while prices have risen.[77]
Poor people develop ill health at an earlier age than better off people. Poorer men on average are diagnosed with their first serious long-term illness when they are 56 and poorer women at 55. In the poorest places, women develop their first serious long-term illness at only 47 and men at 49. Poor health reduces economic productivity and, since health is worse in the north of England, this is a factor in low economic productivity in the north.[78]
Reactions to poverty
The Office for National Statistics has estimated that in 2011, 14 million people were at risk of poverty or social exclusion, and that one person in 20 (5.1%) was now experiencing "severe material depression." Poverty among young people increased by 3.9% from 2007 to 2010.[79] In assessing social inequality in Britain, Danny Dorling has noted that "people in different parts of Britain and people living within different quarters of its cities are living in different worlds with different norms and expectations. This was not the case a few decades ago. This is not the case to the same extent in the majority of affluent nations in the world."[80]
A new term is appearing, 'Just About Managing' or 'JAM'. This applies to people who can put food on the table and pay rent or mortgage at least part of the time but have problems if their income falls or if there are unexpected bills. JAM's are typically families where at least one person works. JAM's may suffer social exclusion being unable to afford holidays or evenings out.[81][82]
The Resolution Foundation claims that the incomes of the poorest 10% in the UK will fall by 3% in real terms by 2020 due to government policies on tax and welfare. The lowest third of incomes will suffer falls in income over the coming years. Incomes will fall because many welfare benefits that poorer people receive have been frozen in cash terms and with inflation cash will be worth steadily less.[83]
_in_the_UK%252C_1996-2014.png.webp)
In 2017-18 the Resolution Foundation reckons the official poverty rate increased from 22.1% to 23.2%, the child poverty rate rose in 2017-18 from 30.3% to 33.4%. Cuts to benefits and inflation are blamed for the rise, benefit levels have remained unchanged in money terms while inflation erodes their real value.[84]
The Institute for Fiscal Studies reported the numbers of poor United Kingdom children in wage-earning families increased from 2009 to 2014 and more poor children currently live in working families than live in families on benefits. The IFS reported "Recent falls in inequality are likely to prove temporary. Stronger earnings growth and the Conservatives’ planned income tax cuts would do most for incomes towards the top of the distribution, while planned benefit cuts will hit low-income households [both in and out of work] hardest."[85][86] The number of workers becoming poor despite working is rising faster than employment. Four million are now classed as working poor, that is one in eight of workers. Growing numbers of working parents find it more difficult to earn enough money for food, clothing and housing because of weak wage growth, reduction in welfare support and tax credits and the increasing cost of living. Children trapped in poverty increased by half a million during the five years to 2018 and reached 4.1 million in 2017. In a typical class of 30 children, nine would be in poverty. Campbell Robb of the Joseph Rountree Foundation said, “We are seeing a rising tide of child poverty as more parents are unable to make ends meet, despite working. This is unacceptable.” Over 14 million people, about one in five of the British population are in poverty, according to the Joseph Rountree Foundation. Of them 8.2 million are working-age adults, 4.1 million are children and 1.9 million are pensioners. Eight million people live in poverty in families where at least one person is working.[87]
Anne Longfield, Children's Commissioner for England wrote: "The majority of children living in poverty have at least one parent who is working. Employment is important but if wages do not rise substantially in relation to living costs it will not provide a route out of poverty alone. The Joseph Rowntree Foundation has today published a report stating that families with children working full-time on the National Minimum Wage are now 15% short of the Minimum Income Standard that people believe offers an acceptable standard of living. Today's announcement will effectively confine to history any figures on the millions of children being raised in families who experience in-work poverty denying them necessities such as adequate food, clothing and heating."[88]
Julia Unwin of the Joseph Rowntree Foundation said: "A strong economy and rising employment have masked the growing problem of in-work poverty, as years of below-inflation wage rises have taken their toll on people's incomes. The upcoming minimum wage rise will help, but many low-income working families will still find themselves worse off due to tax-credit changes. Boosting productivity and creating more jobs which offer progression at work is vital to make work a reliable route out of poverty."[85]
Campbell Robb of Shelter said: "It's heart-breaking to think that so many people are having to make a choice between paying the rent and putting food on the table, or living in fear that any drop in income would leave them unable to cover their housing costs. The sad truth is that far too many people in Britain right now are living in homes that just aren't up to scratch - from the thousands of families forced to cope with poor conditions, to a generation of renters forking out most of their income on housing each month and unable to save for the future."[89]
As of 2015 there is actual hunger in the United Kingdom and significant numbers of British citizens are driven to use food banks. There is also significant malnutrition. Poorer people are frequently forced to buy and eat cheaper, less healthy food. The BMJ, a British peer-reviewed medical journal published:
For the poorest in our society, up to 35% of disposable income will now be needed for food, compared to less than 9% for the more wealthy. This will increase reliance on cheap, highly processed, high fat, high sugar, high salt, and calorie-dense, unhealthy foods. Re-emerging problems of poor public health nutrition such as rickets and malnutrition in the elderly are also causes for concern.
— (John D Middleton Vice president John R Ashton, Simon Capewell Faculty of Public Health)[90]
In 2016, 10% of British households lived in fuel poverty. Fuel poverty is calculated by gauging if a household's income would fall below the official poverty line after spending the actual amount needed to heat the home. The average fuel poverty gap of these households – that is, the amount needed to escape fuel poverty – is £371 a year, the latest figures indicate, with those in privately rented properties hit hardest.[91]
In a 2013 report commissioned by the Joseph Rowntree Foundation[92] poverty and participation are analyzed as a social phenomenon characterizing British society following the tradition initiated several decades ago by Peter Townsend. Participation in society is measured in terms of social relationships, membership of organisations, trust in other people, ownership of possessions and purchase of services. The study finds out that all these dimensions of participation are lower among people with low incomes. While participation generally drops as income declines, participation stops falling among the 30 percent or so of people with the lowest incomes, creating a participation 'floor'. The 30 percent of people with the lowest incomes are forced to choose between the basic necessities of modern life; they must decide which needs to neglect.
For people affected by the floor, additional income may well be spent on upgrading the quality of necessary goods and services rather than adding to them. Averages mask important variation. The participation floor for benefit recipients is lower than for other groups on the same income. Most minority ethnic groups experience greater material deprivation than the white majority but social participation is, on average, higher. Children's engagement in school life and friends is not directly affected by household income. However, parents on low incomes, on average, play less often with their children and spend less on activities. This is associated with poorer educational outcomes as judged by teachers. Low-income parents frequently spend more time than affluent ones assisting children with their school work because they have fallen behind their classmates.
Poverty and economic insecurity increase the risk that a person will commit suicide. The Samaritans claim that the British economic condition – including low incomes, job insecurity, zero-hours contracts, unmanageable debts and poor housing – all add to suicide risk. A report titled Dying from Inequality describes “overwhelming evidence of a link between socioeconomic disadvantage and suicidal behaviour”. “Men in the lowest social class, living in the most deprived areas, are up to 10 times more at risk of suicide than those in the highest social class living in the most affluent areas,” the report says. Unemployed people are more at risk of suicide than people with work, people with low education and people living in deprived areas are also at increased risk.[93]
In 2017, inequality has been forecast to return to the levels of the Thatcher years. Torsten Bell of the Resolution Foundation, said: "[A] boom is slowing rapidly as inflation rises, productivity flatlines and employment growth slows. ... This time around it’s low- and middle-income families with kids who are set to be worst affected. This could leave Britain with the worst of both worlds on living standards – the weak income growth of the last parliament and rising inequality from the time Margaret Thatcher was in Downing Street. The prime minister’s focus on supporting just managing families is absolutely right."[94]
Wales
Poverty within the UK is particularly concentrated in Wales. While the relative income-poverty rate for the UK stood at 16.8% in 2014, the same poverty rate for Wales stood at 23% in the same year.[95][96] Poverty in Wales has remained in the 25% range, with only small dips throughout the last decade.[96] While the trends correlate with overall reductions in less impoverished areas of the UK, it does not correlate with Scotland, who in the 1990s, had a relative similar poverty trend as Wales.[95] Conservative attitudes began to grow during the reign of the Labour party in the 2000s, culminating in an overall negative opinion towards public spending increases beginning in the 2010s.[97]
London
Data published in 2017 by the New Policy Institute and the Trust for London found that 27% of Londoners live in poverty, six percentage points higher than in the rest of England. This represents 2.3 million Londoners, 58% of whom are in a working family.[98] Further research published by Trust for London, carried out by Loughborough University, found that two in five Londoners cannot afford what the public regard as a decent standard of living – one that allows them to meet their basic needs and participate in society at a minimum level. This is significantly higher than the 30% that fall below the standard in the UK as a whole, and represents 3.3 million Londoners.[99]
How poverty in the United Kingdom is defined and measured
Historical statistics on poverty
The table below shows the percentage of the population in poverty derived by three different measures: relative poverty (earning less than 60% of the median), the National Assistance scale and the Supplementary Benefits scale. Estimates from the National Institute of Economic and Social Research.[100]
The United Kingdom currently does not have an official measurement of poverty.[101]
| Relative poverty | National assistance scale | Supplementary benefits scale | ||||
| Year | Households | Individuals | Households | Individuals | Households | Individuals |
| 1953/54 | 6.5% | 4.8% | 6.5% | 4.8% | 22.5% | 21.0% |
| 1963 | 6.8% | 5.5% | 2.5% | 1.4% | 10.5% | 9.4% |
| 1967 | 5.8% | 5.3% | 0.9% | 0.9% | 6.0% | 5.5% |
| 1971 | 4.9% | 4.2% | 0.5% | 0.5% | 4.9% | 4.2% |
| 1973 | 4.3% | 3.0% | 0.3% | 0.2% | 3.5% | 2.3% |
Estimates of poverty in the United Kingdom from 1950-1975 (percentage of population)[102]
1953-54: 1.2% (Abel-Smith and Townsend, FES) Unit: Household
1954: 12.3% (Gough and Stark, IR) Unit: Tax unit
1959: 8.8% (Gough and Stark, IR) Unit: Tax unit
1960: 3.8% (Abel-Smith and Townsend, FES) Unit: Household
1963: 9.4% (Gough and Stark, IR) Unit: Tax unit
1967: 3.5% (Atkinson, FES) Unit: Household
1969: 3.4% (Atkinson, FES) Unit: Household
1968-69: 6.4% (Townsend, Survey) Unit: Household
1971: 4.9% (Fiegehen et al., FES) Unit: Household
1975: 11.3% (Berthoud and Brown, GHS) Unit: Household
Poverty as 60 percent of median income
The most common measure for poverty, as used in the Child Poverty Act 2010, is ‘household income below 60 percent of median income’. The median is such an income that exactly a half of households earn more than that and the other half earns less.[103]
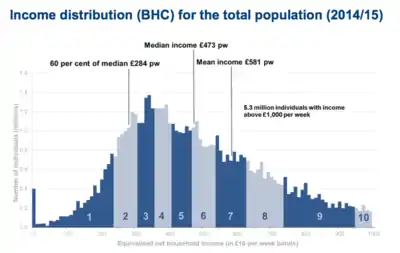
In 2014/5, the median income in the UK was £473 per week (£24,596 a year). Those earning 60% of this figure (£284 a week / £14,758 a year) were considered to be in the low income bracket.
This is the definition that is used by the British government's Department of Work and Pensions in its yearly survey Households below average income.[104] However, their reports expressly avoid using the word poverty, using low income instead. Reports from others agencies, such as the Institute of Fiscal Studies Living Standards, Poverty and Inequality in the UK, use the same methodology, but specifically use the word poverty.[37][105]
This measure can be further divided.
Those who live in absolute poverty have a ‘household income below 60 percent of median income' as compared to a rate fixed in 2010/11 and that only changes in line with inflation.
Those who live in relative poverty have a ‘household income below 60 percent of median income' as compared to all other incomes in the same year.
Absolute poverty is better at judging poverty in the short term, whereas relative poverty is better at seeing long-term trends. This is because general concepts of poverty change with time, and relative poverty reflects this better.[37]
Reports on poverty also tend to take housing costs in to account, distinguishing between before housing costs (BHC, where housing costs such as rent and mortgage interest payments have not been deducted) and after housing costs (AHC). Different social groups in the UK tend to have vastly different costs for housing, affecting available income.[37]
Relative poverty was used before its formal adoption now. In the early 1980s, Tony Byrne and Colin F. Padfield defined relative poverty in Britain as a situation in which people are able to survive adequately, but they are either less well off than they used to be (such as when they retire from paid employment) or that they are at a serious disadvantage "in their ability to experience or enjoy the standard of life of most other people – for example, not being able to afford an annual holiday."[12]
In 2011, there was some discussion of the measurement for poverty being changed (from households earning less than 60% of median income) to a broader analysis of poverty.[106]
The Consensual Method
As opposed to measuring income, the Consensual Method examines which necessities (e.g. food, clothing, access to healthcare, involvement in social and leisure activities) are thought by the general public to be essential for living in contemporary British society.[107] Those families or individual who lack a number of these necessities are considered as poor. In the 2012 Poverty and Social Exclusion (PSE) survey on Living Standards, the three necessities deemed as being most often essential to a good standard of living were the ability 'to warm living areas of the home ', a 'damp-free home' and 'two meals a day.'[108]
Six specific surveys of low standards of living in the UK have made use of this method.
- 1983 Breadline Britain Survey
- 1990 Breadline Britain Survey of Britain
- 1999 Poverty and Social Exclusion Survey
- 2002 Poverty and Social Exclusion in Northern Ireland
- The 2012 PSE UK ‘Attitudes to Necessities of Life and Services’ survey
- The 2012 PSE UK 'Living Standards' survey
Social Metrics Commission
In 2018, the bipartisan Social Metrics Commission (housed by the Legatum Institute and run by CEO Philippa Stroud) proposed a New Poverty Measure to more fully capture the overall income and inescapable costs, and better identify who is in poverty. It found 14.2 million people in poverty, 7.7 million of whom are in persistent poverty.[109] It is however still a relative measurement and does not evidence the real increases in the incomes of the poorest picked up by the standard absolute measurement of poverty. In February 2019, the Social Metrics Commission voluntarily adopted the code of practice for statistics.[110] Later that year, the British Government announced it would be taking steps to adopt the metric as the official measure of British poverty.[111] Their second report published in 2019 showed that 7 million people live in persistent poverty.[112]
Other forms of poverty
Water poverty is defined by the government as spending more than 3% of disposable income on water bills. Nationally, in 2006, nearly 10% of households were in water poverty.[113]
Fuel poverty. A fuel poor household is one that struggles to keep adequately warm at reasonable cost. The most widely accepted definition of a fuel poor household is one which needs to spend more than 10% of its income on all fuel use and to heat the home to an adequate standard of warmth. This is generally defined as 21 °C in the living room and 18 °C in the other occupied rooms.[114][115] Fuel poverty affects over a million British working households and over 2.3 million households in total and increases in energy prices affect poor people severely.[116]
Causes of poverty
- Disability - Disabled adults are twice as likely to live in low income households as non-disabled adults.[117]
- Illness
- Mental illness
- Low intelligence[118] - People with an IQ of 60 or below are speculated to be in danger of poverty and homelessness in the US in 2006.
- Unemployment
- Underemployment - having a low-paid job with wages lower than the living wage, often the minimum wage, and working part-time.
- Being born to poor parents
- Lack of social capital
- Inadequate management of finances
- Being a lone parent - half of all lone parents are on a low income.[117]
- Racial discrimination[119][120]
Current/recent figures
Eurostat figures show that the numbers of Britons at risk of poverty has fallen to 15.9% in 2014, down from 17.1% in 2010 and 19% in 2005 (after social transfers were taken into account).[47]
If the poverty line is defined as those individuals and households with incomes less than 60% of their respective medians, then "nearly 60%" of those in poverty are homeowners.[121]
Historical measurements of poverty
Seebohm Rowntree chose a basic 'shopping basket' of foods (identical to the rations given in the local workhouse), clothing and housing needs – anyone unable to afford them was deemed to be in poverty. By 1950, with the founding of the modern welfare state, the 'shopping basket' measurement had been abandoned.
The vast and overwhelming majority of people that fill the government's current criteria for poverty status (see above) have goods unimaginable to those in poverty in 1900. Poverty in the developed world is often one of perception; people compare their wealth with neighbours and wider society, not with their ancestors or those in foreign countries. Indeed, this is formalised in the government's measure of poverty. A number of studies have shown that though prosperity in the UK has greatly increased, the level of happiness people report has remained the same or even decreased since the 1950s.[122][123][124] However, measures of national wellbeing as used by the Office for National Statistics, in more recent times have shown both a decline in the share of people saying they find it difficult to manage financially, rising levels of household income and income satisfaction, as well as rising levels of happiness.[125]
Poverty reduction
Welfare overview
People enter the world of poverty due to: problems at the individual/family level and problems with the economy as a whole. Problems at the individual level include: race (human categorization), gender, sexual orientation, drug use, and level of education. Problems with the economy can include: low labor participation and high levels of unemployment .[126] Welfare is financial support given by the government to people in need. There are pressures on the welfare state because welfare must be justified in terms of its contribution to economic success. Welfare must contribute positively to the economy otherwise there is a risk of damaging currency values. Damage to currency values will damage trading positions and investment which will, in turn, hurt the economy overall.[127]
The Department of Health and Social Security (DHSS) is responsible for the welfare services in the United Kingdom. Income maintenance is centrally administered through DHSS offices (regional and local level).[128] Those who earn 39 pounds a week (except some married women) or more must contribute to the National Insurance Scheme. The National Health Service (NHS) provides virtually free healthcare for all residents – this is also centrally administered.
Persistent poverty and poverty statistics
Persistent poverty is the effects of experiencing low income for long periods of time. In 2014, 6.5% of the United Kingdom's population was classified as being in persistent poverty; that equates to approximately 3.9 million people. The UK's poverty rate overall in 2014 was the 12th highest amongst all European nations at 16.8%, however; it has the third-lowest persistent poverty rate.[129] Income tends to be measured before or after housing costs are accounted for (BHC or AHC).[130] Poverty levels tend to be higher after housing costs are accounted for because the poorer households need to spend a higher percentage of their income on housing. In 2014–2015, 13.5 million people were in relative low income AHC (an increase of 300,000 from the year before) and 12.9 million people were in absolute low income AHC (a decrease of 700,000 from the year before). Relative low income means that people live in households with income below 60% of the median in a specified year. Absolute income means that people live in households with income below 60% of the median income in some base year.[130]
In 2016, the incomes of poor households are extremely sensitive to the activity in the labor market. When any downturn in the labor market occurs, the poorest people in the UK are increasingly more vulnerable and at greater risk.[131] Median income (overall) has moved 2% above pre-crisis (2007-2008) levels. During the recovery period, inequality in workers’ earnings has decreased. There has been strong employment growth along with weak earnings growth which have kept inequality low for several years.[131]
Poverty reduction strategies
In 1999, Tony Blair, the former Prime Minister of the United Kingdom, pledged that child poverty in the United Kingdom will end within a generation. The goal was to completely eradicate child poverty by 2020. Poverty is a result of several different factors, some of which include a lack of education and training, low participation in the labour market, poor working conditions and affordable housing.[132]
The key components of the UK's strategy to fight poverty are:
- To increase labour market participation of those eligible to work.
- To make work more advantageous for those receiving benefit.
- To promote financial security for families.
- To improve access to public transportation.[132]
One of the most crucial ways to reduce poverty is to increase benefit take-up. In 2009-10 almost a third of those who were eligible for means-tested benefit did not claim. In 2011–2012, 15% of those eligible for Child Tax Credit did not claim, neither did 35% of those eligible for Working Tax Credit.[126] Improving these numbers and getting those people to claim their entitlements would significantly help reduce poverty.
Ways that would help to increase benefit take-up include:
- Simplifying the procedure so that claimants could better understand their entitlements.
- Improvements to mental health services and support.
- Improving child welfare, thus enabling children to benefit from a quality education.
A decrease in poverty would mean a more active economy because more people would have the ability to purchase more consumer goods.[133]
In one of the richest nations in the world there is 14 million people below the poverty line, so there are clearly wider issues, on the whole the wealth level below the threshold can change. China have moved 800 million people out of poverty since 1978, following its lead the UK can increase the minimum wage, decrease gender wage gap, encourage income growth through profit sharing in companies, give tax refunds to lower income earners, by working closer with charities, aiming for a higher average annual income increase, decreasing inflation, allowing greater equality through education and other means of economic freedom, and cutting down on poverty on a per region basis.[134]
Viewpoints of major political parties
Poverty in 2015 General Election
For the British General Election of 2015, research was undertaken to analyse the commitment of the UK's political parties in addressing poverty. It demonstrated that "poverty has been overlooked as an issue in the General Election campaign" and that only the Green Party had an effective policy to deal with poverty. Analysis of other parties' policies and how they are used to deal with poverty ended in negative conclusions: "The Conservatives and UKIP both performed fairly badly". Labour performed better in some specific policy areas when compared to the Conservatives, but "there is not very much difference between them." Overall, the audit noted that views towards poverty were affected by specific views for those receiving social security benefits: "there was a general tendency to come down hard on welfare recipients, with a shift towards means-testing and victim-blaming across the board. This can be seen particularly in the context of Immigration and Housing."[135]
Labour Party
While leader of the Labour Government, Tony Blair vowed in 1999 to cut child poverty 25% by 2005, 50% by 2010 and to eradicate child poverty completely by 2020. The Labour Party website states:
"In 1997 Labour inherited one of the highest rates of child poverty in Europe – with one in three children living in poverty. Our mission to abolish child poverty is grounded both in our determination to secure social justice, and to tackle the problems that the social exclusion of children builds up for the long-term. Work is the best route out of poverty and our successful welfare to work measures have lifted millions out of poverty including disabled people, who have too often previously been consigned to a life on benefits. At the same time, millions of families are benefiting from the Child tax credit, the Working tax credit, and record rises in Child benefit."[136]
Their 2005 manifesto[137] states:
"[Since the Labour government came to power in 1997] there are two million fewer children and nearly two million fewer pensioners living in absolute poverty."
Conservative Party
In late November 2006, the Conservative Party garnered headlines across the press when a senior member spoke out on poverty, invoking the name of Polly Toynbee. The headlines began when David Cameron's policy advisor and shadow minister Greg Clark wrote:
"The traditional Conservative vision of welfare as a safety net encompasses another outdated Tory nostrum – that poverty is absolute, not relative. Churchill's safety net is at the bottom: holding people at subsistence level, just above the abyss of hunger and homelessness. It is the social commentator Polly Toynbee who supplies imagery that is more appropriate for Conservative social policy in the twenty first century."[138][139]
This approach generated much comment and analysis.[140] It was followed two days later by Cameron saying poverty should be seen in relative terms to the rest of society, where people lack those things which others in society take for granted, "those who think otherwise are wrong [...] I believe that poverty is an economic waste, a moral disgrace. [...] We will only tackle the causes of poverty if we give a bigger role to society, tackling poverty is a social responsibility [...] Labour rely too heavily on redistributing money, and on the large, clunking mechanisms of the state."[141]
Pressure/interest groups
The Joseph Rowntree Foundation is one of the largest social policy research and development charities in the UK and takes particular interest in the issue of poverty, with over 2,000 reports on poverty and disadvantage available on its website.
The Child Poverty Action Group campaigns for the elimination of poverty amongst children.
End Child Poverty coalition also seeks the eradication of child poverty.
The Oxfam UK Poverty Programme[142] works with people and policy makers to tackle the causes of poverty.
In July 2013, Freedom from Torture published its report "The Poverty Barrier: The Right to Rehabilitation for Survivors of Torture in the UK[143] which highlights the failings of the British asylum system in their handling of torture survivors arriving in the UK. The evidence included in the report comes from the testimony of over 100 survivors of torture and eighteen members of Freedom from Torture's clinical department. The report highlights financial insecurity, social exclusion and hopelessness and how poverty prevents the rehabilitation process. One survivor stated: "... Our current living conditions keep our torture trauma still alive. We can't move on."
See also
Footnotes
- "Households below average income: 1994/95 to 2014/15". Department for Work and Pensions. Retrieved 21 January 2017.
- "Living Standards, Poverty and Inequality in the UK: 2015" (PDF). p. 43.
- "The UK's poverty rate is around average for the EU". Full Fact. Retrieved 15 April 2019.
- "Going backwards: 1983 - 2012 - Poverty and Social Exclusion".
- Morris, Steven (18 June 2014). "Poverty hits twice as many British households as 30 years ago". The Guardian.
- Green, Chris (19 June 2014). "Deprivation Britain: Poverty is getting worse - even among working families, according to major new study". The Independent. London.
- "UN poverty expert says UK policies inflict unnecessary misery". OHCHR. Retrieved 1 February 2019.
- Booth, Robert; Butler, Patrick (16 November 2018). "UK austerity has inflicted 'great misery' on citizens, UN says". The Guardian. Retrieved 14 February 2019.
- "Ministers in 'denial' over UK poverty". BBC News. 16 November 2018. Retrieved 30 November 2018.
- "A Brief History Of Poverty In Britain". A World History Encyclopedia. Retrieved 2 April 2018.
- "History Poverty". Bitesize. Retrieved 2 April 2018.
- Social Services: Made Simple (1990) by Tony Byrne, BA, BSc(Econ.), and Colin F. Padfield, LLB, DPA(Lond)
- Poverty: The Forgotten Englishmen (1983) by Ken Coates and Richard Silburn
- Labour and inequality: sixteen fabian essays (1966) edited by Peter Townsend and Nicholas Bosanquet
- Speak for Britain! A New History of the Labour Party by Martin Pugh
- Socially Deprived Families in Britain edited by Robert Holman, reprinted edition 1971, first published in 1970
- Responses to poverty: lessons from Europe by Robert Walker, Roger Lawson, and Peter Townsend
- Townsend, Peter (1979). "18" (PDF). Poverty in the United Kingdom.
- Townsend, Peter (1979). "12" (PDF). Poverty in the United Kingdom.
-
Millar, Jane; Gardiner, Karen (2004). "Low pay, household resources and poverty" (PDF). Joseph Rowntree Foundation. Archived from the original (PDF) on 6 December 2013. Retrieved 12 July 2013. Cite journal requires
|journal=(help) - Industrial Relations: A Marxist Introduction by Richard Hyman
- Poverty and Inequality in Common Market Countries edited by Victor George and Roger Lawson
- Consensus and conflict: essays in political sociology by Seymour Martin Lipset
- Social Welfare and the Failure of the State: Centralised Social Services and Participatory Alternatives by Roger Hadley and Stephen Hatch
- Childhood poverty and social exclusion: from a child's perspective by Tess Ridge
- Irwin, John (1996). Modern Britain: An Economic and Social History. Routledge. ISBN 9780203138199.
- British Economic And Social Policy: Lloyd George to Margaret Thatcher by GC Peden
- "Archived copy" (PDF). Archived from the original (PDF) on 16 October 2014. Retrieved 9 October 2014.CS1 maint: archived copy as title (link)
- Where There's Greed: Margaret Thatcher and the Betrayal of Britain's Future by Gordon Brown
- Britain in Close-Up by David McDowall
-
Lourie, Julia (17 January 1995). "A Minimum Wage" (PDF). House of Commons Library. Cite journal requires
|journal=(help) - "UK: State benefit levels - The Poverty Site". Poverty.org.uk. Retrieved 3 December 2013.
- National Minimum Wage, Low Pay Commission Report 2006 (PDF). HMSO. Archived from the original (PDF) on 26 June 2013.
- "UK: numbers in low income - The Poverty Site". Poverty.org.uk. Retrieved 3 December 2013.
- The Government's Public Health White Paper (Cm 6374): Written Evidence -. Great Britain: Parliament: House of Commons: Health Committee. 16 November 2004. ISBN 9780215025067.
- Lang, Tim; Heasman, Michael (2004). Food Wars: The Global Battle for Mouths, Minds and Markets. Earthscan. ISBN 9781853837012.
- Hood, Andrew; Joyce, Robert; Belfield, Chris; Cribb, Jonathan (2015). Living standards, poverty and inequality in the UK: 2015. doi:10.1920/re.ifs.2015.0107. ISBN 978-1-909463-95-0.
- Inflation could push 4m more Britons below poverty line, study finds The Guardian
- Britain’s socially excluded ‘10 times more likely to die early’ The Observer
- Welfare shakeup 'will push a quarter of a million children into poverty', The Guardian
- Benefit changes 'could push 200,000 children into poverty', BBC
- Levels of child hunger and deprivation in UK among highest of rich nations, The Guardian
- Poverty 'driving people to choose between eating or keeping clean', The Guardian
- National minimum wage rise still fails to cover living costs, study shows The Guardian
- Child poverty: Pale and hungry pupils 'fill pockets with school food', BBC
- Poor children being 'fed diluted milk', report finds, BBC
- "People at risk of poverty after social transfers". Eurostat.
- A third of UK lives on inadequate income, says think tank BBC
- "IFS poverty forecasts: Budget needs to support families on a precipice". Joseph Rowntree Foundation.
- Rural deprivation and ill-health in England 'in danger of being overlooked', The Guardian
- Record levels of poverty in working families BBC
- Child poverty in UK at highest level since 2010, official figures show The Guardian
- "Unpaid Britain". Trust for London. Retrieved 7 June 2018.
- Poorest UK families struggle to put food on the table, survey finds The Guardian
- Poor working families face big losses from benefit cuts, says IFS The Guardian
- Is work "fair and decent"? That's not how the voters see it BBC
- One in eight workers struggle to afford food, finds TUC survey The Guardian
- Two million UK families face £50-a-week cut in income The Guardian
- Homelessness rise 'likely to have been driven by welfare reforms' BBC
- Housing crisis drives more than 1m private tenants deeper into poverty The Observer
- School holidays leave 3 million children at risk of hunger, report says The Guardian
- Action urged on school holiday hunger BBC
- Election 2017: What if I can't afford to pay the rent? BBC
- 100 tenants a day lose homes as rising rents and benefit freeze hit The Guardian
- UK government warned over sharp rise in child and pensioner poverty The Guardian
- Millions of families on brink face deepest benefit cuts in years The Observer
- "Unhelpful and Unfair? The impact of single parent sanctions". Trust for London. Retrieved 7 June 2018.
- Poorest families 'going without food or power' BBC
- A million more UK children in poverty than in 2010 – study The Guardian
- Staff in cash-strapped schools pay for food, toilet roll and tampons for pupils amid cuts, survey finds The Independent
- Philip Hammond urged to use budget to help low-income families The Guardian
- New study finds 4.5 million UK children living in poverty The Guardian
- More than a million UK residents live in 'food deserts', says study The Guardian
- Austerity policy blamed for record numbers of children taken into care The Guardian
- Benefits freeze leaves a third of claimants 'with £100 to live on a month' The Guardian
- Childhood pneumonia cases up 50% in 10 years, NHS data shows The Guardian
- Disabled people 'pulled into poverty' as benefits fall short BBC
- Health inequality greater than previously thought, report finds The Guardian
- (OECD) Society at a Glance 2014
- The Verdict: Did Labour Change Britain? By Polly Toynbee and David Walker
- "What is it like to be 'just about managing'?". BBC News. 22 November 2016.
- "Just about managing". Citizens Advice. 22 November 2016. Retrieved 13 April 2019. (Report)
- Autumn Statement: Workers' pay growth prospects dreadful, says IFS BBC
- Biggest rise in UK poverty since Margaret Thatcher was in power, experts claim The Independent
- editor, Patrick Butler Social policy (15 July 2015). "Majority of poor children live in working families, IFS study finds" – via The Guardian.CS1 maint: extra text: authors list (link)
- "More poor children in UK working families, says IFS". 16 July 2015 – via www.bbc.co.uk.
- Four million British workers live in poverty, charity says The Guardian
- "Statement on the repeal the Child Poverty Act".
- Shelter: More than four in 10 people face homes which fail acceptable standards BBC
- Loopstra, R; Reeves, A; Taylor-Robinson, D; Barr, B; McKee, M; Stuckler, D (2015). "Austerity, sanctions, and the rise of food banks in the UK" (PDF). BMJ. 350: h1775. doi:10.1136/bmj.h1775. hdl:10044/1/57549. PMID 25854525.
- More than 2.3m families living in fuel poverty in England, The Guardian
- Emanuele Ferragina, Mark Tomlinson and Robert Walker (28 May 2013). "Poverty, Participation and Choice". Joseph Rowntree Foundation. Retrieved 13 April 2019.
- Strong link between disadvantage and suicide says Samaritans, The Guardian
- UK faces return to inequality of Thatcher years, says report The Guardian
- "Persistent Poverty in the UK and EU - Office for National Statistics". www.ons.gov.uk. Retrieved 28 November 2016.
- "Welsh Government | Poverty & Wealth". gov.wales. Retrieved 28 November 2016.
- Defty, Andrew (1 January 2011). "The Conservatives, social policy and public opinion". The Conservative Party and social policy. Policy Press at the University of Bristol. pp. 61–76. ISBN 9781847424334. JSTOR j.ctt9qgwb8.8.
- "London's Poverty Profile 2017". Trust for London. Retrieved 8 February 2018.
- "Minimum Income Standard London 2017". Trust for London. Retrieved 8 February 2018.
- Poverty and Progress In Britain 1953-1973, G.C. Fiegehen, P.S. Lansley, and A.D. Smith, with a contribution by N.C. Garganas. (C.U.P. 1977)
- "Social Metrics Commission launches a new measure of UK poverty". Social Metrics Commission. 17 September 2018. Retrieved 1 February 2019.
- The Welfare State in Britain since 1945 by Rodney Lowe
- Townsend, Ian; Kennedy, Steven (4 March 2004). "Poverty: Measures and Targets" (PDF). Research Report 04/23. House of Commons Library. Cite journal requires
|journal=(help) - "How low income is measured in households below average income - GOV.UK". www.gov.uk. Retrieved 10 January 2017.
- "Households below average income: 1994/95 to 2014/15 - Publications - GOV.UK". www.gov.uk. Retrieved 9 January 2017.
- Winnett, Robert (1 December 2011). "Feckless parents would only spend extra benefits on themselves, says Iain Duncan Smith". The Daily Telegraph. London.
- "Consensual method | Poverty and Social Exclusion". www.poverty.ac.uk. Retrieved 16 January 2017.
- Mack, Joanna. "Attitudes to necessities in the PSE 2012 survey: are minimum standards becoming less generous?" (PDF). p. 8. Retrieved 16 January 2017.
- https://socialmetricscommission.org.uk/MEASURING-POVERTY-FULL_REPORT.pdf
- "The Social Metrics Commission Voluntarily Adopts the Code of Practice for Statistics". UK Statistics Authority. 15 February 2019.
- "Government to overhaul measures of poverty by 2020". The Guardian. 18 May 2019.
- "Social Metrics Commission 2019 Report". Social Metrics Commission. 29 July 2019.
- "Water and Sewerage Charges (Limit on Household Expenditure)". They Work For You. 15 March 2006. Retrieved 3 December 2012.
- "Fuel Poverty". They Work For You. 18 October 2006. Retrieved 3 December 2013.
- "Raising awareness of fuel poverty". BBC website. 24 November 2006. Retrieved 3 December 2013.
- Association, Press (8 January 2015). "More than a million working households are in fuel poverty" – via The Guardian.
- "Key Facts". Poverty.org.uk. Archived from the original on 12 December 2006.
- Hunt, Earl (July 1995). "The Role of Intelligence in Modern Society (July-Aug, 1995)". American Scientist. pp. 4 (Nonlinearities in Intelligence). Archived from the original on 21 May 2006.
- Heath, A. and Cheung, S. Y. (2006) Ethnic penalties in the labour market: Employers and discrimination. DWP Research Report No. 341. Leeds: Corporate Document Services.
- Tackey, Nii Djan (2006). "Barriers to employment for Pakistanis and Bangladeshis in Britain and constraints". et al. Archived from the original on 28 January 2013.
- Knight, Julian (1 August 2005). "First-time buyers on poverty 'knife-edge'". BBC News. Retrieved 3 December 2013.
- Easton, Mark (2 May 2006). "Britain's happiness in decline". BBC News. Retrieved 3 December 2013.
- "Wealth warning". The Guardian. 5 June 2005. Retrieved 3 December 2013.
- "A history of milestones, information on historical measurements of poverty". BBC News. Retrieved 3 December 2013.
- "Measures of National Well-being Dashboard - Office for National Statistics". www.ons.gov.uk. Retrieved 30 November 2018.
- Reducing Poverty in the UK: A Collection of Evidence Reviews. Joseph Rowntree Foundation. 2014. ISBN 978-1-90958-630-7.
- Taylor-Goobey, Peter; Larsen, Trine; Kananen, Johannes. "Market Means and Welfare Ends: The UK Welfare State Experiment" (PDF). www.cambridge.org. Cambridge University Press.
- Dixon, John; Scheurell, Robert. P (1989). Social Welfare in Developed Market Countries. Routledge. ISBN 978-1-138-94701-6.
- "Persistent Poverty in the UK and EU - Office for National Statistics". www.ons.gov.uk. Retrieved 2 December 2016.
- McGuinness, Feargal. "Poverty in the UK: statistics". Cite journal requires
|journal=(help) - Cribb, Jonathan; Belfield, Chris; Joyce, Robert; Hood, Andrew (2016). Living standards, poverty and inequality in the UK: 2016. doi:10.1920/re.ifs.2016.0117. ISBN 978-1-911102-17-5.
- Collin, Chantal (2007). Poverty Reduction Strategies in the United Kingdom and Ireland. Library of Parliament.
- "2010 to 2015 government policy: poverty and social justice - GOV.UK". www.gov.uk. Retrieved 2 December 2016.
- worldwide charitable foundation mission database
- "2015 POLITICAL MANIFESTO POVERTY AUDIT" (PDF). Retrieved 24 April 2017.
- "What is Labour doing for… families and children?". Archived from the original on 26 September 2006.
- "Labour Party manifesto" (PDF). 2005. Archived from the original (PDF) on 11 December 2006.
- Branigan, Tania (22 November 2006). "Cameron told: it's time to ditch Churchill". The Guardian. London.
- "Toynbee not Churchill, Tory says". BBC News. 22 November 2006.
- Assinder, Nick (22 November 2006). "From Churchill to Toynbee?". BBC News. Retrieved 3 December 2013., Toynbee, Polly (22 November 2006). "Leaves out of my book". The Guardian. Retrieved 3 December 2013., "Rightwing Tories support Toynbee approach". The Guardian. 22 November 2006. Retrieved 3 December 2013., "Churchill out, Toynbee in". The Guardian. 22 November 2006. Retrieved 3 December 2013., "Times editorial".
- Mulholland, Helene (24 November 2006). "Cameron: poverty is a 'moral disgrace'". The Guardian. London.
- "Poverty in the UK". Oxfam GB.
- The Poverty Barrier
Key sources and external links
Government statistics
- The UK Government's Department of Work and Pensions makes a yearly collection of Households below average income (HBAI) statistics, and has been doing so since 1994–5. The report for 2014-5 includes data and summary the overall income distribution, income equality, sources of income, low income indicators, and data on the relationship between poverty and children, age, pensioners and disability. The Department for Work and Pensions (official site) is responsible for policy relating to social welfare and tends to take the lead in addressing or contributing to poverty
- Government reports
- "Measuring Child Poverty" (PDF). Department for Work and Pensions. December 2003. Archived from the original (PDF) on 6 June 2014.
- "Understanding older people's experiences of poverty and material deprivation" (PDF). DWP. July 2006. Archived from the original (PDF) on 5 June 2009.
Other sources of reports and analysis
- UK Poverty 2017, The Joseph Rowntree Foundation - This report examines poverty rates in the UK, and looks at how figures have changed over the past two decades.
- One hundred years of poverty and policy by Howard Glennerster, John Hills, and David Piachaud and Jo Webb - The Joseph Rowntree Foundation. Contains information on historical trends in poverty and anti-poverty legislation
- Government debates (most recent first)
- Child poverty debate - Westminster Hall, 4 July 2006.
- Poverty debate - House of Lords, 6 February 2002.
- Student poverty debate - House of Lords, 15 March 2001.
- Child poverty
- Child poverty, The Joseph Rowntree Foundation
- Number and percentage of children living in poverty, in each year, 1979-2004.
- Number and percentage of children living in poverty, in each year, 1979-2004 before and after housing costs.
- Percentage of children living in poverty in working or workless households, 2003-04.
- Proportion of children in families with (a) a lone parent, (b) married parents or stepparents and (c) cohabiting parents or stepparents in poverty, 2004-05.
- Number and percentage of children living in poverty, 1997-2004.
- Northern Ireland: children living in the province estimated to be living in poverty, broken down by (a) Northern Ireland local government district and (b) parliamentary constituency, 2002/04.
- Working-age poverty
- Pensioner poverty
- Pensioner poverty, Joseph Rowntree Foundation
- Number and percentage of pensioners living in poverty from 1979-2004.
- Pensioners in poverty 1994-2003, broken down by region.
- Rural poverty
- Mixed
- Percentage of children and adults living in poverty both before and after housing costs from 1995-2005.
- Poverty among (a) pensioners, (b) the unemployed, (c) disabled and (d) others in 1996/97 and 2003/04.
- Miscellaneous
- JRF's What is poverty? page
- The average weekly income for a) the lowest earning 40% and b) the highest earning 40% in England as a whole and the South West in particular for 1996/97-1998/99 and 2002/03-2004/05.
- Contains estimates on trends in poverty and inequality in the United Kingdom from 1960 onwards
- Contains estimates on trends in poverty and inequality in the United Kingdom from 1961 onwards
- Contains estimates on the proportion of the population living in poverty from 1961 to 1995
General news items
- Breadline Britain - the welfare state 60 years on - BBC News, 2006.
- Social Exclusion - The Guardian, updated regularly.
- Smoking Poverty in the UK - Shout Out UK, 2019
United Kingdom articles | |||||||||||||||
|---|---|---|---|---|---|---|---|---|---|---|---|---|---|---|---|
| History |
|  | |||||||||||||
| Geography |
| ||||||||||||||
| Politics |
| ||||||||||||||
| Economy | |||||||||||||||
| Society |
| ||||||||||||||
| |||||||||||||||
