Jewish population by country
As of 2018, the world's "core" Jewish population, those identifying as Jews above all else, was 14.6 million. The "connected" Jewish population, including those who say they are partly Jewish or that have Jewish background from at least a single Jewish parent, in addition to the core Jewish population, was 17.8 million. The "enlarged" Jewish population, including those who say they have Jewish background but not a Jewish parent, and all non-Jewish household members who live in households with Jews, in addition to the Jewish connected population, was 20.7 million. The Law of Return Jewish population, which counts all those eligible for immigration to Israel under its Law of Return, was 23.5 million. [1][2][3][4][5]
|
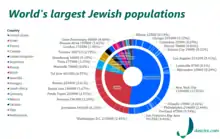
Jews and those of sufficient Jewish descent to be eligible for Israeli citizenship under the Law of Return by country in proportion to the general population (per million people, 2018) |
Jewish population by country (1,000s, 2018) | ||||||||||||||||||||||||||||||||||||||||||||||||||||||||||||||||||||||||||||||||||||||||||||||||||||||||||||||||||||||||||||||||||||||||||||||||||||||||||||||||||||||||||||||||||||||||||||||||||||||||||||||||||||||||||||||||||||||||||||||||||||||||||||||||||||||||||||||||||||||
| Part of a series on |
| Jews and Judaism |
|---|
 |
|
Two countries, the United States (51%), and Israel (30%), including the West Bank (2%), account for 81% of those recognised as Jews or of sufficient Jewish ancestry to be eligible for citizenship in Israel under its Law of Return. France (3%), Canada (3%), Russia (3%), the United Kingdom (2%), Argentina (1%), Germany (1%), Ukraine (1%), Brazil (1%), Australia (1%) and Hungary (1%) hold an additional 16%, and the remaining 3% are spread around 98 other countries and territories with less than 0.5% each. With nearly 6.5 million Jews,[6] Israel is the only Jewish-majority and explicitly Jewish state.
In 1939, the core Jewish population reached its historical peak of 17 million. Due to the Holocaust, the number was reduced to 11 million by 1945.[7][8][9] The population grew to around 13 million by the 1970s and then recorded near-zero growth until around 2005, due to low fertility rates and to assimilation.[8] From 2005 to 2018, the world's Jewish population grew on average 0.63% annually (while world population grew 1.1% annually in the same period).[1] This increase primarily reflected the rapid growth of Haredi and some Orthodox sectors, who are becoming a growing proportion of Jews.[10]
Recent trends
Recent Jewish population dynamics are characterized by continued steady increase in the Israeli Jewish population and flat or declining numbers in other countries (the diaspora). The Jewish population of Israel increased from 630,000 at the country's inception in 1948 to 6,135,000 in 2014,[11] while the population of the diaspora has dropped from 10.5 to 8.1 million over the same period.[4] Current Israeli Jewish demographics are characterized by a relatively high fertility rate of 3 children per woman and a stable age distribution.[12] The overall growth rate of Jews in Israel is 1.7% annually.[13] The diaspora countries, by contrast, have low Jewish birth rates, an increasingly elderly age composition, and a negative balance of people leaving Judaism versus those joining.[4]
Immigration trends also favour Israel ahead of diaspora countries. The Jewish state has a positive immigration balance (called aliyah in Hebrew). Israel saw its Jewish numbers significantly buoyed by a million-strong wave of Jewish immigrants from the former Soviet Union in the 1990s,[14] and immigration growth has been steady (in the low tens of thousands) since then.[15] In the rest of the world, only the United States, Canada, Australia, and Germany have had a positive recent Jewish migration balance outside of Israel. In general, the modern English-speaking world has seen an increase in its share of the diaspora since the Holocaust and the foundation of Israel, while historic diaspora Jewish populations in Eastern Europe, North Africa, and the Middle East have significantly declined or disappeared.[16]
France continues to be home to the world's third largest Jewish community, at around 500,000,[17][18] but has shown an increasingly negative trend. As a long term tend, intermarriage has reduced its "core" Jewish population and increased its "connected" and "enlarged" Jewish populations. More recently, migration loss to Israel amongst French Jews reached the tens of thousands between 2014 and 2017, following a wave of anti-Semitic attacks.[19][20]
According to a 2017 Pew Research Center survey, between 2010 and 2015 "an estimated one million babies were born to Jewish mothers and roughly 600,000 Jewish died, meaning that the natural increase in the Jewish population – i.e., the number of births minus the number of deaths – was 500,000 million over this period".[21] According to the same study, over the next four decades the number of Jews around the world is expected to increase from 14.2 million in 2015 to 16.3 million in 2060.[22]
Debate over United States numbers
The number of Jews in the United States has been the subject of much debate because of questions over counting methodology. In 2012, Sheskin and Dashefsky put forward a figure of 6.72 million based on a mixture of local surveys, informed local estimates, and US census data. They qualified their estimate with a concern over double counting and suggested the real figure may lie between 6 and 6.4 million.[23] Drawing on their work, the Steinhardt Social Research Institute released their own estimate of 6.8 million Jews in the United States in 2013.[24] These figures are in contrast to Israeli demographer Sergio Della Pergola's number of 5,425,000, also in 2012.[25] He has called high estimates “implausible” and “unreliable” although he revised the United States Jewish number upward to 5.7 million in subsequent years.[26][25] This controversy followed a similar debate in 2001 when the National Jewish Population Survey released a United States Jewish estimate as low as 5.2 million only to have serious methodological errors suggested in their survey.[25] In sum, a confidence interval of a million or more people is likely to persist in reporting on the number of Jewish Americans.
By country
Below is a list of Jewish populations in the world by country. All data below, but the last column, is from the Berman Jewish DataBank at Stanford University in the World Jewish Population (2018) report coordinated by Sergio DellaPergola at the Hebrew University of Jerusalem.[27] The Jewish DataBank figures are primarily based on national censuses combined with trend analysis. "Core" Jewish population refers to those who consider themselves Jews to the exclusion of all else. The "connected" Jewish population, in addition to the core Jewish population, includes those who say they are partly Jewish or that have Jewish background from at least one Jewish parent. The "enlarged" Jewish population includes the Jewish connected population and those who say they have Jewish background but not a Jewish parent, and all non-Jews living in households with Jews. The Law of Return Jewish population includes all those eligible to immigration to Israel under its Law of Return. Note that the results below may not be entirely accurate, as other sources may have conflicting accounts of Jewish populations in certain countries.
Table
|
| ||||||||||||||||||||||||||||||||||||||||||||||||||||||||||||||||||||||||||||||||||||||||||||||||||||||||||||||||||||||||||||||||||||||||||||||||||||||||||||||||||||||||||||||||||||||||||||||||||||||||||||||||||||||||||||||||||||||||||||||||||||||||||||||||||||||||||||||||||||||||||||||||||||||||||||||||||||||||||||||||||||||||||||||||||||||||||||||||||||||||||||||||||||||||||||||||||||||||||||||||||||||||||||||||||||||||||||||||||||||||||||||||||||||||||||||||||||||||||||||||||||||||||||||||||||||||||||||||||||||||||||||||||||||||||||||||||||||||||||||||||||||||||||||||||||||||||||||||||||||||||||||||||||||||||||||||||||||||||||||||||||||||||||||||||||||||||||||||||||||||||||||||||||||||||||||||||||||||||||||||||||||||||||||||||||||||||||||||||||||||||||||||||||||||||||||||||||||||||||||||||||||||||||||||||||||||||||||||||||||||||||||||||||||||||||||||||||||||||||||||||||||||||||||||||||||||||||||||||||||||||||||||||||||||||||||||||||||||||||||||||||||||||||||||||||||||||||||||||||||
- Including East Jerusalem and the Golan Heights, not including the West Bank.
- Figures includes France and Monaco. See: History of the Jews in France and History of the Jews in Monaco.
- West Bank total population (without East Jerusalem): 2,548,700; Gaza: 1,839,900; Total: 4,388,600. The West Bank also includes 404,600 Jews and 8,600 non-Jewish members of Jewish households, for a total of 413,200 Jews and others. The Jewish population of the West Bank consists of Israeli citizens living in Israeli settlements who are treated as residents of Israel under Israeli law. The reported West Bank total of 2,961,900 includes Palestinian, Jewish and other residents.
- Including the Channel Islands and the Isle of Man.
- Figures include mainland China and Hong Kong SAR. See: History of the Jews in China and History of the Jews in Hong Kong.
- Includes Lebanon.
Remnant and vanished populations
The above table represents Jews that number at least a few dozen per country. Reports exist of Jewish communities remaining in other territories in the low single digits that are on the verge of disappearing, particularly in the Muslim world, as their reaction to the birth of Israel in 1948 was the persecution of Jews in nearly all Muslim lands; these are often of historical interest as they represent the remnant of much larger Jewish populations. For example, Egypt had a Jewish community of 80,000 in the early 20th century that numbered fewer than 40 as of 2014, mainly because of the forced expulsion movements to Israel and other countries at that time.[64] Afghanistan may have only one Jew left, Zablon Simintov, despite a 2,000 year history of Jewish presence.[65] In Syria, another ancient Jewish community saw mass exodus at the end of the 20th century and numbered fewer than 20 in the midst of the Syrian Civil War.[66] The size of the Jewish community in Indonesia has been variously given as 65, 100, or 18 at most over the last 50 years.[67][68]
Major Jewish population centers worldwide
Jewish population by city
Censuses in many countries do not record religious or ethnic background, leading to a lack of certainty on the exact numbers of Jewish population.
Jewish population by towns and villages as a percentage of total population
List does not include cities in Israel.
See also
Notes
References
- DellaPergola, Sergio (2019), "World Jewish Population, 2018", in Dashefsky, Arnold; Sheskin, Ira M. (eds.), American Jewish Year Book 2018, American Jewish Year Book, 118, Springer International Publishing, pp. 361–449, doi:10.1007/978-3-030-03907-3_8, ISBN 9783030039066
- DellaPergola, Sergio (2018), "World Jewish Population, 2017", in Dashefsky, Arnold; Sheskin, Ira M. (eds.), American Jewish Year Book 2017, American Jewish Year Book, 117, Springer International Publishing, pp. 297–377, doi:10.1007/978-3-319-70663-4_7, ISBN 9783319706627
- DellaPergola, Sergio (2017), "World Jewish Population, 2016", in Dashefsky, Arnold; Sheskin, Ira M. (eds.), American Jewish Year Book 2016, American Jewish Year Book, 116, Springer International Publishing, pp. 253–332, doi:10.1007/978-3-319-46122-9_17, ISBN 9783319461212
- DellaPergola, Sergio (2016), "World Jewish Population, 2015", in Dashefsky, Arnold; Sheskin, Ira M. (eds.), American Jewish Year Book 2015, American Jewish Year Book, 115, Springer International Publishing, pp. 273–364, doi:10.1007/978-3-319-24505-8_7, ISBN 9783319245034
- DellaPergola, Sergio (2015), "World Jewish Population, 2014", in Dashefsky, Arnold; Sheskin, Ira (eds.), American Jewish Year Book 2014, American Jewish Year Book, 114, Springer International Publishing, pp. 301–393, doi:10.1007/978-3-319-09623-0_19, ISBN 9783319096223
- "Israel's Population Crosses 9 Million Mark!". United With Israel. Retrieved 12 May 2019.
- "World Jewish Population - Latest Statistics". Retrieved 14 February 2015.
- "The continuing decline of Europe's Jewish population". 9 February 2015.
- "Chart: The decline of Europe's Jewish population". Washington Post.
- "Haredi Orthodox account for bulk of Jewish population growth in New York City - Nation". Jewish Journal. 22 January 2013. Retrieved 14 February 2015.
- Yaakov Levi. "Israel Population Now 8.3 Million - 75% Are Jewish". Israel National News. Retrieved 6 September 2014.
- "Fertility Rates, by Age and Religion". Statistical Abstract of Israel. Israel Central Bureau of Statistics. 11 September 2012. Retrieved 6 September 2013.
- "Data: Arab Growth Slows, Still Higher than Jewish Rate". Israel National News. Retrieved 6 September 2014.
- Post-Soviet Aliyah and Jewish Demographic Transformation - Mark Tolts.
- "Immigration to Israel by Year". Jewish Virtual Library. Retrieved 6 September 2014.
- "Demography". Jewish Virtual Library. Retrieved 6 September 2014.
- European Jewish Congress. "The Jewish Community of France". Retrieved 29 September 2017.
- "La communauté juive de France compte 550.000 personnes, dont 25.000 à Toulouse". France info. 19 March 2012. Retrieved 14 February 2015.
- "France tops list for Jewish emigration to Israel". RFI. 6 September 2014. Retrieved 6 September 2014.
- "Why 5,000 Jews emigrated from France to Israel last year". The Local Europe AB. 9 January 2017. Retrieved 29 September 2017.
- The Changing Global Religious Landscape: Babies born to Muslims will begin to outnumber Christian births by 2035; people with no religion face a birth dearth
- The Changing Global Religious Landscape: Babies born to Muslims will begin to outnumber Christian births by 2035; people with no religion face a birth dearth
- Sheskin, Ira; Dashefsky, Arnold (2 November 2012). Dashefsky, Arnold; Sheskin, Ira (eds.). "Jewish Population in the United States, 2012" (PDF). Current Jewish Population Reports. Storrs, Connecticut: North American Jewish Data Bank. Retrieved 6 September 2014.
- Tighe, Elizabeth; et al. (September 2013). "American Jewish Population Estimates: 2012" (PDF). Brandeis University: Steinhardt Social Research Institute. Retrieved 6 September 2014.
- "US Jewish Population is Anywhere Between 5.425 Million and 6.722 Million". Jewish Political News and Updates. 18 February 2013. Archived from the original on 21 October 2013. Retrieved 6 September 2014.
- DellaPergola, Sergio (2016). Dashefsky, Arnold; Sheskin, Ira (eds.). "World Jewish Population, 2016". Current Jewish Population Reports. The American Jewish Year Book (Dordrecht: Springer). 116. Retrieved 29 September 2017.
- DellaPergola, Sergio (2018). "World Jewish Population, 2018" (PDF). In Dashefsky, Arnold; Sheskin, Ira M. (eds.). The American Jewish Year Book, 2018. American Jewish Year Book. 118. Dordrecht: Springer. pp. 361–452. ISBN 9783030039066.
- Bureau, US Census. "Section 1. Population". www.census.gov. Retrieved 30 September 2019.
- "Data tables, 2016 Census". Statistics of Canada. 25 October 2017. Retrieved 10 December 2018.
- "DC2107EW - Religion by sex by age". Nomis - official labour market statistics.
- "Scotland's Census 2011 - National Records of Scotland" (PDF). Retrieved 10 December 2018.
- "'I've undertaken three Jewish heritage walks in Northern Ireland and 200 people from all sections of wider society took part. One of them told me it was a pleasure to do something in Belfast which related to neither Protestant or Catholic history...'". Belfast Telegraph. 3 December 2018. Retrieved 10 December 2018.
- "Приложение 2. Национальный состав населения по субъектам Российской Федерации". Retrieved 10 December 2018.
- "Population by religion, sex and urban/rural residence". Retrieved 10 December 2018.
- "Personen nach Religion (ausführlich) für Deutschland". Retrieved 10 December 2018.
- "The Jews of South Africa in 2019" (PDF). Retrieved 18 August 2020.
- "The distribution of the population by nationality and mother tongue". Statistics of Ukraine. Retrieved 10 December 2018.
- "De religieuze kaart van Nederland, 2010–2015" (in Dutch). Retrieved 11 December 2018.
- "Национальный статистический комитет Республики Беларусь" (PDF). Archived from the original (PDF) on 18 October 2013. Retrieved 10 December 2018.
- "Population by national and/or ethnic group, sex and urban/rural residence". Retrieved 10 December 2018.
- "Cuadro 8. Autodefinición en materia religiosa (GIS XXI, 2011)" (PDF). p. 216. Retrieved 10 December 2018.
- "Jewish community in Venezue... JPost - Jewish World - Jewish News". archive.is. 5 September 2012. Archived from the original on 5 September 2012. Retrieved 25 September 2019.
- "For India's Jewish Community, Wait for Minority Status Continues". 28 July 2017. Retrieved 10 December 2018.
- "Latvijas iedzīvotāju sadalījums pēc nacionālā sastāva un valstiskās piederības (Datums=01.07.2019)" (PDF) (in Latvian). Retrieved 8 August 2019.
- "WJC - Czechia". Retrieved 10 December 2018.
- "Всесоюзная перепись населения 1989 года. Национальный состав населения по республикам СССР". Demoscope.ru. Retrieved 10 December 2018.
- "Tabl. 4.2. Ludność według rodzaju i kolejności identyfikacji narodowo-etnicznych w 2011 roku" (PDF). Statistics of Poland. p. 91. Retrieved 10 December 2018.
- "Bilancia podľa národnosti a pohlavia - SR-oblasť-kraj-okres, m-v [om7002rr]" (in Slovak). Statistics of Slovakia. Retrieved 31 July 2019.
- "Етнически малцинствени общности | NCCEDI". nccedi.government.bg (in Bulgarian).
- "Ethnic composition: 2019 estimation". Retrieved 1 January 2020.
- "EY036: Actual and Percentage Change in Population Usually Resident and Present 2011 to 2016 by Sex, Religion, CensusYear and Statistic". Retrieved 10 December 2018.
- "016 -- Population by religious community, age and sex in 2000 to 2017". Statistics of Finland. Retrieved 10 December 2018.
- "Members of religious and life stance communities outside the Church of Norway, by religion/life stance. Per 1 January1". Retrieved 16 March 2020.
- "1. Stanovništvo prema etničkoj/nacionalnoj pripadnosti - detaljna klasifikacija". Retrieved 10 December 2018.
- 5.01.00.03 Национальный состав населения. [5.01.00.03 Total population by nationality] (XLS). Bureau of Statistics of Kyrgyzstan (in Russian, Kyrgyz, and English). 2018.
- "Definitieve Resultaten Achtste Algemene Volkstelling (Vol. I)" (PDF). p. 39. Archived from the original (PDF) on 24 September 2015. Retrieved 10 December 2018.
- "Archived copy" Итоги всеобщей переписи населения Туркменистана по национальному составу в 1995 году.. asgabat.net (in Russian). asgabat.net. Archived from the original on 13 March 2013. Retrieved 31 July 2012.CS1 maint: archived copy as title (link)
- "ԱԶԳԱՅԻՆ ՓՈՔՐԱՄԱՍՆՈՒԹՅՈՒՆՆԵՐԸ ՀԱՅԱՍՏԱՆՈՒ". Archived from the original on 10 October 2017. Retrieved 31 July 2018.
- "T-03.01.3: Население според припадноста кон етничка заедница, по пописи" (PDF). p. 71. Retrieved 10 December 2018.
- "Table A9: Population by Religion, Sex and Residence" (PDF). p. 73. Retrieved 17 January 2019.
- Национальный состав, владение языками и гражданство населения Республики Таджикистан Том III (PDF) (in Russian and Tajik). Retrieved 10 December 2018.
- "CS 10.1.2 Population by religious faith, educational attainment, occupation, country of birth, year of arrival in the country and place of usual residence". Archived from the original on 2 October 2015. Retrieved 10 December 2018.
- "Wohnbevölkerung nach Religion und Herkunft, 1990 - 2000". Retrieved 17 January 2019.
- "Egypt's Jewish community buries deputy leader". Al Jazeera. 12 March 2014. Retrieved 17 July 2015.
- Donati, Jessica; Harooni, Mirwais (12 November 2013). "Last Jew in Afghanistan faces ruin as kebabs fail to sell". Reuters. Retrieved 17 July 2015.
- "Syria". Jewish Virtual Library. Retrieved 17 July 2015.
- CIA World Fact Book
- Levenda 2007, pp. 188.
- Kravitz, Derek (1 October 2013). "New York City Area's Jewish Population Rises". The Wall Street Journal. Retrieved 7 March 2019.
- "הלשכה המרכזית לסטטיסטיקה - מקורות גידול האוכלוסייה, לפי צורת יישוב, קבוצת אוכלוסייה ודת - 2017
(ISRAEL CENTRAL BUREAU OF STATISTICS - SOURCES OF POPULATION GROWTH, BY TYPE OF LOCALITY, POPULATION GROUP AND RELIGION - 2017)". Retrieved 25 October 2018. - "Jewish US population 2016" (PDF). Retrieved 25 October 2018.
- "Jewish world population 2016" (PDF). Retrieved 25 October 2018.
- "Basic Demographics of the Canadian Jewish Community". CIJA. Retrieved 6 August 2019.
- "יישובים וחלוקות גאוגרפיות אחרות". Retrieved 16 April 2020.
- "Russian Federation". European Jewish Congress. Retrieved 3 September 2014.
- "2011 Census: Key Statistics for England and Wales, March 2011". Office for National Statistics. 11 December 2012. Retrieved 20 May 2016.
- "Jewish Map of the United States - Comenetz 2011 - [North American Jewish Data Bank]". Jewishdatabank.org. Retrieved 13 April 2013.
- "The Virtual Jewish History Tour - Cleveland". Jewishvirtuallibrary.org. Retrieved 11 June 2012.
- "Demographic and Attitudinal Survey of the Jewish Population of Akron, 1975 - [North American Jewish Data Bank]". Jewishdatabank.org. Retrieved 11 June 2012.
- "The Demographic Study of the Jewish Population of Canton, Ohio, 1955 - [North American Jewish Data Bank]". Jewishdatabank.org. Retrieved 11 June 2012.
- "2007 Jewish Community Study Points to Growth, Diversity, Emerging Needs". Jewishcolorado.org. 22 January 2008. Retrieved 11 June 2012.
- "Population booms". Jewishaz.com. 6 December 2002. Retrieved 11 June 2012.
- Steve Friess, Chronicle Correspondent (5 April 2004). "Jewish settlers find Las Vegas to be a good bet / Their numbers have doubled in the past decade". Sfgate.com. Retrieved 11 June 2012.
- "Budapest, Hungary Jewish History Tour". www.jewishvirtuallibrary.org.
- "Brazil - Modern-Day Community". www.jewishvirtuallibrary.org/. 2013. Retrieved 22 December 2013.
- Headapohl, Jackie. "Metro Detroit – Jewish Population Snapshot". thejewishnews.com. Jewish Renaissance Media. Retrieved 3 August 2020.
- "France". World Jewish Congress. Retrieved 3 September 2014.
- "Archived copy". Archived from the original (PDF) on 21 November 2020. Retrieved 21 November 2020.CS1 maint: archived copy as title (link)
- "Seattle's Jewish Community Grew 70 Percent in Last 15 Years". Tablet. Retrieved 9 February 2015.
- "Best Places to Live in the United States". Bestplaces.net. Retrieved 11 June 2012.
- "2016 Census Community Profiles: Greater Melbourne". www.censusdata.abs.gov.au. Retrieved 7 February 2018.
- http://www.jewishdatabank.org/Studies/downloadFile.cfm?FileID=3016
- "Tampa Bay Map & Jewish Demographics". The Real Florida Jewish Directory. Retrieved 11 June 2012.
- "2016 Census Community Profiles: Greater Sydney". www.censusdata.abs.gov.au. Retrieved 7 February 2018.
- "History of the Jewish Community in South Africa". South African Jewish Board of Deputies. Retrieved 30 June 2015.
- "Best Places to Live in the United States". Bestplaces.net. Retrieved 11 June 2012.
- "How the Jewish Population of Portland, Ore., Doubled Overnight". tabletmag.com. Retrieved 7 February 2018.
- "Archived copy" (PDF). Archived from the original (PDF) on 29 December 2009. Retrieved 14 July 2009.CS1 maint: archived copy as title (link)
- "Brazil - International Religious Freedom Report 2009". www.state.gov/. 26 October 2009. Retrieved 22 December 2013.
- World Jewish Population
- "Best Places to Live in the United States". Bestplaces.net. Retrieved 11 June 2012.
- "Best Places to Live in the United States". Bestplaces.net. Retrieved 11 June 2012.
- Business Courier (11 September 2008). "Survey: Cincinnati Jewish population stable - Business Courier". Cincinnati.bizjournals.com. Retrieved 11 June 2012.
- "Statistics Canada - Community profiles - Vancouver Metropolitan Area". 2.statcan.ca. 12 March 2002. Retrieved 11 June 2012.
- "Revised community study finds fewer Milwaukee Jews | Wisconsin Jewish Chronicle". www.jewishchronicle.org.
- "JDC Programs Worldwide". American Jewish Joint Distribution Committee. 16 March 2005. Archived from the original on 28 March 2009. Retrieved 28 May 2015.
- "World Jewish Population | Latest Statistics". Simpletoremember.com. Retrieved 11 June 2012.
- "France". World Jewish Congress. Archived from the original on 23 October 2014. Retrieved 18 September 2020.
- https://www.allaboutturkey.com/jews.html
- "Best Places to Live in the United States". Bestplaces.net. Retrieved 11 June 2012.
- "The 2002 Tucson Jewish Community Study - [North American Jewish Data Bank]". Jewishdatabank.org. Retrieved 11 June 2012.
- "New York State". Jewishvirtuallibrary.org. Retrieved 11 June 2012.
- "Columbus". Jewishvirtuallibrary.org. Retrieved 11 June 2012.
- "2016 Census Community Profiles: Greater Perth". www.censusdata.abs.gov.au. Retrieved 7 February 2018.
- "Touring Montevideo's Jewish Quarter". Forward.com. 8 March 2011. Retrieved 28 May 2015.
- "Jewish culture, history and religion in Amsterdam". amsterdam.info. 8 March 2011. Retrieved 14 January 2016.
- "Kansas City". Jewishvirtuallibrary.org. 28 March 1908. Retrieved 11 June 2012.
- "Orlando Map & Jewish Demographics". The Real Florida Jewish Directory. Retrieved 11 June 2012.
- "A tour of Jewish Kiev". Jewishaz.com. 25 June 2004. Retrieved 11 June 2012.
- "Best Places to Live in the United States". Bestplaces.net. Retrieved 11 June 2012.
- "Virtual Jewish World: Strasbourg, France". Virtual Jewish World. Retrieved 21 September 2014.
- "About the Jewish Community « Cape Town Jewish Board of Deputies". www.capebod.org.za. Retrieved 2 August 2016.
- "Federação Israelita do Rio Grande do Sul". firgs.org.br. 2009. Archived from the original on 28 May 2009. Retrieved 25 December 2013.
- Archived 18 June 2010 at the Wayback Machine
- Kramer, Lauren (17 August 2017). "The Vibrant Jewish Community of Panama". cjnews.com. Retrieved 10 July 2019.
- "Rhode Island". Jewishvirtuallibrary.org. Retrieved 11 June 2012.
- "THE JEWISH COMMUNITY OF ITALY". www.eurojewcong.org. Archived from the original on 13 March 2013. Retrieved 14 March 2016.
- Population Report: More Jews Live in the U.S. than in Israel, University of Miami research report 10 October 2010.
- "Best Places to Live in the United States". Bestplaces.net. Retrieved 11 June 2012.
- "Richmond". Jewishvirtuallibrary.org. Retrieved 11 June 2012.
- "Albany". Jewishvirtuallibrary.org. Retrieved 29 October 2013.
- "US_Jewish_Population_2016 | j. the Jewish news weekly of Northern California" (PDF). Jweekly.com. 9 September 2005. Retrieved 11 June 2012.
- Jewish population in Munich
- "The 2015 Nashville and Middle Tennessee Jewish Community Study | Brandeis University". www.brandeis.edu. Retrieved 20 October 2020.
- "Mitglieder Zentralrat (mouseover landmarks)". www.zentralratdjuden.de. Retrieved 16 January 2015.
- "Indianapolis". Jewishvirtuallibrary.org. Retrieved 11 June 2012.
- "Judar i Sverige | Judiska museet".
- "Louisville". Jewishvirtuallibrary.org. Retrieved 12 April 2017.
- "Jewish Communities and Records UK". Retrieved 25 June 2014.
- "Jewish Community (Israelitische Kultusgemeinde)". Wien.gv.at. Retrieved 11 June 2012.
- Jewish demographic map Archived 16 November 2012 at the Wayback Machine (in German)
- "ISJL". www.isjl.org/alabama-birmingham-encyclopedia.html. Retrieved September 2017
- Ember, Melvin; Ember, Carol R.; Skoggard, Ian (30 November 2004). Encyclopedia of Diasporas: Immigrant and Refugee Cultures Around the World. Volume I: Overviews and Topics; Volume II: Diaspora Communities. Springer Science & Business Media. ISBN 9780306483219 – via Google Books.
- "El Paso". www.jewishvirtuallibrary.org.
- "Archived copy". Archived from the original on 31 May 2014. Retrieved 19 August 2014.CS1 maint: archived copy as title (link)
- Congress, World Jewish. "World Jewish Congress". www.worldjewishcongress.org.
- Ohio's Jewish Population, by the Jewish Federation of Columbus
- "Scottish Jewry is now 'below 6,000'". 7 October 2013 – via www.thejc.com.
- http://columbusjewishfederation.org/page.aspx?id=38432
- "Organization - Federation of Jewish Communities in Czech Republic". www.fzo.cz. Retrieved 7 February 2018.
- "Archived copy". Archived from the original on 24 December 2013. Retrieved 24 December 2013.CS1 maint: archived copy as title (link)
- Moldovan Census 2004
- "Population by ethnicity in censuses" (PDF). insse.ro. Retrieved 16 February 2018.
- "2016 Census Community Profiles: Greater Brisbane". www.censusdata.abs.gov.au. Retrieved 7 February 2018.
- "Censo Demográfico Brasileiro de 2000". 2000.
- "Turkey Virtual Jewish History Tour | Jewish Virtual Library". www.jewishvirtuallibrary.org. Retrieved 22 February 2016.
- "Population 1891 to 2016 by County, Religion, CensusYear and Statistic - StatBank - data and statistics". www.cso.ie.
- "Recife, Brazil". www.jewishvirtuallibrary.org. Retrieved 7 February 2018.
- "Helsingin juutalainen seurakunta |".
- "Montgomery's Jewish Community". Encyclopedia of Alabama. Retrieved 26 April 2015.
- "Tabela 2094: População residente por cor ou raça e religião". www.sidra.ibge.gov.br. Retrieved 7 February 2018.
- "World Jewish Congress website". www.worldjewishcongress.org. Retrieved 7 February 2018.
- "Luxner - Articles". www.luxner.com. Retrieved 7 February 2018.
- "La gaceta UdeG | La comunidad judía en Guadalajara". www.gaceta.udg.mx.
- https://www.slovakia.org/society-jews.htm
- Israelita, Tribuna. "LA COMUNIDAD ISRAELITA DE MONTERREY Ana Portnoy de Berner". www.tribuna.org.mx. Retrieved 7 February 2018.
- "It's an all-Jewish town, but no, it's not in Israel". 14 July 2011. Retrieved 30 January 2018.
- "Kiryas Joel is 'a holistic cradle-to-grave Jewish society'". 18 March 2013. Retrieved 14 May 2013.
- "2011 Greater Cleveland Jewish Population Study". 1 January 2011. Retrieved 1 July 2013.
- "Statistics Canada - Community profiles - Hampstead". 2.statcan.ca. 12 March 2002. Retrieved 11 June 2012.
- "Statistics Canada - Community profiles - Côte Saint-Luc". 2.statcan.ca. 12 March 2002. Retrieved 11 June 2012.
- "Lakewood CDP, New Jersey)". United States Census. Retrieved 25 April 2014.
- "Teaneck CDP, New Jersey)". United States Census. Retrieved 25 April 2014.
- Australian Bureau of Statistics (27 June 2017). "2016 Community Profiles: Postcode 3161, Victoria". 2016 Census of Population and Housing. Retrieved 27 June 2016.

- Australian Bureau of Statistics (27 June 2017). "2016 Community Profiles: Caulfield South (State Suburb)". 2016 Census of Population and Housing. Retrieved 27 June 2016.
- Australian Bureau of Statistics (27 June 2017). "2016 Community Profiles: Rose Bay (NSW) (State Suburb)". 2016 Census of Population and Housing. Retrieved 27 June 2016.
- "Statistics on Sarcelles". L'Express. 9 June 1994. Retrieved 21 September 2014.
- "Seattle's Jewish population jumped by 70 percent, study finds". 2 February 2015.
- Australian Bureau of Statistics (27 June 2017). "2016 Community Profiles: St Kilda East (State Suburb)". 2016 Census of Population and Housing. Retrieved 27 June 2016.
- "Statistics on Créteil". Le Parisien. 24 September 2005. Retrieved 21 September 2014.
- Australian Bureau of Statistics (27 June 2017). "2016 Community Profiles: Vaucluse (State Suburb)". 2016 Census of Population and Housing. Retrieved 27 June 2016.
- "Statistics Canada - Community profiles - Westmount". 2.statcan.ca. 12 March 2002. Retrieved 11 June 2012.
- Australian Bureau of Statistics (27 June 2017). "2016 Community Profiles: Bellevue Hill (State Suburb)". 2016 Census of Population and Housing. Retrieved 27 June 2016.
- "Statistics Canada - Community profiles - Dollard-des-Ormeaux". 2.statcan.ca. 12 March 2002. Retrieved 11 June 2012.
- "Religions in Canada". 2.statcan.ca. 15 May 2001. Retrieved 11 June 2012.
- Australian Bureau of Statistics (27 June 2017). "2016 Community Profiles: Elsternwick (State Suburb)". 2016 Census of Population and Housing. Retrieved 27 June 2016.
- "Statistics Canada - Community profiles - Montreal West". 2.statcan.ca. 12 March 2002. Archived from the original on 23 March 2015. Retrieved 11 June 2012.
- https://www.totallyjewishtravel.com/Kosher_Tours-TL3567-newton_massachusetts-Vacations.html
- "World Jewish Population". SimpleToRemember.com – Judaism Online. Retrieved 2 September 2012.
- Australian Bureau of Statistics (27 June 2017). "2016 Community Profiles: Bondi (State Suburb)". 2016 Census of Population and Housing. Retrieved 27 June 2016.
- "Statistics Canada - Community profiles - Mount Royal". 2.statcan.ca. 12 March 2002. Retrieved 11 June 2012.
- "San Jose". The American-Israeli Cooperative Enterprise (AICE) . Retrieved 1 November 2013.
- Refugees, United Nations High Commissioner for. "Refworld | World Directory of Minorities and Indigenous Peoples - France : Jews". Retrieved 30 September 2016.
- "Son 244.000 los judíos que viven en la ciudad, según un censo poblacional" (in Spanish). La Nación. 6 June 2005. Retrieved 21 March 2016.
- "2011 Standard Outputs". Scotland's Census. Retrieved 23 September 2016.
- "America's 30 Most Jewish Cities". The Daily Beast. Retrieved 1 November 2013.
- "2001 Community Profiles". 2.statcan.ca. 12 March 2002. Retrieved 11 June 2012.
External links
- Israelbooks.com The Jewish People Policy Planning Institute Annual Assessment 2004–2005: Between Thriving and Decline. Gefen Publishing House.
- Publications on Jewish population at the Berman Jewish Policy Archive @ NYU Wagner
- Jewish Population and Migration, by YIVO Encyclopedia