Demographics of Israel
The State of Israel has a population of approximately 9,227,700 inhabitants as of July 2020. Some 74.24% are Jews of all backgrounds (about 6,829,000 individuals), 20.95% are Arab of any religion other than Jewish (about 1,890,000 individuals), while the remaining 4.81% (about 434,000 individuals) are defined as "others", including persons of Jewish ancestry deemed non-Jewish by religious law and persons of non-Jewish ancestry who are family members of Jewish immigrants (neither of which are registered at the Ministry of Interior as Jews), Christian non-Arabs, Muslim non-Arabs and all other residents who have neither an ethnic nor religious classification.[4]
| Demographics of | |
|---|---|
 Population of Israel since 1949 | |
| Population | 9,097,000 (99th) [1][2] |
| Density | 401/km2 (35th) |
| Growth rate | 2.0% [3] |
| Birth rate | 21.5 births/1,000 population (101st) |
| Death rate | 5.2 deaths/1,000 population (174th) |
| Life expectancy | 82.7 years (8th) |
| • male | 80.7 years |
| • female | 84.6 years |
| Fertility rate | 3.13 children born/woman (76th) |
| Infant mortality rate | 4.03 deaths/1,000 live births (25th) |
| Age structure | |
| 0–14 years | 27.3% |
| 15–64 years | 62.2% |
| 65 and over | 10.5% |
| Sex ratio | |
| Total | 1.01 male(s)/female |
| At birth | 1.05 male(s)/female |
| Under 15 | 1.05 male(s)/female |
| 15–64 years | 1.03 male(s)/female |
| 65 and over | 0.78 male(s)/female |
| Nationality | |
| Nationality | Israelis |
| Major ethnic | Jews, Arabs |
| Minor ethnic | Druze, Arameans, Armenians, Circassians, Samaritans |
| Language | |
| Official | Hebrew |
| Spoken | Arabic, Russian, Yiddish, French, English |
Israel's annual population growth rate stood at 2.0% in 2015, more than three times faster than the OECD average of around 0.6%.[5] With an average of three children per woman, Israel also has the highest fertility rate in the OECD by a considerable margin and much higher than the OECD average of 1.7.[6] The demographics of Israel are monitored by the Israel Central Bureau of Statistics.
Definition
The territory of Israel can be defined in a number of ways as a result of a complex and unresolved political situation (see table below). For example, whilst the Israel Central Bureau of Statistics defines the area of Israel to include the annexed East Jerusalem and Golan Heights, and to exclude the militarily controlled regions of the West Bank, the CBS defines the population of Israel to also include Israeli settlers living in the Area C of West Bank and the Muslim residents of East Jerusalem and Area C, who have Israeli residency or citizenship.
| Region | Status | Population (thousands) | Area (km2) | ||||
|---|---|---|---|---|---|---|---|
| Israelis (including Jews and Muslims) | Cumulative total | Non-Israeli Palestinians | Cumulative total | Area | Cumulative total | ||
| Green Line | Area sovereign to Israel after 1949 Armistice Agreements | 6,819[7] | — | — | — | 20,582[7] | |
| East Jerusalem | Occupied by Israel in 1967. Annexed by Israel via the Jerusalem Law of 1980, The law was not recognised internationally[8] and determined null and void by United Nations Security Council Resolution 478.[9][10] | 455[11] | — | 225 (double counted)[12] | — | 336[13] | — |
| Golan Heights | Occupied by Israel in 1967. Annexed by Israel via the Golan Heights Law of 1981, The law was not recognised internationally[8] and determined null and void by United Nations Security Council Resolution 497.[9][10] The United States became the first country to recognize Israeli sovereignty over the Golan, which the rest of the international community considers Israeli occupied Syrian territory.[14] | 42[15] | 7,316[15] | n.a. (Syrians) | n.a. | 1,154[16] | 22,072[16] |
| Seam Zone | Area between the Green Line and the West Bank barrier – area occupied by Israel in 1967, currently part of Area C | 188[17] | — | 35[17] | — | 200[13] | — |
| Other Israeli settlements and IDF military areas (West Bank Area C) | Israeli control, except over Palestinian civilians, according to the administrative divisions of the Oslo Accords | 57[7] | 7,620[15] | 115[18] | 375[7] | 2,961[19] | 25,233[7] |
| Palestinian National Authority (West Bank Areas A and B) | Palestinian civil control, according to the administrative divisions of the Oslo Accords | — | — | 2,311[20] | 2,686[7] | 2,143[18] | 27,376[7] |
| Gaza Strip | Palestinian governed area. Israel controls airspace, maritime border and 80% of land border. | — | — | 1,816[21] | 4,502[7] | 360[21] | 27,736[7] |
Cities
Within Israel's system of local government, an urban municipality can be granted a city council by the Israeli Interior Ministry when its population exceeds 20,000.[22] The term "city" does not generally refer to local councils or urban agglomerations, even though a defined city often contains only a small portion of an urban area or metropolitan area's population.
^a This number includes East Jerusalem and West Bank areas, which had a total population of 542,410 inhabitants in 2016.[24] Israeli sovereignty over East Jerusalem is internationally unrecognized.
Ethnic and religious groups
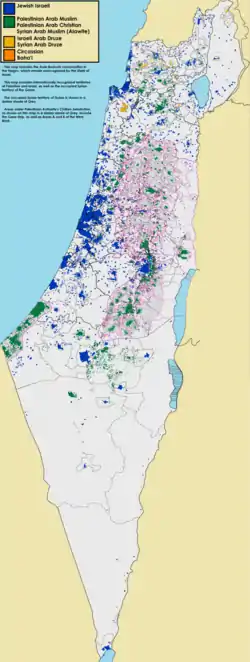
The most prominent ethnic and religious groups, who live in Israel at present and who are Israeli citizens or nationals, are as follows:
Jews
According to Israel's Central Bureau of Statistics, in 2008, of Israel's 7.3 million people, 75.6 percent were Jews of any background.[25] Among them, 70.3 percent were Sabras (born in Israel), mostly second- or third-generation Israelis, and the rest are olim (Jewish immigrants to Israel)—20.5 percent from Europe and the Americas, and 9.2 percent from Asia and Africa, including the Arab countries.[26] About 44.9% percent of Israel's Jewish population identify as either Mizrahi or Sephardi, 44.2% identify as Ashkenazi, about 3% as Beta Israel and 7.9% as mixed or other.[27]
The paternal lineage of the Jewish population of Israel as of 2015 is as follows:
| Countries of Origin | Population | Percentage | ||||
|---|---|---|---|---|---|---|
| Share | 2015[28] | 2008[26] | Share | 2015 | 2008 | |
| Total | 6,276,800 | 5,523,700 | 100% | 100% | ||
| From Israel by paternal country of origin: | 2,765,500 | 2,043,800 | 44.06% | 37% | ||
| From Europe by own or paternal country of origin: | 1,648,000 | 1,662,800 | 26.26% | 30.1% | ||
| Russia and former USSR | 891,700 | 923,600 | 14.21% | 16.83% | ||
| Romania | 199,400 | 213,100 | 3.18% | 3.86% | ||
| Poland | 185,400 | 198,500 | 2.95% | 3.59% | ||
| France | 87,500 | 63,200 | 1.39% | 1.14% | ||
| Germany and Austria | 70,800 | 49,700 | 1.13% | 0.9% | ||
| Hungary, Czech Republic, and Slovakia | 59,800 | 64,900 | 0.95% | 1.17% | ||
| United Kingdom | 46,000 | 39,800 | 0.73% | 0.72% | ||
| Bulgaria and Greece | 45,500 | 48,900 | 0.72% | 0.89% | ||
| Other European | 61,900 | 61,100 | 0.99% | 1.11% | ||
| From Africa by own or paternal country of origin: | 897,300 | 859,100 | 14.3% | 15.53% | ||
| Morocco | 484,500 | 486,600 | 7.72% | 8.81% | ||
| Algeria and Tunisia | 133,500 | 120,600 | 2.13% | 2.18% | ||
| Ethiopia | 133,200 | 106,900 | 2.12% | 1.94% | ||
| Libya | 66,800 | 67,400 | 1.06% | 1.22% | ||
| Egypt | 54,600 | 55,800 | 0.87% | 1.01% | ||
| Other African | 24,700 | 17,200 | 0.39% | 0.31% | ||
| From Asia by own or paternal country of origin: | 674,500 | 681,400 | 10.75% | 12.33% | ||
| Iraq | 225,800 | 233,500 | 3.6% | 4.23% | ||
| Iran (Persia) | 140,100 | 134,700 | 2.23% | 2.44% | ||
| Yemen | 134,100 | 138,300 | 2.14% | 2.5% | ||
| Turkey | 74,600 | 76,900 | 1.19% | 1.39% | ||
| India and Pakistan | 47,600 | 45,600 | 0.76% | 0.83% | ||
| Syria and Lebanon | 34,500 | 35,300 | 0.55% | 0.64% | ||
| Other Asian | 18,000 | 17,200 | 0.29% | 0.31% | ||
| From the Americas and Oceania by own or paternal country of origin: | 291,500 | 249,800 | 4.64% | 4.52% | ||
| United States, Canada, Australia, and New Zealand | 181,000 | 149,200 | 2.88% | 2.7% | ||
| Argentina | 62,600 | 59,400 | 1% | 1.08% | ||
| Other Latin American | 47,900 | 41,200 | 0.76% | 0.75% | ||
Arabs
Arab citizens of Israel are those Arab residents of Mandatory Palestine, who remained within Israel's borders following the 1948 Arab–Israeli War, and the establishment of the state of Israel. It is including those born within the state borders subsequent to this time, as well as those who had left during the establishment of the state (or their descendants), who have since re-entered by means accepted as lawful residence by the Israeli state (primarily family reunifications).
In 2019, the official number of Arab residents in Israel was 1,890,000 people, representing 21% of Israel's population.[4] This figure includes 209,000 Arabs (14% of the Israeli Arab population) in East Jerusalem, also counted in the Palestinian statistics, although 98 percent of East Jerusalem Palestinians have either Israeli residency or Israeli citizenship.[29]
Arab Muslims
Most Arab citizens of Israel are Muslim, particularly of the Sunni branch of Islam. A small minority are Ahmadiyya sect and there are also some Alawites (affiliated with Shia Islam) in the northernmost village of Ghajar with Israeli citizenship. As of 2019, Arab citizens of Israel comprised 21 percent of the country's total population.[4] About 82 percent of the Arab population in Israel are Sunni Muslims, a very small minority are Shia Muslims, another 9 percent are Druze, and around 9 percent are Christian (mostly Eastern Orthodox and Catholic denominations).
Bedouin
The Arab Muslim citizens of Israel include also the Bedouins, who are divided into two main groups: the Bedouin in the north of Israel, who live in villages and towns for the most part, and the Bedouin in the Negev, who include half-nomadic and inhabitants of towns and Unrecognized villages. According to the Israeli Ministry of Foreign Affairs, as of 1999, 110,000 Bedouins live in the Negev, 50,000 in the Galilee and 10,000 in the central region of Israel.[30] The vast majority of Arab Bedouins of Israel practice Sunni Islam.
Ahmadiyya
The Ahmadiyya community was first established in the region in the 1920s, in what was then Mandatory Palestine. There is a large community in Kababir, a neighbourhood on Mount Carmel in Haifa.[31][32] It is unknown how many Israeli Ahmadis there are, although it is estimated there are about 2,200 Ahmadis in Kababir alone.[33]
Arab Christians
As of December 2013, about 161,000 Israeli citizens practiced Christianity, together comprising about 2% of the total population.[34] The largest group consists of Melkites (about 60% of Israel's Christians), followed by the Greek Orthodox (about 30%), with the remaining ca. 10% spread between the Roman Catholic (Latin), Maronite, Anglican, Lutheran, Armenian, Syriac, Ethiopian, Coptic and other denominations.[34]
Druze
The Arab citizens of Israel include also the Druze, who numbered at an estimated 143,000 in April 2019.[35] All of the Druze living in what was then British Mandate Palestine became Israeli citizens after the declaration of the State of Israel. Though a few individuals identify themselves as "Palestinian Druze",[36] the vast majority of Druze do not consider themselves to be 'Palestinian', and consider their Israeli identity stronger than their Arab identity. Druze serve prominently in the Israel Defense Forces, and are represented in mainstream Israeli politics and business as well, unlike Muslim Arabs who are not required to and generally choose not to serve in the Israeli army.
Arameans
In 2014, Israel decided to recognize the Aramaic community within its borders as a national minority, allowing some of the Christians in Israel to be registered as "Aramean" instead of "Arab".[37] As of October 2014, some 600 Israelis requested to be registered as Arameans, with several thousand eligible for the status – mostly members of the Maronite community.
The Maronite Christian community in Israel of around 7,000 resides mostly in the Galilee, with a presence in Haifa, Nazareth and Jerusalem. It is largely composed of families that lived in Upper Galilee in villages such as Jish long before the establishment of Israel in 1948. In the year 2000, the community was joined by a group of Lebanese SLA militia members and their families, who fled Lebanon after 2000 withdrawal of IDF from South Lebanon.
Assyrians
There are around 1,000 Assyrians living in Israel, mostly in Jerusalem and Nazareth. Assyrians are an Aramaic speaking, Eastern Rite Christian minority who are descended from the ancient Mesopotamians. The old Syriac Orthodox monastery of Saint Mark lies in Jerusalem. Other than followers of the Syriac Orthodox Church, there are also followers of the Assyrian Church of the East and the Chaldean Catholic Church living in Israel.
Copts
Some 1,000 Israeli citizens belong to the Coptic community, originating in Egypt.
Samaritans
The Samaritans are an ethnoreligious group of the Levant. Ancestrally, they claim descent from a group of Israelite inhabitants who have connections to ancient Samaria from the beginning of the Babylonian Exile up to the beginning of the Common Era. 2007 population estimates show that 712 Samaritans live half in Holon, Israel and half at Mount Gerizim in the West Bank. The Holon community holds Israeli citizenship, while the Gerizim community resides at an Israeli controlled enclave, holding dual Israeli-Palestinian citizenship.
Armenians
About 4,000 Armenians reside in Israel mostly in Jerusalem (including in the Armenian Quarter), but also in Tel Aviv, Haifa and Jaffa. Armenians have a Patriarchate in Jerusalem and churches in Jerusalem, Haifa and Jaffa. Although Armenians of Old Jerusalem have Israeli identity cards, they are officially holders of Jordanian passports.[38]
Circassians
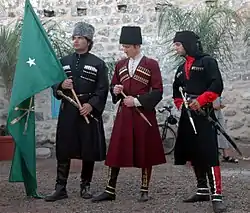
In Israel, there are also a few thousand Circassians, living mostly in Kfar Kama (2,000) and Reyhaniye (1,000).[39] These two villages were a part of a greater group of Circassian villages around the Golan Heights. The Circassians in Israel enjoy, like Druzes, a status aparte. Male Circassians (at their leader's request) are mandated for military service, while females are not.
People from post-Soviet states

Ethnic Russians, Ukrainians, and Belarusians, immigrants from the former Soviet Union, who were eligible to emigrate due to having, or being married to somebody who has, at least one Jewish grandparent and thus qualified for Israeli citizenship under the revised Law of Return. A number of these immigrants also belong to various ethnic groups from the Former Soviet Union such as Armenians, Georgians, Azeris, Uzbeks, Moldovans, Tatars, among others. Some of them, having a Jewish father or grandfather, identify as Jews, but being non-Jewish by Orthodox Halakha (religious law), they are not recognized formally as Jews by the state. Most of them are in the mainstream of Israel culture and are called "expanded Jewish population". In addition, a certain number of former Soviet citizens, primarily women of Russian and Ukrainian ethnicity, emigrated to Israel, after marrying Muslim or Christian Arab citizens of Israel, who went to study in the former Soviet Union in the 1970s and 1980s. 1,557,698 people from the current Russia and Ukraine live in Israel.[40]
Finns
Although most people of Finnish origin in Israel are Finnish Jews who immigrated to Israel, and their descendants, a small number of Finnish Christians moved to Israel in the 1940s before independence and gained citizenship following independence. For the most part, many of the original Finnish settlers intermarried with the other communities in the country, and therefore remain very small in number. A Moshav shitufi near Jerusalem named Yad HaShmona, meaning the "Memorial for the Eight", was established in 1971 by a group of Finnish Christian-Israelis, although today, most members are Israeli, and are predominantly Hebrew speakers, and the moshav has become a center of Messianic Jews.[41][42]
Baháʼís
The population of followers of the Baháʼí Faith in Israel is almost entirely made up of volunteers serving at the Baháʼí World Centre. Bahá'u'lláh (1817–1892), the Faith's founder, was banished to Akka and died nearby where his shrine is located. During his lifetime he instructed his followers not to teach and convert those living in the area, and the Baháʼís descending from those original immigrants were later asked to leave and teach elsewhere. For nearly a century there has been a policy by Shoghi Effendi and later the Universal House of Justice to not accept converts from Israel. The 650 or so foreign national Baháʼís living in Israel are almost all on temporary duty serving at the shrines and administrative offices.[43][44][45] A fluctuating segment of Baháʼís consists of those on the Baháʼí pilgrimage.[46]
Vietnamese
The number of Vietnamese people in Israel and their descendants is estimated at 150 to 200.[47] Most of them came to Israel in between 1976 and 1979, after prime minister Menachem Begin authorized their admission to Israel and granted them political asylum. The Vietnamese people living in Israel are Israeli citizens who also serve in the Israel Defense Forces. Today, the majority of the community lives in the Gush Dan area in the center of Tel Aviv, but also a few dozen Vietnamese-Israelis or Israelis of Vietnamese origin live in Haifa, Jerusalem, and Ofakim.
African Hebrew Israelites of Jerusalem
The African Hebrew Israelite Nation of Jerusalem is a religious sect[48] of blacks Americans, founded in 1960 by Ben Carter[49][50] a metal worker in Chicago. The members of this sect believe they are descended from the tribes of Judah driven from the Holy Land by the Romans during the First Jewish War (70 AD), and who reportedly emigrated to West Africa before being taken as slaves to the United States.[49][51] With a population of over 5,000, most members live in their own community in Dimona, Israel, with additional families in Arad, Mitzpe Ramon, and the Tiberias area. The group believes that the ancient Israelites are the ancestors of black Americans and that the actual Jews are "impostors".[52] All scholarship does consider them to be of subsaharan African origin as the genetic studies on black American have shown too[53] and not from levantine one. Their ancestors were black Americans who after being expelled from Liberia have illegally immigrated to Israel in the late 1960s by using tourist visas, requesting that Israel provide them legal citizenship status. Israel granted their requests.[54] The African Hebrew Israelites, like the Haredim and most Israeli Arabs, are not required to serve in the military; however, some do so.
Naturalized foreign workers
Some naturalized foreign workers and their children born in Israel, predominantly from the Philippines, Nepal, Nigeria, Senegal, Romania, China, Cyprus, Thailand, and South America (mainly Colombia).
African migrants

The number and status of African migrants in Israel is disputed and controversial, but it is estimated that at least 70,000 refugees mainly from Eritrea, Sudan, South Sudan, Ethiopia, and the Ivory Coast reside and work in Israel. A count in late 2011 published in Ynet pointed out the number only in Tel Aviv is 40,000, which represents 10 percent of the city's population. The vast majority live in the southern parts of the city. There is a significant population in the southern Israeli cities of Eilat, Arad, and Beersheba.
Foreign workers
There are around 300,000 foreign workers, residing in Israel under temporary work visas, including Palestinians. Most of those foreign workers engage in agriculture and construction. The main groups of those foreign workers include the Chinese, Thai, Filipinos,[55] Nigerians, Romanians, and Latin Americans.
Other refugees
Approximately 100–200 refugees from Bosnia, Kosovo, Iraqi Kurdistan, and North Korea were absorbed in Israel as refugees. Most of them were also given Israeli resident status, and currently reside in Israel.[56] As of 2006, some 200 ethnic Kurdish refugees from Turkey resided in Israel as illegal immigrants, fleeing the Kurdish–Turkish conflict.[57]
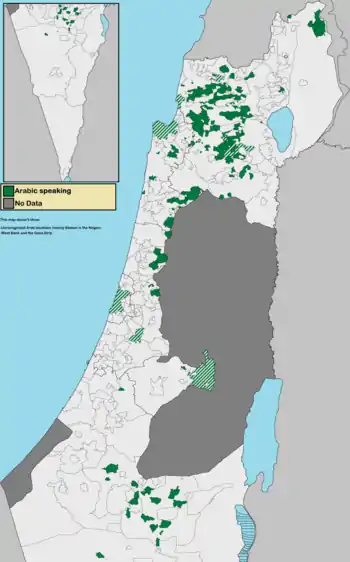
Languages

Due to its immigrant nature, Israel is one of the most multicultural and multilingual societies in the world. Hebrew is the official language of the country, and Arabic is given special status, while English and Russian are the two most widely spoken non-official languages. A certain degree of English is spoken widely, and is the language of choice for many Israeli businesses. Hebrew and English language are mandatory subjects in the Israeli school system, and most schools offer either Arabic, French, Spanish, German, Italian, or Russian.
Religion
According to a 2010 Israel Central Bureau of Statistics study[59] of Israelis aged over 18:
- 8% of Israeli Jews define themselves as Haredim (or ultra-Orthodox);
- 12% are "religious" (non-Haredi Orthodox, also known as: dati leumi/national-religious or religious Zionist);
- 13% consider themselves "religious-traditionalists" (mostly adhering to Jewish Halakha);
- 25% are "non-religious traditionalists" (only partly respecting the Jewish Halakha), and
- 43% are "secular".
While the ultra-Orthodox, or Haredim, represented only 5% of Israel's population in 1990,[60] they are expected to represent more than one-fifth of Israel's Jewish population by 2028.[61] By 2020, they were 12% of the population.[62]
| Group | Population | % |
|---|---|---|
| Jews | 6,697,000 | 74.2% |
| Muslims | 1,605,700 | 17.8% |
| Christians | 180,400 | 2.0% |
| Druze | 143,000 | 1.6% |
| Other/unknown | 394,900 | 4.4% |
Education
Education between ages 5 and 15 is compulsory. It is not free, but it is subsidized by the government, individual organizations (such as the Beit Yaakov System), or a combination. Parents are expected to participate in courses as well. The school system is organized into kindergartens, 6-year primary schools, and either 6-year secondary schools or 3-year junior secondary schools + 3-year senior secondary schools (depending on region), after which a comprehensive examination is offered for university admissions.
Policy
As Israel's continued existence as a Jewish state relies upon maintenance of a Jewish demographic majority, Israeli demographers, politicians, and bureaucrats have treated Jewish population growth promotion as a central question in their research and policymaking. Non-Jewish population growth and immigration is regarded as a threat to the Jewish demographic majority, and to Israel's security , as detailed in the Koenig Memorandum.
Israel is the eighteenth-most-densely-crowded country in the world. In an academic article, Jewish National Fund Board member Daniel Orenstein, argues that, as elsewhere, overpopulation is a stressor on the environment in Israel; he shows that environmentalists have conspicuously failed to consider the impact of population on the environment, and argues that overpopulation in Israel has not been appropriately addressed for ideological reasons.[65][66]
Citizenship and Entry Law
The Citizenship and Entry into Israel Law (Temporary Order) 5763 was first passed on 31 July 2003, and has since been extended until 31 July 2008. The law places age restrictions for the automatic granting of Israeli citizenship and residency permits to spouses of Israeli citizens, such that spouses who are inhabitants of the West Bank and Gaza Strip are ineligible. On 8 May 2005, the Israeli ministerial committee for issues of legislation once again amended the Citizenship and Entry into Israel Law, to restrict citizenship and residence in Israel only to Palestinian men over the age of 35, and Palestinian women over the age of 25. Those in favor of the law say the law not only limits the possibility of the entrance of terrorists into Israel, but, as Ze'ev Boim asserts, allows Israel "to maintain the state's democratic nature, but also its Jewish nature" (i. e., its Jewish demographic majority).[67] Critics, including the United Nations Committee on the Elimination of Racial Discrimination,[68] say the law disproportionately affects Arab citizens of Israel, since Arabs in Israel are far more likely to have spouses from the West Bank and Gaza Strip than other Israeli citizens.[69]
In the constitutional challenges to the Citizenship and Entry to Israel Law, the state, represented by the Attorney General, insisted that security was the only objective behind the law. The state also added that even if the law was intended to achieve demographic objectives, it is still in conformity with Israel's Jewish and democratic definition, and thus constitutional. In a 2012 ruling by the Supreme Court on the issue, some of the judges on the panel discussed demography, and were inclined to accept that demography is a legitimate consideration in devising family reunification policies that violate the right to family life.[70]
Soviet immigration
During the 1970s about 163,000 people of Jewish descent immigrated to Israel from the USSR.
Later Ariel Sharon, in his capacity as Minister of Housing & Construction and member of the Ministerial Committee for Immigration & Absorption, launched an unprecedented large-scale construction effort to accommodate the new Russian population in Israel so as to facilitate their smooth integration and encourage further Jewish immigration as an ongoing means of increasing the Jewish population of Israel.[71] Between 1989 and 2006, about 979,000 Jews emigrated from the former Soviet Union to Israel.
Statistics
| Year | Pop. | ±% p.a. |
|---|---|---|
| 1950 | 1,370,100 | — |
| 1960 | 2,150,400 | +4.61% |
| 1970 | 3,022,100 | +3.46% |
| 1980 | 3,921,700 | +2.64% |
| 1990 | 4,821,700 | +2.09% |
| 2000 | 6,369,300 | +2.82% |
| 2010 | 7,695,100 | +1.91% |
| 2019 | 9,098,700 | +1.88% |
| Source: [72][73][74] (2019 data)[75] | ||
Total population
9,308,800[76]
Note: includes over 200,000 Israelis and 250,000 Arabs in East Jerusalem, about 421,400 Jewish settlers on the West Bank, and about 42,000 in the Golan Heights (July 2007 estimate). Does not include Arab populations in the West Bank and Gaza Strip. Does not include 222,000 foreigners living in the country.[77]
| Group[72][78] | Population | Proportion of total | Growth rate |
| Jews: | 6,556,000 | 74.6% | 1.7% |
| Non-Haredi | 5,522,598 | 62.8% | 1.2% |
| Haredi | 1,033,000 | 11.8% | 5.0% |
| Arabs | 1,837,000 | 20.9% | 2.1% |
| Other | 400,000 | 4.5% | N/A |
| Total | 8,793,000 | 100% | 1.9% |
Age structure
Total:
- 0–14 years: 28.0%
- 15–64 years: 62.1%
- 65 years and over: 9.9%
Jews:
- 0–14 years: 25.5%
- 15–64 years: 63.1%
- 65 years and over: 11.4%
Arab:
- 0–14 years: 37.5%
- 15–64 years: 58.6%
- 65 years and over: 3.9% (2010 est.)
Median age
- Total: 29.7
- Jewish: 31.6
- Arab: 21.1
The Jewish median age in Jerusalem district and the West Bank are 24.9 and 19.7, respectively, and both account for 16% of the Jewish population, but 24% of 0- to 4-year-olds. The lowest median age in Israel, and one of the lowest in the world, is found in two of the West Bank's biggest Jewish cities: Modi'in Illit (11), Beitar Illit (11)[79] followed by Bedouin towns in the Negev (15.2).[80]
Population growth rate
- 2.0% (2016)
During the 1990s, the Jewish population growth rate was about 3% per year, as a result of massive immigration to Israel, primarily from the republics of the former Soviet Union. There is also a very high population growth rate among certain Jewish groups, especially adherents of Orthodox Judaism. The growth rate of the Arab population in Israel is 2.2%, while the growth rate of the Jewish population in Israel is 1.8%. The growth rate of the Arab population has slowed from 3.8% in 1999 to 2.2% in 2013, and for the Jewish population, the growth rate declined from 2.7% to its lowest rate of 1.4% in 2005. Due to a rise in fertility of the Jewish population since 1995 and immigration, the growth rate has since risen to 1.8%.[81]
Birth rate
VII/2019-VI/2020:
- Total: 19.8 births/1,000 population
- Jews and others: 19.1 births/1,000 population
- Muslims: 23.8 births/1,000 population
- Christians: 13.8 births/1,000 population
- Druze: 15.7 births/1,000 population
Births, in absolute numbers, by mother's religion[82]
| Year | Jewish | Muslim | Christian | Druze | Others | Total | % Jewish | % Muslim |
|---|---|---|---|---|---|---|---|---|
| 1996 | 83,710 | 30,802 | 2,678 | 2,682 | 1,461 | 121,333 | 69.0% | 25.4% |
| 2000 | 91,936 | 35,740 | 2,789 | 2,708 | 3,217 | 136,390 | 67.4% | 26.2% |
| 2005 | 100,657 | 34,217 | 2,487 | 2,533 | 4,019 | 143,913 | 69.9% | 23.8% |
| 2006 | 104,513 | 34,337 | 2,500 | 2,601 | 4,219 | 148,170 | 70.5% | 23.2% |
| 2007 | 107,986 | 34,572 | 2,521 | 2,510 | 4,090 | 151,679 | 71.2% | 22.8% |
| 2008 | 112,803 | 34,860 | 2,511 | 2,534 | 4,215 | 156,923 | 71.9% | 22.2% |
| 2009 | 116,599 | 35,253 | 2,514 | 2,517 | 4,159 | 161,042 | 72.4% | 21.9% |
| 2010 | 120,673 | 36,221 | 2,511 | 2,535 | 4,315 | 166,255 | 72.6% | 21.8% |
| 2011 | 121,520 | 35,247 | 2,596 | 2,469 | 4,464 | 166,296 | 73.1% | 21.2% |
| 2012 | 125,409 | 36,041 | 2,610 | 2,371 | 4,509 | 170,940 | 73.4% | 21.1% |
| 2013 | 126,999 | 34,927 | 2,602 | 2,350 | 4,566 | 171,444 | 74.1% | 20.4% |
| 2014 | 130,576 | 35,965 | 2,814 | 2,366 | 4,706 | 176,427 | 74.0% | 20.4% |
| 2015 | 132,220 | 36,659 | 2,669 | 2,376 | 4,799 | 178,723 | 74.0% | 20.5% |
| 2016 | 134,100 | 37,592 | 2,613 | 2,446 | 4,654 | 181,405 | 73.9% | 20.7% |
| 2017 | 134,630 | 39,550 | 2,504 | 2,350 | 4,614 | 183,648 | 73.3% | 21.5% |
| 2018 | 135,809 | 38,757 | 2,721 | 2,434 | 4,649 | 184,370 | 73.7% | 21.0% |
| 2019 | 133,243 | 39,525 | 2,409 | 2,298 | 5,156 | 182,016 | 73.2% | 21.7% |
Current natural population growth:[83]
- Births from January–August 2019 = Jewish: 87,237 (73.15%); Muslim: 26,016 (21.81%); Christian: 1,558 (1.31%); Druze: 1,505 (1.26%); Others: 2,939 (2.46%); Total: 119,255
- Births from January–August 2020 = Jewish: 85,453 (73.42%); Muslim: 24,974 (21.46%); Christian: 1,638 (1.41%); Druze: 1,522 (1.31%); Others: 2,796 (2.40%); Total: 116,383
Between the mid-1980s and 2000, the fertility rate in the Muslim sector was stable at 4.6–4.7 children per woman; after 2001, a gradual decline became evident, reaching 3.51 children per woman in 2011. By point of comparison, in 2011, there was a rising fertility rate of 2.98 children among the Jewish population.[84]
Births and deaths
| Year | Population | Live births | Deaths | Natural increase | Crude birth rate | Crude death rate | Rate of natural increase | TFR |
|---|---|---|---|---|---|---|---|---|
| 1950 | 1,370,000 | 43,431 | 8,700 | 34,731 | 34.1 | 6.8 | 27.3 | |
| 1951 | 1,578,000 | 50,542 | 9,866 | 40,676 | 34.3 | 6.7 | 27.6 | |
| 1952 | 1,630,000 | 52,556 | 11,666 | 40,890 | 32.8 | 7.3 | 25.5 | |
| 1953 | 1,669,000 | 52,552 | 10,916 | 41,636 | 31.9 | 6.6 | 25.3 | |
| 1954 | 1,718,000 | 48,951 | 11,328 | 37,623 | 28.9 | 6.7 | 22.2 | |
| 1955 | 1,789,000 | 50,686 | 10,532 | 40,154 | 28.9 | 6.0 | 22.9 | 4.03 |
| 1956 | 1,872,000 | 52,287 | 12,025 | 40,262 | 28.6 | 6.6 | 22.0 | |
| 1957 | 1,976,000 | 53,940 | 12,487 | 41,453 | 28.0 | 6.5 | 21.5 | |
| 1958 | 2,032,000 | 52,649 | 11,615 | 41,034 | 26.3 | 5.8 | 20.5 | |
| 1959 | 2,089,000 | 54,604 | 12,056 | 42,548 | 26.5 | 5.9 | 20.6 | |
| 1960 | 2,150,000 | 56,002 | 12,053 | 43,949 | 26.4 | 5.7 | 20.7 | |
| 1961 | 2,234,000 | 54,869 | 12,663 | 42,206 | 25.0 | 5.8 | 19.2 | |
| 1962 | 2,332,000 | 56,356 | 13,701 | 42,655 | 24.7 | 6.0 | 18.7 | |
| 1963 | 2,430,000 | 59,491 | 14,425 | 45,066 | 25.0 | 6.1 | 18.9 | |
| 1964 | 2,526,000 | 63,544 | 15,491 | 48,053 | 25.6 | 6.3 | 19.3 | |
| 1965 | 2,598,000 | 66,146 | 16,261 | 49,885 | 25.8 | 6.3 | 19.5 | 3.99 |
| 1966 | 2,657,000 | 67,148 | 16,582 | 50,566 | 25.6 | 6.3 | 19.3 | |
| 1967 | 2,776,000 | 64,980 | 17,463 | 47,517 | 23.9 | 6.4 | 17.5 | |
| 1968 | 2,841,000 | 69,911 | 18,689 | 51,222 | 24.9 | 6.7 | 18.2 | |
| 1969 | 2,930,000 | 73,666 | 19,767 | 53,899 | 25.5 | 6.9 | 18.6 | |
| 1970 | 3,022,000 | 80,843 | 21,234 | 59,609 | 27.2 | 7.1 | 20.1 | |
| 1971 | 3,121,000 | 85,899 | 21,415 | 64,484 | 28.0 | 7.0 | 21.0 | |
| 1972 | 3,225,000 | 85,544 | 22,719 | 62,825 | 27.0 | 7.2 | 19.8 | |
| 1973 | 3,338,000 | 88,545 | 23,054 | 65,491 | 27.0 | 7.0 | 20.0 | |
| 1974 | 3,422,000 | 93,166 | 24,135 | 69,031 | 27.6 | 7.1 | 20.5 | |
| 1975 | 3,493,000 | 95,628 | 24,600 | 71,028 | 27.7 | 7.1 | 20.6 | 3.68 |
| 1976 | 3,575,000 | 98,763 | 24,012 | 74,751 | 27.9 | 6.8 | 21.1 | |
| 1977 | 3,653,000 | 95,315 | 24,951 | 70,364 | 26.4 | 6.9 | 19.5 | |
| 1978 | 3,738,000 | 92,602 | 25,153 | 67,449 | 25.1 | 6.8 | 18.3 | 3.28 |
| 1979 | 3,836,000 | 93,710 | 25,700 | 68,010 | 24.7 | 6.8 | 17.9 | 3.21 |
| 1980 | 3,922,000 | 94,321 | 26,364 | 67,957 | 24.3 | 6.8 | 17.5 | 3.14 |
| 1981 | 3,978,000 | 93,308 | 26,085 | 67,223 | 23.6 | 6.6 | 17.0 | 3.06 |
| 1982 | 4,064,000 | 96,695 | 27,780 | 68,915 | 24.0 | 6.9 | 17.1 | 3.12 |
| 1983 | 4,119,000 | 98,724 | 27,731 | 70,993 | 24.0 | 6.7 | 17.3 | 3.14 |
| 1984 | 4,200,000 | 98,478 | 27,805 | 70,673 | 23.3 | 6.6 | 16.7 | 3.13 |
| 1985 | 4,266,000 | 99,376 | 28,093 | 71,283 | 23.1 | 6.5 | 16.6 | 3.12 |
| 1986 | 4,331,000 | 99,341 | 29,415 | 69,926 | 22.7 | 6.7 | 16.0 | 3.09 |
| 1987 | 4,407,000 | 99,022 | 29,244 | 69,778 | 22.2 | 6.6 | 15.6 | 3.05 |
| 1988 | 4,477,000 | 100,454 | 29,176 | 71,278 | 22.2 | 6.4 | 15.8 | 3.06 |
| 1989 | 4,560,000 | 100,757 | 28,580 | 72,177 | 22.1 | 6.3 | 15.8 | 3.03 |
| 1990 | 4,822,000 | 103,349 | 28,734 | 74,615 | 22.0 | 6.1 | 15.9 | 3.02 |
| 1991 | 5,059,000 | 105,725 | 31,266 | 74,459 | 21.4 | 6.3 | 15.1 | 2.91 |
| 1992 | 5,196,000 | 110,062 | 33,327 | 76,735 | 21.5 | 6.5 | 15.0 | 2.93 |
| 1993 | 5,328,000 | 112,330 | 33,000 | 79,330 | 21.3 | 6.3 | 15.0 | 2.92 |
| 1994 | 5,472,000 | 114,543 | 33,535 | 81,008 | 21.2 | 6.2 | 15.0 | 2.90 |
| 1995 | 5,612,000 | 116,886 | 35,348 | 81,538 | 21.1 | 6.4 | 14.7 | 2.88 |
| 1996 | 5,758,000 | 121,333 | 34,664 | 86,669 | 21.3 | 6.1 | 15.2 | 2.94 |
| 1997 | 5,900,000 | 124,478 | 36,124 | 88,354 | 21.4 | 6.2 | 15.2 | 2.93 |
| 1998 | 6,041,000 | 130,080 | 36,955 | 93,125 | 21.8 | 6.2 | 15.6 | 2.98 |
| 1999 | 6,209,000 | 131,936 | 37,291 | 94,645 | 21.6 | 6.1 | 15.5 | 2.94 |
| 2000 | 6,369,000 | 136,390 | 37,688 | 98,702 | 21.7 | 6.0 | 15.7 | 2.95 |
| 2001 | 6,509,000 | 136,636 | 37,186 | 99,450 | 21.2 | 5.8 | 15.4 | 2.89 |
| 2002 | 6,631,000 | 139,535 | 38,415 | 101,120 | 21.2 | 5.8 | 15.4 | 2.89 |
| 2003 | 6,748,000 | 144,936 | 38,499 | 106,437 | 21.7 | 5.8 | 15.9 | 2.95 |
| 2004 | 6,870,000 | 145,207 | 37,938 | 107,269 | 21.3 | 5.6 | 15.7 | 2.90 |
| 2005 | 6,991,000 | 143,913 | 39,038 | 104,875 | 20.8 | 5.6 | 15.2 | 2.84 |
| 2006 | 7,117,000 | 148,170 | 38,765 | 109,405 | 21.0 | 5.5 | 15.5 | 2.88 |
| 2007 | 7,244,000 | 151,679 | 39,813 | 111,866 | 21.1 | 5.5 | 15.6 | 2.90 |
| 2008 | 7,419,000 | 156,923 | 39,484 | 117,439 | 21.5 | 5.4 | 16.1 | 2.96 |
| 2009 | 7,552,000 | 161,042 | 38,812 | 122,230 | 21.5 | 5.2 | 16.3 | 2.96 |
| 2010 | 7,695,000 | 166,255 | 39,613 | 126,642 | 21.8 | 5.2 | 16.6 | 3.03 |
| 2011 | 7,837,000 | 166,296 | 40,889 | 125,407 | 21.4 | 5.3 | 16.1 | 3.00 |
| 2012 | 7,984,000 | 170,940 | 42,100 | 128,840 | 21.6 | 5.3 | 16.3 | 3.05 |
| 2013 | 8,134,000 | 171,444 | 41,683 | 129,761 | 21.3 | 5.2 | 16.1 | 3.03 |
| 2014 | 8,297,000 | 176,427 | 42,457 | 133,970 | 21.5 | 5.2 | 16.3 | 3.08 |
| 2015 | 8,463,000 | 178,723 | 44,507 | 134,216 | 21.3 | 5.3 | 16.0 | 3.09 |
| 2016 | 8,629,000 | 181,405 | 44,244 | 137,161 | 21.2 | 5.2 | 16.0 | 3.11 |
| 2017 | 8,798,000 | 183,648 | 44,923 | 138,725 | 21.1 | 5.2 | 15.9 | 3.11 |
| 2018 | 8,968,000 | 184,370 | 44,802 | 139,568 | 20.8 | 5.0 | 15.8 | 3.09 |
| 2019 | 9,139,000 | 182,016 | 46,276 | 135,740 | 20.0 | 5.1 | 14.9 | 3.01 |
| 2020(p) | 9,291,000 | 176,000 | 50,000 | 126,000 | 19.1 | 5.4 | 13.7 | |
(p) = preliminar results
Current vital statistics
Births[87]
- January–November 2019 =
 166,409
 - January–November 2020 = 162,339
Deaths
- January–November 2019 =
 42,027
 - January–November 2020 = 44,180
Natural increase
- January–November 2019 = 124,382
- January–November 2020 = 118,159
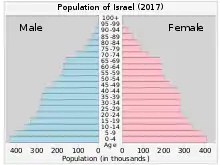
Structure of the population
| Age Group | Male | Female | Total | % |
|---|---|---|---|---|
| Total | 3 916 125 | 3 994 400 | 7 910 525 | 100 |
| 0–4 | 417 479 | 397 686 | 815 165 | 10,30 |
| 5–9 | 377 005 | 358 520 | 735 525 | 9,30 |
| 10–14 | 346 662 | 329 776 | 676 438 | 8,55 |
| 15–19 | 314 286 | 299 211 | 613 497 | 7,76 |
| 20–24 | 300 332 | 289 936 | 590 268 | 7,46 |
| 25–29 | 291 710 | 287 934 | 579 644 | 7,33 |
| 30–34 | 276 871 | 278 321 | 555 191 | 7,02 |
| 35–39 | 268 377 | 270 934 | 539 311 | 6,82 |
| 40–44 | 232 269 | 236 767 | 469 036 | 5,93 |
| 45–49 | 201 080 | 206 786 | 407 867 | 5,16 |
| 50–54 | 189 222 | 201 916 | 391 138 | 4,94 |
| 55–59 | 179 379 | 194 732 | 374 111 | 4,73 |
| 60–64 | 165 789 | 183 357 | 349 146 | 4,41 |
| 65–69 | 115 943 | 130 457 | 246 400 | 3,11 |
| 70–74 | 89 904 | 103 747 | 188 651 | 2,38 |
| 75–79 | 68 016 | 88 979 | 156 994 | 1,98 |
| 80–84 | 46 204 | 67 535 | 113 739 | 1,44 |
| 85–89 | 26 669 | 45 650 | 72 319 | 0,91 |
| 90–94 | 10 499 | 16 451 | 26 950 | 0,34 |
| 95–99 | 2 418 | 4 374 | 6 792 | 0,09 |
| 100+ | 1 012 | 1 331 | 2 342 | 0,03 |
| Age group | Male | Female | Total | Percent |
|---|---|---|---|---|
| 0–14 | 1 141 146 | 1 085 982 | 2 227 128 | 28,15 |
| 15–64 | 2 419 314 | 2 449 894 | 4 869 208 | 61,55 |
| 65+ | 355 665 | 458 524 | 814 189 | 10,29 |
Death rate
- 5.3 deaths/1,000 population (2015 est.)
There were a total of 38,666 deaths in 2006. (39,026 in 2005 & 37,688 in 2000). Of this 33,568 were Jews (34,031 in 2005 & 33,421 in 2000). 3,078 were Muslims (2,968 in 2005 & 2,683 in 2000). 360 were Druze (363 in 2005 & 305 in 2000). 712 were Christian (686 in 2005 & 666 in 2000).
Net migration rate
- 1.81 migrant(s)/1,000 population (2013 est.)
There were a total of 28,629 immigrants who made Aliyah to Israel in 2019 (jan-oct):
12,722 from Russia; 5,247 from Ukraine; 2,470 from the United States; 276 from Canada; 143 from Australia; 1,996 from France; 469 from the UK; 350 from Brazil; 321 from South Africa; 93 from Venezuela; 127 from Mexico; 143 from Turkey; 57 from Iran; 14 from Thailand and 5 from Japan.[88]
Emigration
For many years definitive data on Israeli emigration was unavailable.[89] In The Israeli Diaspora sociologist Stephen J. Gold maintains that calculation of Jewish emigration has been a contentious issue, explaining, "Since Zionism, the philosophy that underlies the existence of the Jewish state, calls for return home of the world's Jews, the opposite movement—Israelis leaving the Jewish state to reside elsewhere—clearly presents an ideological and demographic problem."[90]
In the past several decades, emigration (yerida) has seen a considerable increase. From 1990 to 2005, 230,000 Israelis left the country; a large proportion of these departures included people who initially immigrated to Israel and then reversed their course (48% of all post-1990 departures and even 60% of 2003 and 2004 departures were former immigrants to Israel). 8% of Jewish immigrants in the post-1990 period left Israel, while 15% of non-Jewish immigrants did. In 2005 alone, 21,500 Israelis left the country and had not yet returned at the end of 2006; among them 73% were Jews, 5% Arabs, and 22% "Others" (mostly non-Jewish immigrants, with Jewish ancestry, from USSR). At the same time, 10,500 Israelis came back to Israel after over one year abroad; 84% were Jews, 9% Others, and 7% Arabs.[91]
According to the Israel Central Bureau of Statistics, as of 2005, 650,000 Israelis had left the country for over one year and not returned. Of them, 530,000 are still alive today. This number does not include the children born overseas. It should also be noted that Israeli law grants citizenship only to the first generation of children born to Israeli emigrants.
Density
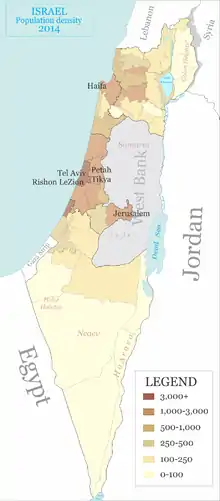
Geographic deployment:
- Central District: 24% (1,649,800)
- Tel Aviv District: 17% (1,190,000)
- Northern District: 17% (1,185,400)
- Southern District: 14% (1,002,400)
- Haifa District: 12% (858,000)
- Jerusalem District: 12% (851,400)
- Judea and Samaria Area (Israelis only): 5.1% (407,100) (2015)
Sex ratio
- At birth: 1.05 male(s)/female
- Under 15 years: 1.05 male(s)/female
- 15–64 years: 1.03 male(s)/female
- 65 years and over: 0.78 male(s)/female
- Total population: 1.01 male(s)/female (2011 est.)
Maternal mortality rate
- 7 deaths/100,000 live births (2010).
Infant mortality rate
- Total: 4.03 deaths/1,000 live births
- Male: 4.20 deaths/1,000 live births
- Female: 3.84 deaths/1,000 live births (2013 est.)
Life expectancy at birth
- Total population: 82.4 years
- Male: 80.7 years
- Female: 84.2 years (2016)[92]
| Period | Life expectancy | Period | Life expectancy |
|---|---|---|---|
| 1950–1955 | 68.9 | 1985–1990 | 75.9 |
| 1955–1960 | 70.0 | 1990–1995 | 77.2 |
| 1960–1965 | 71.0 | 1995–2000 | 78.3 |
| 1965–1970 | 71.8 | 2000–2005 | 79.6 |
| 1970–1975 | 72.6 | 2005–2010 | 80.9 |
| 1975–1980 | 73.5 | 2010–2015 | 81.9 |
| 1980–1985 | 74.6 |
Total fertility rate
The total fertility rate (TFR) of a population is the average number of children that an average woman would have, in her lifetime.
- 3.01 children born/woman (2019)
| Year | Jews | Muslims | Christians | Druze | Others | Total |
|---|---|---|---|---|---|---|
| 2000 | 2.66 | 4.74 | 2.55 | 3.07 | 2.95 | |
| 2001 | 2.59 | 4.71 | 2.46 | 3.02 | 2.89 | |
| 2002 | 2.64 | 4.58 | 2.29 | 2.77 | 2.89 | |
| 2003 | 2.73 | 4.50 | 2.31 | 2.85 | 2.95 | |
| 2004 | 2.71 | 4.36 | 2.13 | 2.66 | 1.47 | 2.90 |
| 2005 | 2.69 | 4.03 | 2.15 | 2.59 | 1.49 | 2.84 |
| 2006 | 2.75 | 3.97 | 2.14 | 2.64 | 1.55 | 2.88 |
| 2007 | 2.80 | 3.90 | 2.13 | 2.49 | 1.49 | 2.90 |
| 2008 | 2.88 | 3.84 | 2.11 | 2.49 | 1.57 | 2.96 |
| 2009 | 2.90 | 3.73 | 2.15 | 2.49 | 1.56 | 2.96 |
| 2010 | 2.97 | 3.75 | 2.14 | 2.48 | 1.64 | 3.03 |
| 2011 | 2.98 | 3.51 | 2.19 | 2.33 | 1.75 | 3.00 |
| 2012 | 3.04 | 3.54 | 2.17 | 2.26 | 1.68 | 3.05 |
| 2013 | 3.05 | 3.35 | 2.13 | 2.21 | 1.68 | 3.03 |
| 2014 | 3.11 | 3.35 | 2.27 | 2.20 | 1.72 | 3.08 |
| 2015 | 3.13 | 3.32 | 2.12 | 2.19 | 1.72 | 3.09 |
| 2016 | 3.16 | 3.29 | 2.05 | 2.21 | 1.64 | 3.11 |
| 2017 | 3.16 | 3.37 | 1.93 | 2.10 | 1.58 | 3.11 |
| 2018 | 3.17 | 3.20 | 2.06 | 2.16 | 1.54 | 3.09 |
| 2019 | 3.09 | 3.16 | 1.80 | 2.02 | 1.45 | 3.01 |
Jewish total fertility rate increased by 10.2% during 1998–2009, and was recorded at 2.90 during 2009. During the same time period, Arab TFR decreased by 20.5%. Muslim TFR was measured at 3.73 for 2009. During 2000, the Arab TFR in Jerusalem (4.43) was higher than that of the Jews residing there (3.79). But as of 2009, Jewish TFR in Jerusalem was measured higher than the Arab TFR (2010: 4.26 vs 3.85, 2009: 4.16 vs 3.87). TFR for Arab residents in the West Bank was measured at 2.91 in 2013,[94] while that for the Jewish residents was reported at 5.10 children per woman.[95]
The ethnic group with highest recorded TFR is the Bedouin of Negev. Their TFR was reported at 10.06 in 1998, and 5.73 in 2009. TFR is also very high among Haredi Jews. For Ashkenazi Haredim, the TFR rose from 6.91 in 1980 to 8.51 in 1996. The figure for 2008 is estimated to be even higher. TFR for Sephardi/Mizrahi Haredim rose from 4.57 in 1980 to 6.57 in 1996.[96]
Health expenditures
- 7.6% of total GDP (2010)
Physicians density
- 3.63 physicians/1,000 population (2007)
Hospital bed density
- 3.5 beds/1,000 population (2010)
HIV/AIDS – adult prevalence rate
- 0.2% (2009 est.)
Obesity – adult prevalence rate
- 26% of women and 40% of men are overweight. In both genders, obesity rate is 15% (as of 2011).[97]
Education expenditures
- 5.9% of total GDP (2009)
Literacy
Age 15 and over can read and write (2011 estimate):[98]
- Total population: 97.8%
- Male: 98.7%
- Female: 96.8%

Future projections
In June 2013, the Central Bureau of Statistics released a demographic report, projecting that Israel's population would grow to 11.4 million by 2035, with the Jewish population numbering 8.3 million, or 73% of the population, and the Arab population at 2.6 million, or 23%. This includes some 2.3 million Muslims (20% of the population), 185,000 Druze, and 152,000 Christians. The report predicts that the Israeli population growth rate will decline to 1.4% annually, with growth in the Muslim population remaining higher than the Jewish population until 2035, at which point the Jewish population will begin growing the fastest.[101]
In 2017, the Central Bureau of Statistics projected that Israel's population would rise to about 18 million by 2059, including 14.4 million Jews and 3.6 million Arabs. Of the Jewish population, about 5.25 million would be ultra-Orthodox Jews. Overall, the forecast projected that 49% of the population would be either ultra-Orthodox Jews (29%) or Arabs (20%).[102] It also projected a population of 20 million in 2065.[103] Jews and other non-Arabs are expected to comprise 81% of the population in 2065, and Arabs 19%. About 32% of the population is expected to be Haredi.[104]
Other forecasts project that Israel could have a population as high as 23 million, or even 36 million, by 2050.[105]
See also
References
- "Monthly Bulletin of Statistics – October 2019". www.cbs.gov.il.
- "Israeli population to soar to 15.2 million by 100th anniversary – Israel News – Jerusalem Post".
- "Growth Rate. Yearly average since last census conducted 27/12/2008" (PDF).
- Israel's Independence Day 2019 (PDF) (Report). Israel Central Bureau of Statistics. 6 May 2019. Retrieved 7 May 2019.
- "Population growth, OECD". OECD. 2012. Retrieved 17 February 2014.
- "Society at a Glance 2014 Highlights: ISRAEL, OECD" (PDF). OECD. 2014. Retrieved 19 April 2014.
- Figure calculated from other sourced figures in table
- BBC News. Regions and territories: The Golan Heights.
- United Nations. Security Council Resolutions, 1981.
- Council on Foreign Relations. UN Security Council Resolution 497.
- Jerusalem Institute for Israel Studies. "Jerusalem Statistical Yearbook 2009/10" (PDF). Archived from the original (PDF) on 12 March 2011. Retrieved 5 October 2010.
- Middle East Forum (March 2009). "The Politics of Palestinian Demography". Middle East Quarterly. Retrieved 5 October 2010.
- Office for the Coordination of Humanitarian Affairs. "Barrier Report July 2009. Calculation based on East Jerusalem area of 346km2 being 97% west of the barrier, and 9.5% of the West bank including East Jerusalem being in the Seam Zone" (PDF). Archived from the original (PDF) on 13 October 2009. Retrieved 5 October 2010.
- Aji, Albert (26 March 2019). "Trump acceptance of Israeli control of Golan sparks protests". Associated Press. Retrieved 29 March 2019.
- Israel Central Bureau of Statistics. "Israeli Census data" (PDF). Archived from the original (PDF) on 29 December 2009. Retrieved 5 October 2010.
- Israel Central Bureau of Statistics. "Israeli statistical Area data" (PDF). Retrieved 5 October 2010.
- "The Separation Barrier – Statistics". B'Tselem. 16 July 2012. Retrieved 5 April 2013.
- Office for the Coordination of Humanitarian Affairs. "Area C Humanitarian Response Plan Fact Sheet September 2010. Assumes 35,000 Palestinians estimated by B'Tselem to be living in the Seam Zone are included in the 150,000 OCHA estimate" (PDF). Archived from the original (PDF) on 11 October 2010. Retrieved 5 October 2010.
- CIA World Factbook. "West Bank population. Based on total area of 5,640km2 including East Jerusalem and excluding water. Figure shown calculated from other figures sourced on page". Retrieved 5 October 2010.
- CIA World Factbook. "West Bank population. Assumes CIA World Factbook number excludes Israeli settlers but includes estimated 225k Palestinians living in East Jerusalem". Retrieved 5 October 2010.
- CIA World Factbook. "Gaza Strip population. Excludes Israeli settlers, but includes estimated 225k Non-Israeli Palestinians in East Jerusalem". Retrieved 26 December 2014.
- "Structure of Local Government". Israel Ministry of Foreign Affairs. Retrieved 11 April 2008.
- "Population in the Localities 2019" (XLS). Israel Central Bureau of Statistics. Retrieved 16 August 2020.
- "Population of Jerusalem, by Age, Religion and Geographical Spreading, 2016" (PDF). www.jerusaleminstitute.org.il. Archived from the original (PDF) on 25 May 2015.
- "Population, by Population Group" (PDF). Monthly Bulletin of Statistics. Israel Central Bureau of Statistics. 31 December 2013. Archived from the original (PDF) on 3 February 2014. Retrieved 17 February 2014.
- Statistical Abstract of Israel, 2009, CBS. "Table 2.24 – Jews, by country of origin and age" (PDF). Retrieved 11 March 2019.
- Lewin-Epstein, Noah; Cohen, Yinon (18 August 2019). "Ethnic origin and identity in the Jewish population of Israel". Journal of Ethnic and Migration Studies. 45 (11): 2118–2137. doi:10.1080/1369183X.2018.1492370. ISSN 1369-183X.
- "Table 2.8 – Jews, by country of origin and age" (PDF). Israel Central Bureau of Statistics. Retrieved 11 March 2019.
- "Selected Statistics on Jerusalem Day 2007 (Hebrew)". Israel Central Bureau of Statistics. 14 May 2007. Archived from the original on 28 November 2007. Retrieved 8 October 2009.
- Ben-David, Yosef (1 July 1999). "The Bedouin in Israel". Israel Ministry of Foreign Affairs. Retrieved 5 April 2013.
- "Kababir and Central Carmel – Multiculturalism on the Carmel". Retrieved 17 February 2015.
- "Visit Haifa". Retrieved 17 February 2015.
- "Kababir". Israel and You. 3 January 2015. Archived from the original on 30 January 2015. Retrieved 17 February 2015.
- "The Christian communities in Israel". Israel Ministry of Foreign Affairs. 1 May 2014. Archived from the original on 17 October 2015. Retrieved 3 December 2014.
- "האוכלוסייה הדרוזית בישראל - לקט נתונים לרגל חג הנביא שועייב (The Druze population in Israel – a collection of data on the occasion of the Prophet Shuaib holiday)". cbs.gov.il (in Hebrew). 17 April 2019. Retrieved 8 May 2019.
- Khoury, Jack; Stern, Yoav (2 May 2007). "Balad's MK-to-be: 'Anti-Israelization' conscientious objector". Haaretz. Retrieved 18 October 2012.
- "Ministry of Interior to Admit Arameans to National Population Registry".
- Joyce M. Davis. Jerusalem’s Armenian Quarter. Catholic Near East Welfare Association.
- "Circassians in Israel". Circassian World. Archived from the original on 16 April 2013. Retrieved 5 April 2013.
- "Total Immigration to Israel, by Country of Origin".
- "Finnish associations – Embassy of Finland, Tel Aviv". Ministry for Foreign Affairs of Finland. Retrieved 5 April 2013.
- Landers, Ann (7 February 1997). "Readers Recall Heroic War Efforts". Chicago Tribune. Retrieved 5 April 2013.
- "The Worldwide Baháʼí Community". Bahai.org. Retrieved 13 July 2018.
- Nechemia Meyers (1995). "Peace to all nations – Baha'is Establish Israel's Second Holy Mountain". The World & I. Retrieved 5 March 2015
- Donald H. Harrison (3 April 1998). "The Fourth Faith". Jewish Sightseeing (Haifa, Israel). Retrieved 5 March 2015
- World Religions in America: An Introduction – Page 264, Jacob Neusner – 2003
- "35 years on, where are Israel's Vietnamese refugees?".
- "Distrust in Dimona – Magazine – Jerusalem Post". jpost.com. Retrieved 18 April 2019.
- "Israël: une visite chez les Hébreux noirs".
- Lazareva, Inna; Aviv, Tel (3 January 2015). "Black Hebrews mourn the man who led them from Chicago to Israel". The Daily Telegraph. Retrieved 11 September 2019.
- Linda Jones, Linda Jones (27 July 1997). "Linda Jones, " Claiming a Promised Land: African-American settlers in Israel are guided by idea of independent Black Hebrew Society ", The Dallas Morning News,27/07/1997 ". The Dallas Morning News.
- "הכושים העברים". yadleachim.co.il. Retrieved 18 April 2019.
- Zimmer, Carl (27 May 2016). "Tales of African-American History Found in DNA". The New York Times. ISSN 0362-4331. Retrieved 18 April 2019.
- Markowitz, Fran; Helman, Sara; Shir-Vertesh, Dafna (June 2003). "Soul Citizenship: The Black Hebrews and the State of Israel". American Anthropologist. 105 (2): 302–312. doi:10.1525/aa.2003.105.2.302. ISSN 0002-7294.
- "Illegal in Israel – The Story of Juan and Josie". 1 September 2004.
- "Israel says it is going to help more Syrian refugees from Aleppo". 21 December 2016.
- "טורקיה והכורדים: קלאב MAD". וואלה! חדשות. 2 September 2006.
- "Population in Israel and in Jerusalem, by Religion, 1988 - 2016" (PDF). Israel Central Bureau of Statistics. 4 September 2018. Retrieved 10 May 2019.
- "Israel 2010: 42% of Jews are secular". Ynetnews. 18 May 2010. Retrieved 5 April 2013.
- "The other Israeli conflict: with itself". The Christian Science Monitor. 9 July 2010.
- "At the edge of the abyss". Haaretz. 24 November 2009.
- "Why Covid-19 Has Spread Among Israel's Ultra-Orthodox". The Economist. 4 April 2020. Retrieved 2 April 2020.
- "Statistical Abstract of Israel 2016".
- "Statistical Abstract of Israel 2014 – No. 65 Subject 2 – Table No. 2".
- Orenstein, Daniel E. (2004). "Population Growth and Environmental Impact: Ideology and Academic Discourse in Israel". Population and Environment. Springer Science+Business Media. 26 (1): 41–60. doi:10.1023/B:POEN.0000039952.74913.53.
- Daniel Orenstein and Steven Hamburg."The JNF's Assault on the Negev" Archived 19 October 2007 at the Wayback Machine; The Jerusalem Report, 28 November 2005
- "Arab spouses face Israeli legal purge". The Scotsman. 15 May 2006. Retrieved 18 October 2012.
- "UN blasts Israeli marriage law". BBC News. 15 August 2003.
- "Israeli marriage law blocks citizenship for Palestinians". San Francisco Chronicle. 1 August 2003. Retrieved 18 October 2012.
- Masri, Mazen (12 February 2013). "Love Suspended". Social & Legal Studies. 22 (3): 309–334. doi:10.1177/0964663912472095. ISSN 0964-6639.
- "Ariel Sharon". Retrieved 20 October 2012.
- "Population of Israel on the Eve of 2018 – 8.8 Million". Press Release. Israel Central Bureau of Statistics. 31 December 2017. Retrieved 2 January 2018.
- "Population, by Population Group". Statistical Abstract of Israel. Israel Central Bureau of Statistics. 11 September 2012. Retrieved 5 April 2013.
- "Monthly Bulletin of Statistics for Population". Israel Central Bureau of Statistics. 7 August 2013. Retrieved 24 August 2013.
- "Home page". Israel Central Bureau of Statistics. Retrieved 20 February 2017.
- "אוכלוסייה". www.cbs.gov.il.
- הודעות לעיתונות. Cbs.gov.il. Retrieved on 8 September 2011.
- "שנתון החברה החרדית לשנת 2017". idi.org.il (in Hebrew). Retrieved 3 January 2018.
- גילו גיל גיל גיל (in Hebrew). Jerusalem Institute for Israel Studies. 1 May 2011. Retrieved 5 April 2013.
- "Population, by Population Group, Religion, Age and Sex, District and Sub-District". Statistical Abstract of Israel. Israel Central Bureau of Statistics. 11 September 2012. Retrieved 5 April 2013.
- "The Jewish-Arab demographic about-face".
- "Population".
- "Monthly Bulletin of Statistics – October 2020" (PDF). Retrieved 30 November 2020.
- "השנתון הסטטיסטי לישראל 2018" [Statistical Abstract of Israel 2018] (in Hebrew). Retrieved 7 September 2018.
- "UNSD – Demographic and Social Statistics". unstats.un.org. Retrieved 11 September 2019.
- "Developed Countries Demography". Institut National d'Études Demographiques – INED. Retrieved 4 September 2017.
- "Monthly Bulletin of Statistics – November 2020". Retrieved 4 February 2021.
- "As Israel celebrates Aliyah Day, 2019 figures point to a peak year". Israelhayom. Retrieved 5 November 2019.
- Henry Kamm. "Israeli emigration inspires anger and fear;" New York Times 4 January 1981
- Stephen J. Gold. The Israeli Diaspora; Routledge 2002, p.8
- ICBS 2005 departures and returns. Cbs.gov.il. Retrieved on 8 September 2011.
- "Life expectancy at birth, total (years) | Data". data.worldbank.org. Retrieved 26 August 2018.
- "World Population Prospects – Population Division – United Nations". esa.un.org. Archived from the original on 19 September 2016. Retrieved 26 August 2018.
- "Total Fertility Rate". The World Factbook. Central Intelligence Agency. 2013. Archived from the original on 11 August 2013. Retrieved 5 April 2013.
- "Fertility Rates, Average Age of Mother and Sex Ratio at Birth, by Selected Characteristics of the Mother". Statistical Abstract of Israel. Israel Central Bureau of Statistics. 11 September 2012. Archived from the original on 13 November 2012. Retrieved 20 October 2012.
- "The Fertility Dynamic of Israel's Ultra-Orthodox Jews and Pronatalist Governmental Policy" (PDF). Archived from the original on 27 March 2009. Retrieved 18 November 2007.CS1 maint: bot: original URL status unknown (link)
- Statistilite 133 – Women & Men in Israel – 1990–2011 Archived 16 December 2015 at the Wayback Machine, on cbs.gov.il
- "The World Factbook – Literacy". Central Intelligence Agency. Retrieved 5 August 2016.
- "Field Listing: Total Fertility Rate". The World Factbook. Retrieved 24 April 2016.
- "Country Comparison: GDP – Per Capita (PPP)". The World Factbook. Retrieved 24 April 2016.
- Peering into the crystal ball: How Israel will look, statistically, in 2035 – Haaretz
- staff, T. O. I. "Half of Israel to be Arab, ultra-Orthodox by 2059 – projections". www.timesofisrael.com.
- "Israel's demographic future: Crowded and very religious – Israel News – Jerusalem Post". www.jpost.com.
- https://www.cbs.gov.il/en/mediarelease/Pages/2017/Projections-of-Israel-Population-until-2065.aspx
- Ahituv, Netta (16 April 2017). "Forget Iran. Is the Fertility Rate the Real Threat to Israel's Existence?" – via Haaretz.
Further reading
- DellaPergola, Sergio (2001). Demography in Israel/Palestine: Trends, Prospects, Policy Implications (PDF). The Avraham Harman Institute of Contemporary Jewry. Archived from the original (PDF) on 16 January 2014. Retrieved 5 April 2013.
- Goldscheider, Calvin (2002). Israel's Changing Society: Population, Ethnicity & Development. Westview Press. ISBN 978-0-8133-3917-7.
- Tal, Alon (February 2017). "The Land Is Full: Addressing Overpopulation in Israel". Foreign Affairs. Book review by John Waterbury.
- Videos of academic lectures posted on the official YouTube VOD (video on demand) channel of Tel Aviv University:
- Rabinowitz, Dan (18 November 2012). "The Sacred Cow of Israel: The Environmental Implications of Zionism's Population Policy". (28 min)
- Dayan, Tamar (18 November 2012). "Population Increase and the Impact on Biodiversity in Israel". (16 min)
- Ehrlich, Paul; Rabinowitz, Dan; Dayan, Tamar (18 November 2012). "Questions & Answers Panel". (31 min)
External links
- Official website of the Israel Central Bureau of Statistics
- Demographics of Israel at the Jewish Virtual Library
- Population of Israel by the Tourism Ministry
- Israel. The World Factbook. Central Intelligence Agency.
- Issues in Israeli Society at the Jewish Agency for Israel
- Israel: Society and Culture at Curlie
| Israelis by Religion |
|
|---|---|
| Jews | |
| Arabs | |
| Other Semitic | |
| Other non-Semitic groups | |
| Foreign nationals | |
| |
| Sovereign states |
|
|---|---|
| States with limited recognition | |
| Dependencies and other territories |
|
| |