Latin Americans
Latin Americans (Spanish: Latinoamericanos; Portuguese: Latino-americanos; French: Latino-américains) are the citizens of the Latin American countries and dependencies. Latin American countries are multi-ethnic, home to people of different ethnic and national backgrounds. As a result, some Latin Americans do not take their nationality as an ethnicity, but identify themselves with both their nationality and their ancestral origins.[20] Aside from the indigenous Amerindian population, all Latin Americans or their ancestors immigrated since 1492. Latin America has the largest diasporas of Spaniards, Portuguese, Black Africans, Italians, Lebanese, and Japanese in the world.[21][22][23] The region also has large German (second largest after the United States),[24] French, and Jewish diasporas.
The specific ethnic and/or racial composition varies from country to country: many have a predominance of European-Amerindian, or Mestizo, population; in others, Amerindians are a majority; some are mostly inhabited by people of European ancestry; others are primarily Mulatto.[20][25] Various Black, Asian, and Zambo (mixed Black and Amerindian) minorities are also identified in most countries.[25] White Latin Americans are the largest single group.[20] Together with the people of part-European ancestry they combine for almost the totality of the population.[20]
Latin Americans and their descendants can be found almost everywhere in the world, particularly in densely populated urban areas. The most important migratory destinations for Latin Americans are found in the United States, Spain, Canada, Italy, and Japan.
Definition
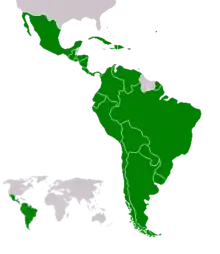
Latin America (Spanish: América Latina or Latinoamérica; Portuguese: América Latina; French: Amérique latine) is the region of the Americas where Romance languages (i.e., those derived from Latin)—particularly Spanish and Portuguese, as well as French—are primarily spoken.[26][27]
It includes more than 20 nations: Mexico in North America; Guatemala, Honduras, El Salvador, Nicaragua, Costa Rica and Panama in Central America; Colombia, Venezuela, Ecuador, Peru, Bolivia, Chile, French Guiana, Paraguay, Argentina and Uruguay in South America; Cuba, Dominican Republic, and Puerto Rico in the Caribbean—in summary, Hispanic America, in Brazil, despite having a sizeable Romance-speaking communities, Canada and the United States are almost never included in the definition, primarily for being predominantly English-speaking Anglosphere countries.
Latin America, therefore, can be defined as all those parts of the Americas that were once part of the Spanish, Portuguese, or French colonial empires,[28] namely New Spain, Colonial Brazil and New France.
Demographics
Ethnic groups

.jpg.webp)

The population of Latin America comprises a variety of ancestries, ethnic groups, and races, making the region one of the most diverse in the world. The specific composition varies from country to country: many have a predominance of European-Amerindian, or Mestizo, population; in others, Amerindian are a majority; some are dominated by inhabitants of European ancestry; and some countries' populations are primarily Mulatto. Black, Asian, and Zambo (mixed Black and Amerindian) minorities are also identified regularly. White Latin Americans are the largest single group, accounting for more than a third.[20][30]
- Asians. People of Asian descent number several million in Latin America. The first Asians to settle in the region were Filipino, as a result of Spain's trade involving Asia and the Americas. The majority of Asian Latin Americans are of Japanese or Chinese ancestry and reside mainly in Brazil and Peru; there is also a growing Chinese minority in Panama. Brazil is home to perhaps two million people of Asian descent, which includes the largest ethnic Japanese community outside Japan itself, estimated as high as 1.5 million, and circa 200,000 ethnic Chinese and 100,000 ethnic Koreans.[31][32] Ethnic Koreans also number tens of thousands of individuals in Argentina and Mexico.[33] Peru, with 1.47 million people of Asian descent,[34][35] has one of the largest Chinese communities in the world, with nearly one million Peruvians being of Chinese ancestry. There is a strong ethnic-Japanese presence in Peru, where a past president and a number of politicians are of Japanese descent. The Martiniquais population includes an African-White-Indian mixed population, and an East Indian (Asian Indian) population.[36] The Guadeloupean East Indian population is estimated at 14% of the population.
- Blacks. Millions of African slaves were brought to Latin America from the 16th century onward, the majority of whom were sent to the Caribbean region and Brazil. Today, people identified as "Black" are most numerous in Brazil (more than 10 million) and in Haiti (more than 7 million).[37] Significant populations are also found in Cuba, Dominican Republic, Puerto Rico, Panama, and Colombia. Among the Hispanic nations and Brazil, Puerto Rico leads this category in relative numbers, with a 15% ratio. Latin Americans of mixed Black and White ancestry, called Mulattoes, are far more numerous than Blacks.
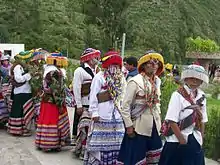
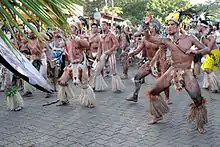
- Amerindians. The indigenous population of Latin America, the Amerindians, arrived during the Lithic stage. In post-Columbian times they experienced tremendous population decline, particularly in the early decades of colonization. They have since recovered in numbers, surpassing sixty million (by some estimates[30]), though with the growth of the other groups meanwhile, they now compose a majority only in Bolivia, and Peru. In Guatemala, the Amerindians are a large minority that comprises 41% of the population.[38] Mexico's 21% (9.8% in the official 2005 census) is the next largest ratio, and one of the largest Amerindian population in the Americas in absolute numbers. Most of the remaining countries have Amerindian minorities, in every case making up less than one-tenth of the respective country's population. In many countries, people of mixed Amerindian and European ancestry make up the majority of the population (see Mestizo).
- Mestizos. Intermixing between Europeans and Amerindians began early in the colonial period and was extensive. The resulting people, known as Mestizos, make up the majority of the population in half of the countries of Latin America. Additionally, Mestizos compose large minorities in nearly all the other mainland countries.
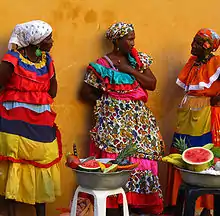
- Mulattoes. Mulattoes are people of mixed European and African ancestry, mostly descended from Spanish or Portuguese settlers on one side and African slaves on the other, during the colonial period. Brazil is home to Latin America's largest mulatto population. Mulattoes form a majority in the Spanish-speaking Caribbean places which are the Dominican Republic, Puerto Rico and depending on source, Cuba as well, and are also numerous in Nicaragua, Costa Rica, Panama, Peru, Colombia, and Ecuador. Smaller populations of mulattoes are found in other Latin American countries.[30]
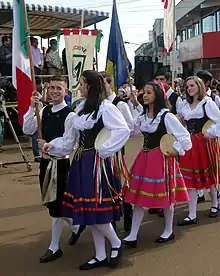
- Whites. Beginning in the late 15th century, large numbers[20] of Iberian colonists settled in what became Latin America (Portuguese in Brazil and Spaniards elsewhere in the region), and at present most white Latin Americans are of Spanish or Portuguese ancestry. Iberians brought the Spanish and Portuguese languages, the Catholic faith, and many Iberian traditions. Brazil, Argentina and Mexico contain the largest numbers of whites in Latin America in pure numbers.[20] Whites make up the majorities of Argentina, Costa Rica, and Uruguay, also, whites make up roughly half of Brazil and Chile's population as well.[20][39] Of the millions of immigrants since most of Latin America gained independence in the 1810s–1820s, Italians formed the largest group, and next were Spaniards and Portuguese.[40] Many others arrived, such as French, Germans, Greeks, Poles, Ukrainians, Russians, Croats, Serbs, Latvians, Lithuanians, English, Jews, Irish and Welsh. Also included are Middle Easterners of Lebanese, Syrian, and Palestinian descent; Most of them are Christian.[41] Whites presently compose the largest racial group in Latin America (36% in the table herein), and, whether as White, Mestizo, or Mulatto, the vast majority of Latin Americans have white ancestry.[42]
- Zambos: Intermixing between Africans and Amerindians was especially prevalent in Colombia and Brazil, often due to slaves's running away (becoming cimarrones: maroons) and being taken in by Amerindian villagers. In Spanish speaking nations, people of this mixed ancestry are known as Zambos[43] or (in Middle America), and Cafuzos in Brazil.
- Multi-ethnic/Multi-racials: In addition to the foregoing groups, Latin America also has millions of multiracial peoples (Triracial/Quadracial) of mixed European, Middle Eastern, African, Native Amerindian (Indigenous), and Asian (Japanese, Chinese, Filipino and Indian) ancestry. Most are found in Colombia, Puerto Rico, and Brazil, with a much smaller presence in other countries and parts of Mexico. In Brazil they are called Pardo. This intermixing inspired Mexican philosopher José Vasconcelos to publish an essay in 1925 titled "La Raza Cósmica" (The Cosmic Race). The essay expressed the ideology of a future "fifth race" in the Americas; an agglomeration of all the races in the world with no respect to color or number to erect a new civilization: Universópolis. Genetic studies have shown results of various degrees of admixture between various ethnic groups that has taken place throughout Latin America since the arrival of Spanish European explorers in 1492.
| Country | Population[1][2] | Amerindians | Whites | Mestizos | Mulattoes | Blacks | Zambos | Asians |
|---|---|---|---|---|---|---|---|---|
| 44,361,150 | 1.0% | 85.0% | 11.1% | 0.0% | 0.0% | 0.0% | 2.9% | |
| 11,353,142 | 55.0% | 15.0% | 28.0% | 2.0% | 0.0% | 0.0% | 0.0% | |
| 209,469,323 | 0.4% | 47.7% | 19.4% | 19.1% | 6.2% | 0.0% | 1.1%[44] | |
| 18,729,160 | 3.0% | 53.0% | 44.0% | 0.0% | 0.0% | 0.0% | 0.0% | |
| 49,661,048 | 1.8% | 37.0% | 49.0% | 10.6% | 0.9% | 0.1% | 0.0% | |
| 4,999,441 | 0.8% | 82.0% | 15.0% | 0.0% | 0.0% | 2.0% | 0.2% | |
| 11,338,134 | 0.0% | 62.0% | 0.0% | 27.6% | 11.0% | 0.0% | 1.0% | |
| 10,627,141 | 0.0% | 13.5% | 58.0% | 70.4% | 15.8% | 2.3% | 0.4% | |
| 17,084,358 | 39.0% | 9.9% | 41.0% | 5.0% | 5.0% | 0.0% | 0.1% | |
| 6,420,746 | 1.0% | 12.0% | 86.0% | 0.0% | 0.0% | 0.0% | 0.0% | |
| 17,247,849 | 39.8% | 18.5% | 41.9% | 0.0% | 0.0% | 0.2% | 0.8% | |
| 9,587,522 | 7.7% | 1.0% | 85.6% | 1.7% | 0.0% | 3.3% | 0.7% | |
| 126,190,788 | 14% | 15% | 70% | 0.5% | 0.0% | 0.0% | 0.5% | |
| 6,465,501 | 5% | 17% | 69% | 6% | 3% | 0.6% | 0.2% | |
| 4,176,869 | 8.0% | 10.0% | 32.0% | 27.0% | 5.0% | 14.0% | 4.0% | |
| 6,956,066 | 1.5% | 3.5% | 90.5% | 3.5% | 0.0% | 0.0% | 0.5% | |
| 31,989,260 | 45.5% | 12.0% | 32.0% | 9.7% | 0.0% | 0.0% | 0.8% | |
| 3,039,596 | 0.0% | 74.8% | 0.0% | 10.0% | 15.0% | 0.0% | 0.2% | |
| 11,123,178 | 0.0% | 9.0% | 0.0% | 5.0% | 86.0% | 0.0% | 1.0%[45] | |
| 3,449,285 | 0.0% | 88.0% | 4.0% | 8.0% | 0.0% | 0.0% | 0.0% | |
| 28,887,118 | 2.7% | 42.2% | 42.9% | 0.7% | 2.8% | 0.0% | 2.2% | |
| Total | 618,000,000 | 9.2% | 36.1% | 30.3% | 20.3% | 3.2% | 0.2% | 0.7% |
Note: Puerto Rico is a territory of the United States.
Ethnic groups according to self-identification
The Latinobarómetro surveys have asked respondents in 18 Latin American countries what race they considered themselves to belong to. The figures shown below are averages for 2007 through 2011.[46]
| Country | Mestizo | White | Mulatto | Black | Amerindian | Asian | Other | DK/NR1 |
|---|---|---|---|---|---|---|---|---|
| 15% | 73% | 1% | 1% | 1% | 0% | 3% | 7% | |
| 40% | 6% | 1% | 0% | 47% | 0% | 1% | 4% | |
| 18% | 45% | 15% | 15% | 2% | 2% | 0% | 2% | |
| 26% | 60% | 0% | 0% | 7% | 1% | 1% | 5% | |
| 43% | 29% | 5% | 7% | 5% | 0% | 1% | 9% | |
| 16% | 66% | 9% | 2% | 3% | 1% | 1% | 5% | |
| 28% | 16% | 23% | 25% | 5% | 2% | 0% | 2% | |
| 78% | 5% | 3% | 3% | 7% | 1% | 0% | 3% | |
| 62% | 14% | 3% | 2% | 5% | 1% | 2% | 11% | |
| 29% | 17% | 2% | 1% | 44% | 1% | 2% | 6% | |
| 61% | 9% | 3% | 3% | 12% | 2% | 1% | 10% | |
| 60% | 15% | 2% | 0% | 15% | 1% | 3% | 4% | |
| 54% | 19% | 3% | 4% | 7% | 1% | 1% | 11% | |
| 55% | 15% | 5% | 11% | 5% | 4% | 1% | 4% | |
| 36% | 35% | 1% | 1% | 2% | 0% | 4% | 20% | |
| 72% | 12% | 2% | 1% | 7% | 0% | 1% | 5% | |
| 6% | 80% | 3% | 2% | 1% | 0% | 2% | 6% | |
| 45% | 40% | 3% | 2% | 4% | 1% | 0% | 5% | |
| Weighted average2 | 34% | 33% | 8% | 6% | 11% | 0% | 2% | 7% |
1 Don't know/No response.
2 Weighted using 2011 population.
Language
Spanish and Portuguese are the predominant languages of Latin America. Spanish is the official language of most of the countries on the Latin American mainland, as well as in Puerto Rico (where it is co-official with English), Cuba and the Dominican Republic. Portuguese is spoken only in Brazil, the biggest and most populous country in the region. French is spoken in Haiti, as well as in the French overseas departments of French Guiana in South America, and Guadeloupe and Martinique in the Caribbean. Dutch is the official language of some Caribbean islands and in Suriname on the continent; however, as Dutch is a Germanic language, these territories are not considered part of Latin America.
Amerindian languages are widely spoken in Peru, Guatemala, Bolivia, Paraguay, and to a lesser degree, in Mexico, Chile and Ecuador. In Latin American countries not named above, the population of speakers of indigenous languages is small or non-existent.
In Peru, Quechua is an official language, alongside Spanish and any other indigenous language in the areas where they predominate. In Ecuador, while holding no official status, the closely related Quichua is a recognized language of the indigenous people under the country's constitution; however, it is only spoken by a few groups in the country's highlands. In Bolivia, Aymara, Quechua and Guaraní hold official status alongside Spanish. Guarani is, along with Spanish, an official language of Paraguay, and is spoken by a majority of the population (who are, for the most part, bilingual), and it is co-official with Spanish in the Argentine province of Corrientes. In Nicaragua, Spanish is the official language, but on the country's Caribbean coast English and indigenous languages such as Miskito, Sumo, and Rama also hold official status. Colombia recognizes all indigenous languages spoken within its territory as official, though fewer than 1% of its population are native speakers of these. Nahuatl is one of the 62 native languages spoken by indigenous people in Mexico, which are officially recognized by the government as "national languages" along with Spanish.
Other European languages spoken in Latin America include: English, by some groups in Argentina, Costa Rica, Nicaragua, Panama, and Puerto Rico, as well as in nearby countries that may or may not be considered Latin American, like Belize and Guyana (English is used as a major foreign language in Latin American commerce and education); German, in southern Brazil, southern Chile, Argentina, portions of northern Venezuela, and Paraguay; Italian, in Brazil, Argentina, Uruguay, and Venezuela; Polish, Ukrainian and Russian in southern Brazil, and Welsh,[47][48][49][50][51][52] in southern Argentina. Hebrew and Yiddish are used by Jewish diasporas in Argentina and Brazil.
In several nations, especially in the Caribbean region, creole languages are spoken. The most widely spoken creole language in the Caribbean and Latin America in general is Haitian Creole, the predominant language of Haiti; it is derived primarily from French and certain West African tongues with Amerindian, English, Portuguese and Spanish influences as well. Creole languages of mainland Latin America, similarly, are derived from European languages and various African tongues.
Religion
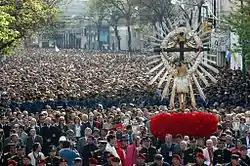
The vast majority of Latin Americans are Christians (90%),[53] mostly Roman Catholics.[54] About 71% of the Latin American population consider themselves Catholic.[55] Membership in Protestant denominations is increasing, particularly in Brazil, Guatemala, and Puerto Rico. Argentina hosts the largest communities of both Jews[56][57][58] and Muslims[59][60][61] in Latin America. Indigenous religions and rituals are practiced in countries with large Amerindian populations, especially Bolivia, Guatemala, Mexico, and Peru, and Afro-Latin American religions such as Santería, Candomblé, Umbanda, Macumba, and Vodou are practiced in countries with large Afro-Latin American populations, especially Cuba, Brazil, and Haiti. Latin America constitute in absolute terms the second world's largest Christian population, after Europe.[62]
Migration
Due to economic, social and security developments that are affecting the region in recent decades, a change has taken place from net immigration to net emigration. About 10 million Mexicans live in the United States.[63] 28.3 million Americans listed their ancestry as Mexican as of 2006.[64] During Spanish colonial times, the Spanish transported people from Peru and Mexico to serve as soldiers and colonists in the Philippines,[65] thus the Philippines has a large population (20%) that's phenotypically classified as Native American and Hispanic (Latino), as elucidated in an Inter-University Anthropology Study.[6] This, due to historical Latin-American immigration to the Philippines.[7] According to the 2005 Colombian census or DANE, about 3,331,107 Colombians currently live abroad.[66] The number of Brazilians living overseas is estimated at about 2 million people.[67] An estimated 1.5 to two million Salvadorians reside in the United States.[68] At least 1.5 million Ecuadorians have gone abroad, mainly to the United States and Spain.[69] Approximately 1.5 million Dominicans live abroad, mostly in the United States.[70] More than 1.3 million Cubans live abroad, most of them in the United States.[71] It is estimated that over 800,000 Chileans live abroad, mainly in Argentina, Canada, United States and Spain. Other Chilean nationals may be located in countries like Costa Rica, Mexico and Sweden.[72] An estimated 700,000 Bolivians were living in Argentina as of 2006 and another 33,000 in the United States.[73] Central Americans living abroad in 2005 were 3,314,300,[74] of which 1,128,701 were Salvadorans,[75] 685,713 were Guatemalans,[76] 683,520 were Nicaraguans,[77] 414,955 were Hondurans,[78] 215,240 were Panamanians,[79] 127,061 were Costa Ricans[80] and 59,110 were Belizeans.
As of 2006, Costa Rica and Chile were the only two countries with global positive migration rates.[81]
Notable Latin Americans
See also
- Argentines
- Bolivians
- Brazilians
- Californios
- Chileans
- Colombians
- Costa Ricans
- Cubans
- Dekasegi
- Dominicans
- Ecuadorians
- Guatemalans
- Haitians
- History of Latin America
- Latin American culture
- Latinos
- Los Angeles, California
- Mexicans
- Miami
- Neomexicanos
- Nuyoricans (New York City)
- Panamanians
- Paraguayans
- Peruvians
- Puerto Ricans
- Québécois people
- Salvadorans
- Tejanos
- Uruguayans
- Venezuelans
References
- ""World Population prospects – Population division"". population.un.org. United Nations Department of Economic and Social Affairs, Population Division. Retrieved November 9, 2019.
- ""Overall total population" – World Population Prospects: The 2019 Revision" (xslx). population.un.org (custom data acquired via website). United Nations Department of Economic and Social Affairs, Population Division. Retrieved November 9, 2019.
- Based on recent estimates, as of 2010. Sources by country: Australia Australian Bureau of Statistics 20680-Ancestry (full classification list) by Sex - Australia;
Canada 2006 census[http://www12.startacan.ca/english/census06/data/highlights/ethnic/pages/Page.cfm///////
Lang=E&Geo=CMA&Code=01&Table=1&Data=Count&StartRec=1&Sort=2&Display=Page "Ethnocultural Portrait of Canada Highlight Tables, 2006 Census"] Check
|url=value (help). Statistics Canada. Retrieved 2008-05-10. line feed character in|url=at position 88 (help); Sweden Portugal POPULAÇÃO ESTRANGEIRA EM TERRITÓRIO NACIONAL, SERVIÇODE ESTRANGEIROS E FRONTEIRAS 2008; Spain INE, Revisión del Padrón municipal 2007. Datos a nivel nacional, comunidad autónoma y provincia. (in Spanish); INE, Notas de Prensa 2008 (in Spanish); USA (Self-identified ethnicity rather than birthplace) "Detailed Hispanic Origin: 2007" (PDF). Pew Hispanic Center. Retrieved 2009-04-13.; "United States - Selected Population Profile in the United States (Brazilian (360-364))". 2008 American Community Survey 1-Year Estimates. United States Census Bureau. Archived from the original on 2020-02-12. Retrieved 2010-03-16. - (Self-identified ethnicity rather than birthplace) "Detailed Hispanic Origin: 2007" (PDF). Pew Hispanic Center. Archived from the original (PDF) on 2009-05-01. Retrieved 2009-04-13.
- "United States - Selected Population Profile in the United States (Brazilian (360-364))". 2008 American Community Survey 1-Year Estimates. United States Census Bureau. Archived from the original on 2020-02-12. Retrieved 2010-03-16.
- An Inter-University Study published in the Journal of Forensic Anthropology concluded that the bodies curated by the University of the Philippines, representing the country, showed the percentage of the population that's phenotypically classified as Hispanic is 12.7%, while that of Indigenous American is 7.3%. Thus totaling to 20% of the sample representative of the Philippines as Latino in physical appearance.Go, Matthew (2019). "Classification Trends among Contemporary Filipino Crania Using Fordisc 3.1". Human Biology. University of Florida Press. 2 (4): 1–11. doi:10.5744/fa.2019.1005. Retrieved September 13, 2020.
[Page 1] ABSTRACT: Filipinos represent a significant contemporary demographic group globally, yet they are underrepresented in the forensic anthropological literature. Given the complex population history of the Philippines, it is important to ensure that traditional methods for assessing the biological profile are appropriate when applied to these peoples. Here we analyze the classification trends of a modern Filipino sample (n = 110) when using the Fordisc 3.1 (FD3) software. We hypothesize that Filipinos represent an admixed population drawn largely from Asian and marginally from European parental gene pools, such that FD3 will classify these individuals morphometrically into reference samples that reflect a range of European admixture, in quantities from small to large. Our results show the greatest classification into Asian reference groups (72.7%), followed by Hispanic (12.7%), Indigenous American (7.3%), African (4.5%), and European (2.7%) groups included in FD3. This general pattern did not change between males and females. Moreover, replacing the raw craniometric values with their shape variables did not significantly alter the trends already observed. These classification trends for Filipino crania provide useful information for casework interpretation in forensic laboratory practice. Our findings can help biological anthropologists to better understand the evolutionary, population historical, and statistical reasons for FD3-generated classifications. The results of our studyindicate that ancestry estimation in forensic anthropology would benefit from population-focused research that gives consideration to histories of colonialism and periods of admixture.
- "Filipino-Mexican-Central-and-South American Connection, Tales of Two Sisters: Manila and Mexico". June 21, 1997. Retrieved January 1, 2021.
Tomás de Comyn, general manager of the Compañia Real de Filipinas, in 1810 estimated that out of a total population of 2,515,406, "the European Spaniards, and Spanish creoles and mestizos do not exceed 4,000 persons of both sexes and all ages, and the distinct castes or modifications known in America under the name of mulatto, quarteroons, etc., although found in the Philippine Islands, are generally confounded in the three classes of pure Indians, Chinese mestizos and Chinese." In other words, the Mexicans who had arrived in the previous century had so intermingled with the local population that distinctions of origin had been forgotten by the 19th century. The Mexicans who came with Legázpi and aboard succeeding vessels had blended with the local residents so well that their country of origin had been erased from memory.
- (Page 10) Pérez, Marilola (2015). Cavite Chabacano Philippine Creole Spanish: Description and Typology (PDF) (PhD). University of California, Berkeley. Archived from the original on 14 January 2021.
The galleon activities also attracted a great number of Mexican men that arrived from the Mexican Pacific coast as ships’ crewmembers (Grant 2009: 230). Mexicans were administrators, priests and soldiers (guachinangos or hombres de pueblo) (Bernal 1964: 188) many though, integrated into the peasant society, even becoming tulisanes ‘bandits’ who in the late 18th century “infested” Cavite and led peasant revolts (Medina 2002: 66). Meanwhile, in the Spanish garrisons, Spanish was used among administrators and priests. Nonetheless, there is not enough historical information on the social role of these men. In fact some of the few references point to a quick integration into the local society: “los hombres del pueblo, los soldados y marinos, anónimos, olvidados, absorbidos en su totalidad por la población Filipina.” (Bernal 1964: 188). In addition to the Manila-Acapulco galleon, a complex commercial maritime system circulated European and Asian commodities including slaves. During the 17th century, Portuguese vessels traded with the ports of Manila and Cavite, even after the prohibition of 1644 (Seijas 2008: 21). Crucially, the commercial activities included the smuggling and trade of slaves: “from the Moluccas, and Malacca, and India… with the monsoon winds” carrying “clove spice, cinnamon, and pepper and black slaves, and Kafir [slaves]” (Antonio de Morga cf Seijas 2008: 21).” Though there is no data on the numbers of slaves in Cavite, the numbers in Manila suggest a significant fraction of the population had been brought in as slaves by the Portuguese vessels. By 1621, slaves in Manila numbered 1,970 out of a population of 6,110. This influx of slaves continued until late in the 17th century; according to contemporary cargo records in 1690, 200 slaves departed from Malacca to Manila (Seijas 2008: 21). Different ethnicities were favored for different labor; Africans were brought to work on the agricultural production, and skilled slaves from India served as caulkers and carpenters.
- Foreign population in Spain (2009), Spanish National Statistics Institute press report. June 3, 2009. (Spanish)
- 2006 census"Ethnocultural Portrait of Canada Highlight Tables, 2006 Census". Statistics Canada. Retrieved 2008-05-10.
- http://www.migrantitorino.it/?p=25726
- "Registered Foreigners in Japan by Nationality" (PDF). Statistics Bureau. Archived from the original (PDF) on 24 August 2005. Retrieved 7 November 2011.
- "Francia - Emigrantes totales". Retrieved 31 October 2019.
- "Alemania - Emigrantes totales". Retrieved 20 June 2019.
- "No Longer Invisible: The Latin American community in London" (PDF). Trust for London. Archived from the original (PDF) on 21 March 2012. Retrieved 19 May 2011.
- POPULAÇÃO ESTRANGEIRA EM TERRITÓRIO NACIONAL, SERVIÇO DE ESTRANGEIROS E FRONTEIRAS 2008;
- "Redirect to Census data page". abs.gov.au. Retrieved 22 September 2015.
- http://www.statistikdatabasen.scb.se/pxweb/en/ssd/START__BE__BE0101__BE0101E/FodelselandArK/table/tableViewLayout1/?rxid=86abd797-7854-4564-9150-c9b06ae3ab07c9b06ae3ab07
- The Latin American Socio-Religious Studies Program / Programa Latinoamericano de Estudios Sociorreligiosos (PROLADES) PROLADES Religion in America by country
- Lizcano Fernández, Francisco (May–August 2005). "Composición Étnica de las Tres Áreas Culturales del Continente Americano al Comienzo del Siglo XXI" (PDF). Convergencia (in Spanish). Mexico: Universidad Autónoma del Estado de México, Centro de Investigación en Ciencias Sociales y Humanidades. 38: 185–232, table on p. 218. ISSN 1405-1435. Archived from the original (PDF) on 2008-09-20.
- Pozzetta, George E., Bruno Ramirez, and Robert F. Harney. The Italian Diaspora: Migration across the Globe. Toronto: Multicultural History Society of Ontario, 1992.
- King, Russell (1978-01-01). "Report: The Italian Diaspora". Area. 10 (5): 386. JSTOR 20001401.
- "Fact Sheet 3. Brazil - the Country and its People" (PDF). Embassy of Brazil in London - Schools' Pack, Brazil 2009. 2009. Archived from the original (PDF) on 26 December 2011.
- Wilhelm Bleek (2003). "Auslandsdeutsche" [Germans abroad] (in German). German Federal Agency for Civic Education. Archived from the original on 2011-03-10.
- "América Latina". . External link in
|publisher=(help) - Colburn, Forrest D (2002). Latin America at the End of Politics. Princeton University Press. ISBN 0-691-09181-1.
- "Latin America."The New Oxford Dictionary of English. Pearsall, J., ed. 2001. Oxford, UK: Oxford University Press; p. 1040: "The parts of the American continent where Spanish or Portuguese is the main national language (i.e.Mexico and, in effect, the whole of Central and South America including many of the Caribbean islands)."
- Rangel, Carlos (1977). The Latin Americans: Their Love-Hate Relationship with the United States. New York: Harcourt Brace Jovanovich. pp. 3–5. ISBN 0-15-148795-2. Skidmore, Thomas E.; Peter H. Smith (2005). Modern Latin America (6 ed.). Oxford and New York: Oxford University Press. pp. 1–10. ISBN 0-19-517013-X.
- Departamento de Derecho y Ciencias Políticas de la Universidad Nacional de La Matanza (14 November 2011). "Historias de inmigrantes italianos en Argentina" (in Spanish). infouniversidades.siu.edu.ar.
Se estima que en la actualidad, el 90% de la población argentina tiene alguna ascendencia europea y que al menos 25 millones están relacionados con algún inmigrante de Italia.
- "CIA — The World Factbook -- Field Listing — Ethnic groups". Retrieved 2008-02-20.
- Shoji, Rafael (2004), "Reinterpretação do Budismo Chinês e Coreano no Brasil" (PDF), Revista de Estudos da Religião (Nº 3), pp. 74–87, ISSN 1677-1222, retrieved 2010-06-02
- "Japan-Brazil Relations". Ministry of Foreign Affairs of Japan. Retrieved 22 September 2015.
- 재외동포현황/Current Status of Overseas Compatriots, South Korea: Ministry of Foreign Affairs and Trade, 2009, archived from the original on 2010-10-23, retrieved 2009-05-21
- ":: Overseas Compatriot Affairs Commission, R.O.C. ::". Ocac.gov.tw. 2004-08-24. Archived from the original on 2013-11-23. Retrieved 2010-07-26.
- "DESAFIOS-QUE-NOS-ACERCAN — Noticias — Universia Perú". Univeria.edu.pe. Archived from the original on 2009-04-15. Retrieved 2010-07-26.
- "The World Factbook". USA: CIA. 2003. Retrieved 2013-09-23.
- "La trata de negros". Retrieved 22 September 2015.
- https://www.censopoblacion.gt/dondeestamos
- "Resultado Básico del XIV Censo Nacional de Población y Vivienda 2011" (PDF) (in Spanish). Ine.gov.ve. p. 14. Retrieved 2012-11-25.
- "South America :: Postindependence overseas immigrants". Britannica Online Encyclopedia. Retrieved 2008-02-10.
- "En detrimento de Israel - Acercamiento arabe a America Latina por Natalio Steiner, co-director de Comunidades - Periódico Judío Independiente". delacole.com. Retrieved 22 September 2015.
- "Latinoamérica". Retrieved 2013-09-23.
- Stranded in Paradise: Shipwrecked Hundreds of Years Ago, the Garifuna Are Still Trying to Find Their Way by Teresa Wiltz, The Washington Post.
- "Cor ou Raça" (PDF). Censo Demográfico 2010: Características gerais da população, religião e pessoas com deficiência. Instituto Brasileiro de Geografia e Estatística. 2010. Retrieved 5 October 2013.
- "Atlas Sociodemografico y de la Desigualdad en Uruguay, 2011: Ancestry" (PDF) (in Spanish). National Institute of Statistics. Archived from the original (PDF) on 8 September 2014.
- Informe Latinobarómetro, Latinobarómetro.
- Not Panicking Ltd (21 November 2011). "h2g2 - Y Wladfa - The Welsh in Patagonia - Edited Entry". bbc.co.uk. Retrieved 22 September 2015.
- "The Welsh Immigration to Argentina". 1stclassargentina.com. Retrieved 22 September 2015.
- Jeremy Howat. "Opening page: The Welsh in Patagonia". argbrit.org. Retrieved 22 September 2015.
- "Gaiman, Trelew y Rawson". patagonline.com. Retrieved 22 September 2015.
- "Y Wladfa - Patagonia". andesceltig.com. Archived from the original on 17 September 2017. Retrieved 22 September 2015.
- "Reference for Welsh language in southern Argentina, Welsh immigration to Patagonia". Archived from the original on 2016-08-08. Retrieved 2010-07-05.
- "Christians". Pew Research Center's Religion & Public Life Project. 18 December 2012. Retrieved 22 September 2015.
- "CIA — The World Factbook -- Field Listing — Religions". Retrieved 2009-03-17.
- Fraser, Barbara J., In Latin America, Catholics down, church's credibility up, poll says Catholic News Service June 23, 2005
- LeElef, Ner. "World Jewish Population". Retrieved 2008-01-09.
- The Jewish People Policy Planning Institute; Annual Assessment, 2007
- United Jewish Communities; Global Jewish Populations Archived 2008-05-31 at the Wayback Machine
- "Argentina". U.S. Department of State. Retrieved 22 September 2015.
- "Argentina". U.S. Department of State. Retrieved 22 September 2015.
- "BBC Mundo - A fondo - Árabes y musulmanes en América Latina". bbc.co.uk. Retrieved 22 September 2015.
- "The Global Religious Landscape" (PDF). Pewforum.org. Archived from the original (PDF) on 25 January 2017. Retrieved 7 May 2020.
- Watching Over Greater Mexico: Mexican Migration Policy and Governance of Mexicanos Abroad
- United States Census Bureau. "U.S. Census website". 2006 American Community Survey. Retrieved 2007-12-15.
- Mawson, Stephanie J. (June 15, 2016). "Convicts or Conquistadores? Spanish Soldiers in the Seventeenth-Century Pacific". Past & Present. Oxford Academic. 232: 87–125. doi:10.1093/pastj/gtw008. Retrieved July 28, 2020.
- Archived January 31, 2009, at the Wayback Machine
- Brasileiros no Exterior — Portal da Câmara dos Deputados Archived July 21, 2009, at the Wayback Machine
- Country Overview: El Salvador Archived January 1, 2010, at the Wayback Machine, United States Agency for International Development
- Chavistas in Quito, Forbes.com, January 7, 2008
- "Dominican Republic: Remittances for Development". ipsnews.net. Archived from the original on 10 June 2011. Retrieved 22 September 2015.
- Cubans Abroad, Radiojamaica.com
- Chile: Moving Towards a Migration Policy, Migration Information Source
- "South America: Brazil, Mercosur - Migration News - Migration Dialogue". ucdavis.edu. Retrieved 22 September 2015.
- "Prospects - Migration and Remittances Factbook 2011". worldbank.org. Archived from the original on 8 December 2015. Retrieved 22 September 2015.
- "Latin America & Caribbean (ElSalvador)" (PDF). World Bank. 2006. Retrieved 2010-07-26.
- "Latin America & Caribbean (Guatemala)" (PDF). World Bank. 2006. Retrieved 2010-07-26.
- "Latin America & Caribbean (Nicaragua)" (PDF). World Bank. 2006. Retrieved 2010-07-26.
- "Latin America & Caribbean (Honduras)" (PDF). World Bank. 2006. Retrieved 2010-07-26.
- "Latin America & Caribbean (Panama)" (PDF). World Bank. 2006. Retrieved 2010-07-26.
- "Latin America & Caribbean (CostaRica)" (PDF). World Bank. 2006. Retrieved 2010-07-26.
- United Nations Population Division