List of Parliamentary constituencies in Dorset
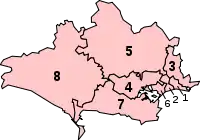
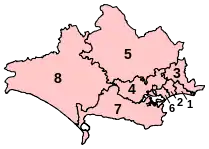
The ceremonial county of Dorset (which comprises the unitary authorities of Dorset, and Bournemouth, Christchurch and Poole) is divided into 8 Parliamentary constituencies - 3 Borough constituencies and 5 County constituencies.
Constituencies
† Conservative ‡ Labour ¤ Liberal Democrat
| Constituency[nb 1] | Electorate[1] | Majority[2][nb 2] | Member of Parliament[2] | Nearest opposition[2] | Map | ||
|---|---|---|---|---|---|---|---|
| Bournemouth East BC | 74,125 | 8,806 | Tobias Ellwood† | Corrie Drew‡ |  | ||
| Bournemouth West BC | 74,205 | 10,150 | Conor Burns† | David Stokes‡ | 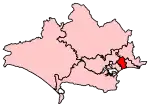 | ||
| Christchurch CC | 71,520 | 24,617 | Christopher Chope† | Mike Cox¤ | 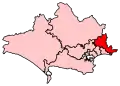 | ||
| Mid Dorset and North Poole CC | 65,427 | 14,898 | Michael Tomlinson† | Vikki Slade¤ | 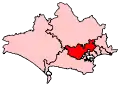 | ||
| North Dorset CC | 76,765 | 24,301 | Simon Hoare† | David Chadwick¤ | 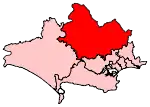 | ||
| Poole BC | 73,989 | 19,116 | Robert Syms† | Sue Aitkenhead‡ | 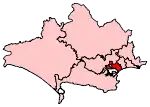 | ||
| South Dorset CC | 73,809 | 17,153 | Richard Drax† | Carralyn Parkes‡ | 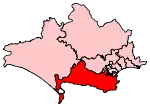 | ||
| West Dorset CC | 81,897 | 14,106 | Chris Loder† | Edward Morello¤ | 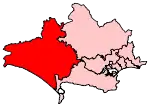 | ||
Boundary changes
The Boundary Commission for England decided to retain Dorset's constituencies for the 2010 election, making minor changes to realign constituency boundaries with the boundaries of current local government wards, and to reduce the electoral disparity between constituencies.
| Name | Current boundaries | Proposed revision |
|---|---|---|
 Parliamentary constituencies in Dorset |
 Proposed Revision | |
Proposed boundary changes
The Boundary Commission for England submitted their final proposals in respect of the Sixth Periodic Review of Westminster Constituencies (the 2018 review) in September 2018. Although the proposals were immediately laid before Parliament they were not brought forward by the Government for approval. Accordingly, they did not come into effect for the 2019 election which took place on 12 December 2019, and which was contested using the constituency boundaries in place since 2010.
Under the terms of the Parliamentary Voting System and Constituencies Act 2011, the Sixth Review was based on reducing the total number of MPs from 650 to 600 and a strict electoral parity requirement that the electorate of all constituencies should be within a range of 5% either side of the electoral quota.
On 24 March 2020, the Minister of State for the Cabinet Office, Chloe Smith, issued a written statement to Parliament setting out the Government's thinking with regard to parliamentary boundaries.[3] Subsequently, the Parliamentary Constituencies Act 2020[4] was passed into law on 14 December 2020. This formally removed the duty to implement the 2018 review and set out the framework for future boundary reviews. The Act provided that the number of constituencies should remain at the current level of 650, rather than being reduced to 600, while retaining the requirement that the electorate should be no more than +/- 5% from the electoral quota.
The Act specified that the next review should be completed no later than 1 July 2023 and the Boundary Commission formally launched the 2023 Review on 5 January 2021.[5] See 2023 Periodic Review of Westminster constituencies for further details.
Results history
Primary data source: House of Commons research briefing - General election results from 1918 to 2019[6]
2019
The number of votes cast for each political party who fielded candidates in constituencies comprising Dorset in the 2019 general election were as follows:
| Party | Votes | % | Change from 2017 | Seats | Change from 2017 |
|---|---|---|---|---|---|
| Conservative | 241,835 | 58.3% | 8 | 0 | |
| Liberal Democrats | 78,414 | 18.9% | 0 | 0 | |
| Labour | 76,310 | 18.4% | 0 | 0 | |
| Greens | 16,020 | 3.9% | 0 | 0 | |
| Others | 2,094 | 0.5% | 0 | 0 | |
| Total | 414,673 | 100.0 | 8 |
Percentage votes
Note that before 1983 Dorset did not include the Bournemouth and Christchurch areas (see below).
| Election year | 1922 | 1923 | 1924 | 1929 | 1931 | 1935 | 1945 | 1950 | 1951 | 1955 | 1959 | 1964 | 1966 | 1970 | 1974(F) | 1974(O) | 1979 | 1983 | 1987 | 1992 | 1997 | 2001 | 2005 | 2010 | 2015 | 2017 | 2019 |
|---|---|---|---|---|---|---|---|---|---|---|---|---|---|---|---|---|---|---|---|---|---|---|---|---|---|---|---|
| Conservative | 39.1 | 51.7 | 60.1 | 46.2 | 56.8 | 54.0 | 45.2 | 47.6 | 52.2 | 53.9 | 52.4 | 46.6 | 47.3 | 54.2 | 48.1 | 48.0 | 58.4 | 58.6 | 57.8 | 54.5 | 41.8 | 45.3 | 44.1 | 48.3 | 51.7 | 58.7 | 58.3 |
| Labour | 21.4 | 19.4 | 18.0 | 17.0 | 12.3 | 16.0 | 30.8 | 37.9 | 32.0 | 32.6 | 28.7 | 29.8 | 32.5 | 28.8 | 21.0 | 23.6 | 20.4 | 10.2 | 11.3 | 13.4 | 18.8 | 21.1 | 18.3 | 12.2 | 13.0 | 25.2 | 18.4 |
| Liberal Democrat1 | 18.0 | 28.9 | 21.9 | 36.8 | 16.3 | 28.7 | 24.0 | 14.5 | 15.8 | 13.6 | 18.9 | 23.6 | 20.2 | 17.0 | 30.9 | 28.4 | 20.9 | 29.7 | 30.8 | 31.2 | 34.1 | 31.5 | 32.8 | 32.8 | 12.9 | 12.8 | 18.9 |
| Green Party | - | - | - | - | - | - | - | - | - | - | - | - | - | - | - | - | - | - | * | * | * | * | * | 0.5 | 5.3 | 2.6 | 3.9 |
| UKIP | - | - | - | - | - | - | - | - | - | - | - | - | - | - | - | - | - | - | - | - | * | * | * | 5.6 | 16.2 | 0.3 | * |
| Other | 21.5 | - | - | - | 14.6 | 1.4 | - | - | - | - | - | - | - | - | - | - | 0.3 | 1.4 | 0.1 | 0.9 | 5.3 | 2.1 | 4.7 | 0.6 | 0.9 | 0.4 | 0.5 |
11950-1979: Liberal Party; 1983 & 1987 - SDP-Liberal Alliance
* Included in Other
Accurate vote percentages are not applicable for the 1918 election because one candidate stood unopposed.
Seats
| Election year | 1950-1979 | 1983-1992 | 1997 | 2001-2005 | 2010 | 2015-2019 |
|---|---|---|---|---|---|---|
| Conservative | 4 | 7 | 8 | 6 | 7 | 8 |
| Labour | 0 | 0 | 0 | 1 | 0 | 0 |
| Liberal Democrat1 | 0 | 0 | 0 | 1 | 1 | 0 |
| Total | 4 | 7 | 8 | 8 | 8 | 8 |
11950-1979: Liberal Party; 1983 & 1987 - SDP-Liberal Alliance
Maps
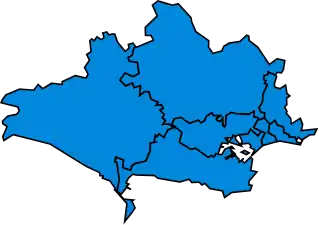 1997
1997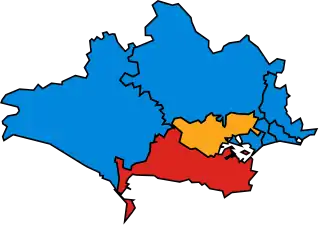 2001
2001- 2005
 2010
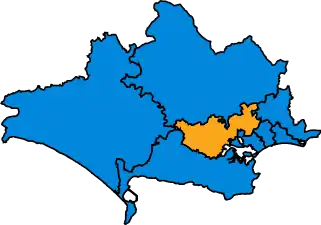
2010 2015
2015- 2017
- 2019
Historical representation by party
A cell marked → (with a different colour background to the preceding cell) indicates that the previous MP continued to sit under a new party name.
1885 to 1950
Coalition Liberal (1918-22) / National Liberal (1922-23) Conservative Independent Conservative Liberal
| Constituency | 1885 | 1886 | 91 | 1892 | 95 | 1895 | 1900 | 04 | 05 | 1906 | Jan 10 | Dec 10 | 1918 | 1922 | 23 | 1923 | 1924 | 1929 | 1931 | 1935 | 37 | 41 | 1945 |
|---|---|---|---|---|---|---|---|---|---|---|---|---|---|---|---|---|---|---|---|---|---|---|---|
| Dorset East | Glyn | Bond | Napier Sturt | Lyell | H. Guest1 | F. Guest | → | Caine | → | Glassey | Caine | Wheatley | |||||||||||
| Dorset North | Portman | Wingfield-Digby | Wills | Baker | Colfox | Emlyn-Jones | Hanbury | A. Hambro | Byers | ||||||||||||||
| Dorset South | Sturgis | C. Hambro | Brymer | Scarisbrick | A. Hambro | Yerburgh | Gascoyne-Cecil | Montagu | |||||||||||||||
| Dorset West | Farquharson | Williams | Colfox | Digby | |||||||||||||||||||
1original candidate, F. Guest (Lib), disqualified; fresh by-election held June 1910
1950 to 1983
| Constituency | 1950 | 1951 | 1955 | 57 | 1959 | 62 | 1964 | 1966 | 1970 | Feb 1974 | Oct 1974 | 1979 |
|---|---|---|---|---|---|---|---|---|---|---|---|---|
| Dorset North | Crouch | Glyn | James | Baker | ||||||||
| Dorset South | Montagu | Barnett | King | Gascoyne-Cecil | ||||||||
| Dorset West | Digby | Spicer | ||||||||||
| Poole | Wheatley | Pilkington | Murton | Ward | ||||||||
1983 to present (7, then 8 MPs)
Conservative Independent Labour Liberal Democrats
| Constituency | 1983 | 1987 | 1992 | 93 | 1997 | 2001 | 2005 | 2010 | 2015 | 2017 | 19 | 2019 |
|---|---|---|---|---|---|---|---|---|---|---|---|---|
| Bournemouth East | Atkinson | Ellwood | ||||||||||
| Bournemouth West | Butterfill | Burns | ||||||||||
| Christchurch | Adley | Maddock | Chope | |||||||||
| Mid Dorset and North Poole | Fraser | Brooke | Tomlinson | |||||||||
| North Dorset | Baker | Walter | Hoare | |||||||||
| Poole | Ward | Syms | ||||||||||
| South Dorset | Gascoyne-Cecil | Bruce | Knight | Drax | ||||||||
| West Dorset | Spicer | Letwin | → | Loder | ||||||||
Notes
- BC denotes borough constituency, CC denotes county constituency.
- The majority is the number of votes the winning candidate receives more than their nearest rival.
References
- Baker, Carl; Uberoi, Elise; Cracknell, Richard (2020-01-28). "General Election 2019: full results and analysis". Cite journal requires
|journal=(help) - "Constituencies A-Z - Election 2019". BBC News. Retrieved 2020-04-25.
- "Update: Strengthening Democracy:Written statement - HCWS183". UK Parliament. Retrieved 2020-04-20.
- "Parliamentary Constituencies Act 2020".
- "2023 Review launched | Boundary Commission for England". Retrieved 2021-01-08.
- Watson, Christopher; Uberoi, Elise; Loft, Philip (2020-04-17). "General election results from 1918 to 2019". Cite journal requires
|journal=(help)
Template:Dorset constituencies