List of Parliamentary constituencies in Norfolk
The county of Norfolk is divided into 9 Parliamentary constituencies - 2 Borough constituencies and 7 County constituencies.
Constituencies
Conservative † Labour ‡ Liberal Democrat ¤
| Constituency[nb 1] | Electorate[1] | Majority[2][nb 2] | Member of Parliament[2] | Nearest opposition[2] | Map | ||
|---|---|---|---|---|---|---|---|
| Broadland CC | 78,151 | 21,861 | Jerome Mayhew † | Jess Barnard ‡ | 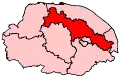 | ||
| Great Yarmouth CC | 71,957 | 17,663 | Brandon Lewis † | Mike Smith-Clare ‡ | 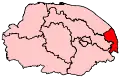 | ||
| Mid Norfolk CC | 82,203 | 22,594 | George Freeman † | Adrian Heald ‡ | 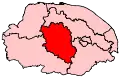 | ||
| North Norfolk CC | 70,729 | 14,395 | Duncan Baker † | Karen Ward ¤ | 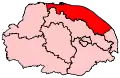 | ||
| North West Norfolk CC | 72,080 | 19,922 | James Wild † | Jo Rust ‡ | 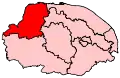 | ||
| Norwich North BC | 67,172 | 4,738 | Chloe Smith † | Karen Davis ‡ | 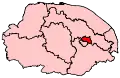 | ||
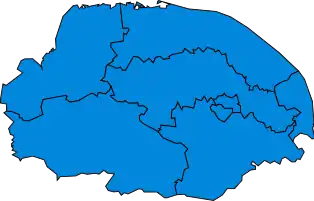
| Norwich South BC | 77,845 | 12,760 | Clive Lewis ‡ | Mike Spencer † | 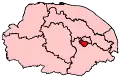 | ||
| South Norfolk CC | 86,214 | 21,275 | Richard Bacon † | Beth Jones ‡ | 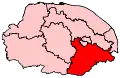 | ||
| South West Norfolk CC | 78,455 | 26,195 | Elizabeth Truss † | Emily Blake ‡ | 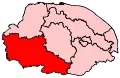 | ||
2010 boundary review
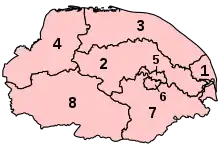
In the Fifth Review the Boundary Commission for England recommended that Norfolk's representation be increased to 9 MPs, with the creation of the constituency of Broadland, based on the District of Broadland wards which had previously comprised a majority of Mid Norfolk, as well as Drayton and Taversham, transferred back from Norwich North. It also included Fakenham and surrounding areas, transferred once again from North Norfolk. Mid Norfolk now comprised the District of Breckland wards in the previous version of the constituency with additional wards, including Watton and Attleborough, transferred from South West Norfolk. Six District of South Norfolk wards, including Wymondham, were transferred from the constituency of South Norfolk. Cringleford and Colney (but not New Costessey) were transferred back from Norwich South to South Norfolk and a small area in the south-west of the constituency of North West Norfolk was transferred to South West Norfolk.
| Name | Boundaries 1997–2010 | Name | Boundaries 2010-present |
|---|---|---|---|
 Parliamentary constituencies in Norfolk |
 | ||
Proposed boundary changes
The Boundary Commission for England submitted their final proposals in respect of the Sixth Periodic Review of Westminster Constituencies (the 2018 review) in September 2018. Although the proposals were immediately laid before Parliament they were not brought forward by the Government for approval. Accordingly, they did not come into effect for the 2019 election which took place on 12 December 2019, and which was contested using the constituency boundaries in place since 2010.
Under the terms of the Parliamentary Voting System and Constituencies Act 2011, the Sixth Review was based on reducing the total number of MPs from 650 to 600 and a strict electoral parity requirement that the electorate of all constituencies should be within a range of 5% either side of the electoral quota.
On 24 March 2020, the Minister of State for the Cabinet Office, Chloe Smith, issued a written statement to Parliament setting out the Government's thinking with regard to parliamentary boundaries.[3] Subsequently, the Parliamentary Constituencies Act 2020[4] was passed into law on 14 December 2020. This formally removed the duty to implement the 2018 review and set out the framework for future boundary reviews. The Act provided that the number of constituencies should remain at the current level of 650, rather than being reduced to 600, while retaining the requirement that the electorate should be no more than +/- 5% from the electoral quota.
The Act specified that the next review should be completed no later than 1 July 2023 and the Boundary Commission formally launched the 2023 Review on 5 January 2021.[5] See 2023 Periodic Review of Westminster constituencies for further details.
Results history
Primary data source: House of Commons research briefing - General election results from 1918 to 2019[6]
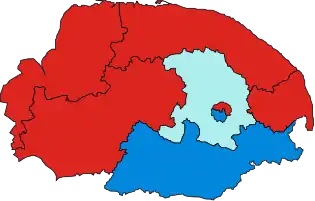
2019
The number of votes cast for each political party who fielded candidates in constituencies comprising Norfolk in the 2019 general election were as follows:
| Party | Votes | % | Change from 2017 | Seats | Change from 2017 |
|---|---|---|---|---|---|
| Conservative | 268,165 | 57.6% | 8 | ||
| Labour | 120,780 | 25.9% | 1 | 0 | |
| Liberal Democrats | 57,966 | 12.4% | 0 | ||
| Greens | 11,812 | 2.5% | 0 | 0 | |
| Brexit | 3,395 | 0.7% | new | 0 | 0 |
| Others | 3,840 | 0.9% | 0 | 0 | |
| Total | 465,958 | 100.0 | 9 |
Percentage votes
| Election year | 1950 | 1951 | 1955 | 1959 | 1964 | 1966 | 1970 | 1974
(Feb) |
1974
(Oct) |
1979 | 1983 | 1987 | 1992 | 1997 | 2001 | 2005 | 2010 | 2015 | 2017 | 2019 |
|---|---|---|---|---|---|---|---|---|---|---|---|---|---|---|---|---|---|---|---|---|
| Conservative1 | 44.2 | 50.4 | 50.5 | 50.6 | 47.8 | 47.7 | 51.4 | 42.7 | 43.3 | 50.9 | 49.7 | 51.0 | 49.2 | 36.7 | 41.6 | 39.9 | 43.1 | 44.9 | 52.7 | 57.6 |
| Labour | 46.9 | 49.6 | 49.5 | 47.3 | 46.8 | 51.0 | 43.6 | 35.3 | 38.9 | 35.7 | 22.0 | 22.9 | 31.2 | 39.9 | 35.5 | 30.0 | 19.0 | 22.7 | 33.4 | 25.9 |
| Liberal Democrat2 | 8.8 | - | - | 2.1 | 5.3 | 1.3 | 4.8 | 21.7 | 17.7 | 12.8 | 27.9 | 25.8 | 18.6 | 18.2 | 19.6 | 25.4 | 27.8 | 10.3 | 10.0 | 12.4 |
| Green Party | - | - | - | - | - | - | - | - | - | - | - | * | * | * | * | * | 3.2 | 5.1 | 1.6 | 2.5 |
| UKIP | - | - | - | - | - | - | - | - | - | - | - | - | - | * | * | * | 4.6 | 17.0 | 2.3 | * |
| Brexit Party | - | - | - | - | - | - | - | - | - | - | - | - | - | - | - | - | - | - | - | 0.7 |
| Other | - | - | - | - | 0.1 | - | 0.2 | 0.3 | 0.1 | 0.6 | 0.3 | 0.2 | 1.0 | 5.1 | 3.3 | 4.7 | 2.3 | 0.1 | 0.1 | 0.8 |
1Includes National Liberal Party up to 1966
21950-1979 - Liberal; 1983 & 1987 - SDP-Liberal Alliance
* Included in Other
Seats
| Election year | 1950 | 1951 | 1955 | 1959 | 1964 | 1966 | 1970 | 1974
(Feb) |
1974
(Oct) |
1979 | 1983 | 1987 | 1992 | 1997 | 2001 | 2005 | 2010 | 2015 | 2017 | 2019 |
|---|---|---|---|---|---|---|---|---|---|---|---|---|---|---|---|---|---|---|---|---|
| Conservative1 | 3 | 6 | 5 | 5 | 4 | 3 | 7 | 5 | 5 | 5 | 8 | 7 | 7 | 4 | 4 | 4 | 7 | 7 | 7 | 8 |
| Labour | 5 | 2 | 3 | 3 | 4 | 5 | 1 | 2 | 2 | 2 | 0 | 1 | 1 | 4 | 3 | 3 | 0 | 1 | 1 | 1 |
| Liberal Democrat2 | 0 | 0 | 0 | 0 | 0 | 0 | 0 | 0 | 0 | 0 | 0 | 0 | 0 | 0 | 1 | 1 | 2 | 1 | 1 | 0 |
| Total | 8 | 8 | 8 | 8 | 8 | 8 | 8 | 7 | 7 | 7 | 8 | 8 | 8 | 8 | 8 | 8 | 9 | 9 | 9 | 9 |
1Includes National Liberal Party up to 1966
21950-1979 - Liberal; 1983 & 1987 - SDP-Liberal Alliance
Maps
 1950
1950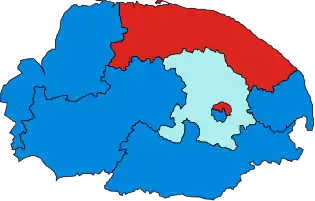 1951
1951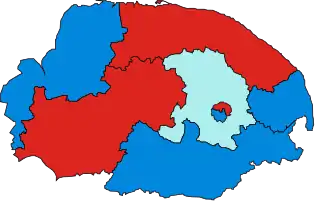 1955
1955- 1959
 1964
1964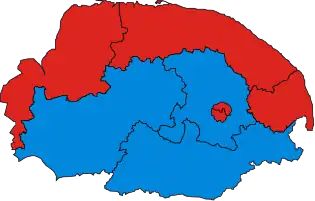 1966
1966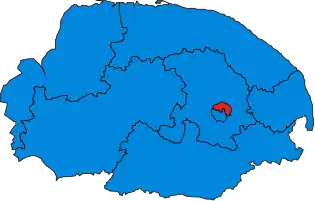 1970
1970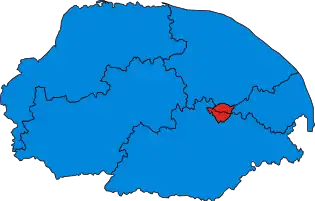 1974 Feb
- 1974 Oct
- 1979
 1983
1983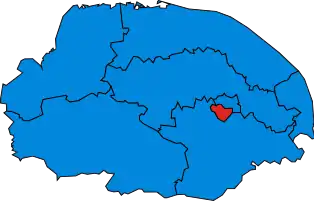 1987
1987- 1992
 1997
1997 2001
2001- 2005
 2010
2010 2015
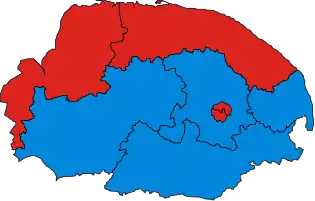
2015- 2017
 2019
2019
Timeline
Green represents former constituencies, pink represents current ones.
| Constituency | 1295-1298 | 1298-1529 | 1529-1558 | 1558-1832 | 1832-1867 | 1867-1885 | 1885-1918 | 1918-1950 | 1950-1974 | 1974-1983 | 1983-2010 | 2010-present |
|---|---|---|---|---|---|---|---|---|---|---|---|---|
| Broadland | 2010-present | |||||||||||
| Castle Rising | 1558-1832 | |||||||||||
| Central Norfolk | 1950-1974 | |||||||||||
| East Norfolk | 1832-1867 | 1885-1950 | ||||||||||
| Great Yarmouth | 1295-1867 | 1885-present | ||||||||||
| King's Lynn | 1298-1974 | |||||||||||
| Mid Norfolk | 1885-1918 | 1983-present | ||||||||||
| Norfolk | 1295-1832 | |||||||||||
| North Norfolk | 1867-present | |||||||||||
| North West Norfolk | 1885-1918 | 1974-present | ||||||||||
| Norwich | 1298-1950 | |||||||||||
| Norwich North | 1950-present | |||||||||||
| Norwich South | 1950-present | |||||||||||
| South Norfolk | 1867-present | |||||||||||
| South West Norfolk | 1885-present | |||||||||||
| Thetford | 1529-1867 | |||||||||||
| West Norfolk | 1832-1885 | |||||||||||
Historical representation by party
A cell marked → (with a different colour background to the preceding cell) indicates that the previous MP continued to sit under a new party name.
1885 to 1918
Conservative Labour Liberal Liberal Unionist
| Constituency | 1885 | 86 | 1886 | 86 | 1892 | 93 | 95 | 1895 | 98 | 99 | 1900 | 04 | 1906 | 06 | Jan 1910 | Dec 1910 | 12 | 15 | 18 |
|---|---|---|---|---|---|---|---|---|---|---|---|---|---|---|---|---|---|---|---|
| Great Yarmouth | Tyler | Moorsom | Colomb | Fell | |||||||||||||||
| King's Lynn | Bourke | Jarvis | Bowles | Bellairs | → | Bowles | Ingleby | ||||||||||||
| Norfolk East | Birkbeck | Price | |||||||||||||||||
| Norfolk Mid | R. Gurdon | → | Higgins | → | R. Gurdon | Wilson | Wodehouse | Boyle | → | Jodrell | |||||||||
| Norfolk North | Cozens-Hardy | W. Gurdon | Buxton | ||||||||||||||||
| Norfolk North West | Arch | Cavendish-Bentinck | Arch | White | Hemmerde | ||||||||||||||
| Norfolk South | Taylor | → | Soames | ||||||||||||||||
| Norfolk South West | Tyssen-Amherst | Hare | Winfrey | ||||||||||||||||
| Norwich (Two members) | Colman | Bullard | Tillett | Low | Young | ||||||||||||||
| Bullard | Hoare | Roberts | |||||||||||||||||
1918 to 1950
Coalition Labour Coalition Liberal (1918-22) / National Liberal (1922-23) Conservative Independent Labour Liberal
| Constituency | 1918 | 20 | 1922 | 1923 | 1924 | 26 | 1929 | 30 | 31 | 1931 | 1935 | 39 | 41 | 43 | 1945 |
|---|---|---|---|---|---|---|---|---|---|---|---|---|---|---|---|
| Great Yarmouth | Fell | Harbord | Meyer | Harbord | → | Jewson | Kinghorn | ||||||||
| King's Lynn | Jodrell | Woodwark | Roche | Maxwell | Roche | Wise | |||||||||
| Norfolk East | Falcon | Seely | Neville | Lygon | → | Medlicott | |||||||||
| Norfolk North | King | → | Buxton | Noel-Buxton | Cook | Gooch | |||||||||
| Norfolk South | Cozens-Hardy | Edwards | Hay | Edwards | Christie | Mayhew | |||||||||
| Norfolk South West | Winfrey | → | McLean | Taylor | McLean | de Chair | Dye | ||||||||
| Norwich (Two members) | Young | → | Jewson | Young | → | Shakespeare | → | Paton | |||||||
| Roberts | → | Smith | Fairfax | Smith | Hartland | Strauss | Noel-Buxton | ||||||||
1950 to 1983
Conservative Labour National Liberal (1931-68) Social Democratic
| Constituency | 1950 | 1951 | 55 | 1955 | 59 | 1959 | 62 | 1964 | 1966 | 1970 | Feb 1974 | Oct 1974 | 1979 | 81 |
|---|---|---|---|---|---|---|---|---|---|---|---|---|---|---|
| Great Yarmouth | Kinghorn | Fell | Gray | Fell | ||||||||||
| King's Lynn / North West Norfolk (1974) | Wise | Scott-Miller | Bullard | Page | Brocklebank-Fowler | → | ||||||||
| Norfolk Central | Medlicott | Collard | Gilmour | → | ||||||||||
| Norfolk North | Gooch | Hazell | Howell | |||||||||||
| Norfolk South | Baker | Hill | MacGregor | |||||||||||
| Norfolk South West | Dye | Bullard | Dye | Hilton | Hawkins | |||||||||
| Norwich North | Paton | Wallace | Ennals | |||||||||||
| Norwich South | Strauss | Rippon | Norwood | Stuttaford | Garrett | |||||||||
1983 to present
Conservative Labour Liberal Democrats
| Constituency | 1983 | 1987 | 1992 | 1997 | 2001 | 2005 | 09 | 2010 | 2015 | 2017 | 2019 |
|---|---|---|---|---|---|---|---|---|---|---|---|
| Broadland | Simpson | Mayhew | |||||||||
| Mid Norfolk | Ryder | Simpson | Freeman | ||||||||
| South Norfolk | MacGregor | Bacon | |||||||||
| South West Norfolk | Hawkins | Shephard | Fraser | Truss | |||||||
| North Norfolk | Howell | Prior | Lamb | Baker | |||||||
| North West Norfolk | Bellingham | Turner | Bellingham | Wild | |||||||
| Great Yarmouth | Carttiss | Wright | B. Lewis | ||||||||
| Norwich North | Thompson | Gibson | Smith | ||||||||
| Norwich South | Powley | Garrett | Clarke | Wright | C. Lewis | ||||||
See also
Notes
- BC denotes borough constituency, CC denotes county constituency.
- The majority is the number of votes the winning candidate receives more than their nearest rival.
References
- Baker, Carl; Uberoi, Elise; Cracknell, Richard (2020-01-28). "General Election 2019: full results and analysis". Cite journal requires
|journal=(help) - "Constituencies A-Z - Election 2019". BBC News. Retrieved 2020-04-23.
- "Update: Strengthening Democracy:Written statement - HCWS183". UK Parliament. Retrieved 2020-04-20.
- "Parliamentary Constituencies Act 2020".
- "2023 Review launched | Boundary Commission for England". Retrieved 2021-01-08.
- Watson, Christopher; Uberoi, Elise; Loft, Philip (2020-04-17). "General election results from 1918 to 2019". Cite journal requires
|journal=(help)