List of Parliamentary constituencies in Cornwall
The ceremonial county of Cornwall, which includes the Isles of Scilly, is divided into six Parliamentary constituencies. They are all county constituencies.
Parliamentary history of Cornwall
All six parliamentary seats are currently held by Conservatives, having came from holding no seats in 1997, 2001 and 2005, to gaining three of the six from the Liberal Democrats in 2010, to gaining the remaining three to hold all six Cornish seats in 2015. All six MPs were re-elected in 2017. In that election, several previous Liberal Democrat candidates, including previous MPs Andrew George and Steve Gilbert re-stood in their old seats, but failed to be re-elected. In all six seats, the Labour vote surged, pushing the Liberals into third place in four of the six seats. The last Labour MP for a Cornish constituency was Candy Atherton, who held the seat of Falmouth and Camborne between 1997 and 2005.
Constituencies
Conservative † Labour ‡ Liberal Democrat ¤
| Constituency | Electorate[1] | Majority[2][nb 1] | Member of Parliament[2] | Nearest opposition[2] | Electoral wards[3] | Electoral wards (no longer used)[4][5] | Map | ||
|---|---|---|---|---|---|---|---|---|---|
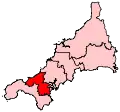
| Camborne and Redruth | 70,250 | 8,700 | George Eustice † | Paul Farmer ‡ |
|
|
 | ||
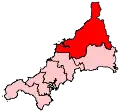
| North Cornwall | 69,935 | 14,752 | Scott Mann † | Danny Chambers ¤ |
|
|
 | ||
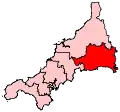
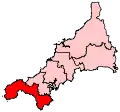
| South East Cornwall | 71,825 | 20,971 | Sheryll Murray † | Gareth Derrick ‡ |
|
|
 | ||
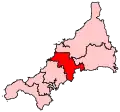
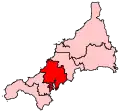
| St Austell and Newquay | 79,930 | 16,526 | Steve Double † | Felicity Owen ‡ |
|
|
 | ||
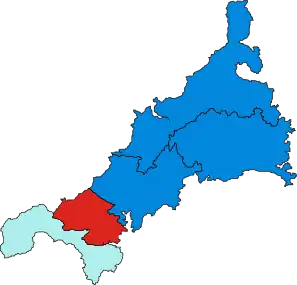
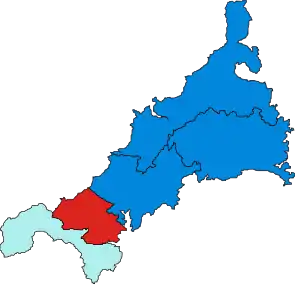
| St Ives | 68,795 | 4,284 | Derek Thomas † | Andrew George ¤ |
|
|
 | ||
| Truro and Falmouth | 76,719 | 4,561 | Cherilyn Mackrory † | Jennifer Forbes ‡ |
|
|
 | ||
Proposed boundary changes
The Boundary Commission for England submitted their final proposals in respect of the Sixth Periodic Review of Westminster Constituencies (the 2018 review) in September 2018. Although the proposals were immediately laid before Parliament they were not brought forward by the Government for approval. Accordingly, they did not come into effect for the 2019 election which took place on 12 December 2019, and which was contested using the constituency boundaries in place since 2010.
Under the terms of the Parliamentary Voting System and Constituencies Act 2011, the Sixth Review was based on reducing the total number of MPs from 650 to 600 and a strict electoral parity requirement that the electorate of all constituencies should be within a range of 5% either side of the electoral quota.
On 24 March 2020, the Minister of State for the Cabinet Office, Chloe Smith, issued a written statement to Parliament setting out the Government's thinking with regard to parliamentary boundaries.[6] Subsequently, the Parliamentary Constituencies Act 2020[7] was passed into law on 14 December 2020. This formally removed the duty to implement the 2018 review and set out the framework for future boundary reviews. The Act provided that the number of constituencies should remain at the current level of 650, rather than being reduced to 600, while retaining the requirement that the electorate should be no more than +/- 5% from the electoral quota.
The Act specified that the next review should be completed no later than 1 July 2023 and the Boundary Commission formally launched the 2023 Review on 5 January 2021.[8] See 2023 Periodic Review of Westminster constituencies for further details.
Results history
Primary data source: House of Commons research briefing - General election results from 1918 to 2019[9]
Vote breakdown
| Year | Conservative | Labour | Liberal Democrats | Green | UKIP | Mebyon Kernow | Others | Notes | |||||||||||||
|---|---|---|---|---|---|---|---|---|---|---|---|---|---|---|---|---|---|---|---|---|---|
| Votes | % | -/+ | Votes | % | -/+ | Votes | % | -/+ | Votes | % | -/+ | Votes | % | -/+ | Votes | % | -/+ | Votes | % | ||
| 2019 | 173,027 | 53.8 | +5.4 | 74,392 | 23.1 | -3.6 | 62,165 | 19.3 | -4.2 | 7,129 | 2.2 | +1.1 | did not contest | 1,660 | 0.5 | +0.5 | 3,602 | 1.1 | |||
| 2017 | 152,428 | 48.4 | +5.3 | 83,968 | 26.7 | +14.4 | 73,875 | 23.5 | +1.1 | 3,218 | 1.0 | -4.8 | 897 | 0.3 | -13.5 | did not contest | 323 | 0.1 | |||
| 2015 | 127,079 | 43.1 | +2.2 | 36,235 | 12.3 | +3.7 | 66,056 | 22.4 | -19.4 | 17,241 | 5.8 | +4.5 | 40,785 | 13.8 | +8.9 | 5,675 | 1.9 | 1,757 | 0.6 | ||
| 2010 | 115,016 | 40.9 | +9.1 | 24,257 | 8.6 | -7.0 | 117,307 | 41.8 | -2.6 | 3,573 | 1.3 | +0.6 | 13,763 | 4.9 | -0.1 | 5,379 | 1.9 | +0.5 | 1,586 | 0.6 | |
| 2005 | 82,543 | 31.8 | -0.8 | 41,140 | 15.6 | -1.7 | 115,241 | 44.4 | -0.4 | 1,738 | 0.7 | +0.7 | 12,863 | 5.0 | +1.3 | 3,552 | 1.4 | +0.1 | 2,356 | 0.9 | |
| 2001 | 82,227 | 32.6 | +2.2 | 43,674 | 17.3 | +0.2 | 113,000 | 44.8 | +0.9 | did not contest | 9,290 | 3.7 | +2.7 | 3,199 | 1.3 | +0.6 | 727 | 0.3 | |||
| 1997 | 85,077 | 30.4 | -12.3 | 47,913 | 17.1 | +3.2 | 123,124 | 43.9 | +2.2 | 482 | 0.2 | -0.1 | 2,926 | 1.0 | +1.0 | 1,906 | 0.7 | +0.7 | 18,779 | 6.7 | |
| 1992 | 127,678 | 42.7 | -4.6 | 41,593 | 13.9 | +1.3 | 124,553 | 41.7 | +1.7 | 1,035 | 0.3 | +0.3 | did not exist | did not contest | 4,098 | 1.4 | |||||
| 1987 | 131,194 | 47.3 | -2.0 | 34,994 | 12.6 | +3.7 | 111,064 | 40.0 | -0.8 | did not contest | did not contest | 373 | 0.1 | ||||||||
| 1983 | 126,182 | 49.3 | -1.3 | 22,838 | 8.9 | -3.7 | 104,365 | 40.8 | +6.6 | 776 | 0.3 | -0.2 | 1,151 | 0.5 | -1.1 | 677 | 0.3 | ||||
Percentage votes
| Election year | 1923 | 1924 | 1929 | 1945 | 1950 | 1951 | 1955 | 1959 | 1964 | 1966 | 1970 | 1974
(Feb) |
1974
(Oct) |
1979 | 1983 | 1987 | 1992 | 1997 | 2001 | 2005 | 2010 | 2015 | 2017 | 2019 |
|---|---|---|---|---|---|---|---|---|---|---|---|---|---|---|---|---|---|---|---|---|---|---|---|---|
| Conservative1 | 35.0 | 48.6 | 38.4 | 42.0 | 44.2 | 50.5 | 48.5 | 43.8 | 41.1 | 41.1 | 47.9 | 41.8 | 43.6 | 50.6 | 49.3 | 47.3 | 42.7 | 30.4 | 32.6 | 31.8 | 40.9 | 43.1 | 48.4 | 53.8 |
| Labour | 2.3 | 9.7 | 18.1 | 25.4 | 29.6 | 33.3 | 30.7 | 27.5 | 25.9 | 27.6 | 24.6 | 19.6 | 20.0 | 12.6 | 8.9 | 12.6 | 13.9 | 17.1 | 17.3 | 15.9 | 8.6 | 12.3 | 26.7 | 23.1 |
| Liberal Democrat2 | 52.6 | 41.7 | 42.4 | 32.6 | 26.2 | 16.2 | 20.8 | 28.7 | 32.8 | 30.6 | 27.0 | 38.2 | 35.2 | 34.2 | 40.8 | 40.0 | 41.7 | 44.0 | 44.8 | 44.4 | 41.8 | 22.4 | 23.5 | 19.3 |
| Green Party | - | - | - | - | - | - | - | - | - | - | - | - | - | - | - | * | * | * | * | * | 1.3 | 5.8 | 1.0 | 2.2 |
| UKIP | - | - | - | - | - | - | - | - | - | - | - | - | - | - | - | - | - | * | * | * | 4.9 | 13.8 | 0.3 | - |
| Other | 10.0 | - | 1.2 | 0.4 | - | - | - | - | 0.1 | 0.7 | 0.4 | 0.4 | 1.2 | 2.6 | 1.0 | 0.1 | 1.7 | 8.6 | 5.2 | 7.9 | 2.5 | 2.5 | 0.1 | 1.6 |
1Includes Constitutionalist in 1924 and National Liberal Party up to 1966
21950-1979 - Liberal; 1983 & 1987 - SDP-Liberal Alliance
* Included in Other
Meaningful vote percentages are not applicable for the elections of 1918, 1922, 1931 and 1935 since one or more seats were gained unopposed.
Seats
| Election year | 1918 | 1922 | 1923 | 1924 | 1929 | 1931 | 1935 | 1945 | 1950 | 1951 | 1955 | 1959 | 1964 | 1966 | 1970 | 1974
(Feb) |
1974
(Oct) |
1979 | 1983 | 1987 | 1992 | 1997 | 2001 | 2005 | 2010 | 2015 | 2017 | 2019 |
|---|---|---|---|---|---|---|---|---|---|---|---|---|---|---|---|---|---|---|---|---|---|---|---|---|---|---|---|---|
| Conservative1 | 2 | 2 | 0 | 5 | 0 | 3 | 4 | 3 | 4 | 4 | 4 | 4 | 3 | 2 | 4 | 3 | 3 | 4 | 4 | 4 | 3 | 0 | 0 | 0 | 3 | 6 | 6 | 6 |
| Labour | 0 | 0 | 0 | 0 | 0 | 0 | 0 | 1 | 1 | 1 | 1 | 1 | 1 | 1 | 0 | 0 | 0 | 0 | 0 | 0 | 0 | 1 | 1 | 0 | 0 | 0 | 0 | 0 |
| Liberal Democrat2 | 2 | 1 | 4 | 0 | 5 | 2 | 1 | 1 | 0 | 0 | 0 | 0 | 1 | 2 | 1 | 2 | 2 | 1 | 1 | 1 | 2 | 4 | 4 | 5 | 3 | 0 | 0 | 0 |
| National Liberal | 1 | 2 | 0 | 0 | 0 | 0 | 0 | 0 | 0 | 0 | 0 | 0 | 0 | 0 | 0 | 0 | 0 | 0 | 0 | 0 | 0 | 0 | 0 | 0 | 0 | 0 | 0 | 0 |
| Independent Liberal | 0 | 0 | 1 | 0 | 0 | 0 | 0 | 0 | 0 | 0 | 0 | 0 | 0 | 0 | 0 | 0 | 0 | 0 | 0 | 0 | 0 | 0 | 0 | 0 | 0 | 0 | 0 | 0 |
| Total | 5 | 5 | 5 | 5 | 5 | 5 | 5 | 5 | 5 | 5 | 5 | 5 | 5 | 5 | 5 | 5 | 5 | 5 | 5 | 5 | 5 | 5 | 5 | 5 | 6 | 6 | 6 | 6 |
1Includes Constitutionalist in 1924 and National Liberal Party up to 1966
2pre-1979 - Liberal; 1983 & 1987 - SDP-Liberal Alliance
Maps
 1950
1950- 1951
 1955
1955- 1959
 1964
1964 1966
1966 1970
1970 1974 Feb
 1974 Oct
 1979
1979 1983
1983- 1987
 1992
1992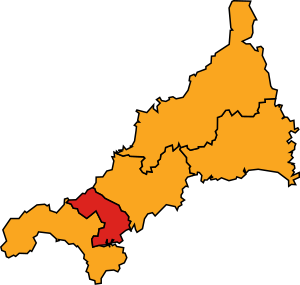 1997
1997- 2001
 2005
2005 2010
2010 2015
2015- 2017
- 2019
Historical representation by party
A cell marked → (with a different colour background to the preceding cell) indicates that the previous MP continued to sit under a new party name.
1832 to 1868 (14 MPs)
Conservative Independent Liberal Liberal Peelite Radical Whig
| Constituency | 1832 | 1835 | 1837 | 38 | 40 | 1841 | 42 | 43 | 44 | 45 | 46 | 1847 | 49 | 1852 | 53 | 54 | 1857 | 58 | 1859 | 59 | 65 | 1865 | 66 | 68 |
|---|---|---|---|---|---|---|---|---|---|---|---|---|---|---|---|---|---|---|---|---|---|---|---|---|
| Bodmin | Peter | C. Vivian | Spry | Wyld | Michell | J. C. Vivian | Leveson-Gower | |||||||||||||||||
| Spry | → | Gardner | Lacy | Graves-Sawle | Wyld | Michell | Wyld | |||||||||||||||||
| Cornwall Eastern | Molesworth | R. H. Vivian | W. Rashleigh | T. J. Agar-Robartes | → | |||||||||||||||||||
| W. Salusbury-Trelawny | Eliot | Pole-Carew | Kendall | |||||||||||||||||||||
| Cornwall Western | Wynne-Pendarves | Williams | St Aubyn | → | ||||||||||||||||||||
| Lemon | Boscawen-Rose | Lemon | Davey | → | ||||||||||||||||||||
| Helston | Lane-Fox | Townshend | Sackville | Basset | R. Vyvyan | Trueman | Rogers | Young | W. Brett | |||||||||||||||
| Launceston | Hardinge | Bowles | Percy | Haliburton | Campbell | Lopes | ||||||||||||||||||
| Liskeard | C. Buller | Crowder | Grey | Osborne | A. Buller | |||||||||||||||||||
| Penryn & Falmouth | Rolfe | Hutchins | J. C. Vivian | Gwyn | Baring | → | Smith | |||||||||||||||||
| Bury | Freshfield | Plumridge | Mowatt | Freshfield | Gurney | |||||||||||||||||||
| St Ives | Halse | W. Praed | Powlett | Laffan | Paull | |||||||||||||||||||
| Truro | R. H. Vivian | J. E. Vivian | A. Smith | → | J. C. Vivian | |||||||||||||||||||
| Tooke | Turner | H. Willyams | H. Vivian | E. Willyams | M. Smith | F. Williams | ||||||||||||||||||
1868 to 1885 (13 MPs)
1885 to 1918 (7 MPs)
Conservative Independent Liberal Liberal Liberal Unionist
| Constituency | 1885 | 1886 | 87 | 1892 | 1895 | 98 | 99 | 1900 | 03 | 04 | 1906 | 06 | 08 | Jan 1910 | Dec 1910 | 12 | 15 | 16 |
|---|---|---|---|---|---|---|---|---|---|---|---|---|---|---|---|---|---|---|
| Bodmin | Courtney | → | → | Molesworth | Agar-Robartes | Freeman-Thomas | Grenfell | Pole-Carew | → | Hanson | ||||||||
| Camborne | Conybeare | → | Strauss | Caine | Lawson | Dunn | F. Dyke Acland | |||||||||||
| Launceston | C. Dyke-Acland | Owen | Moulton | Marks | ||||||||||||||
| Penryn and Falmouth | Jenkins | Cavendish-Bentinck | Horniman | Barker | Goldman | |||||||||||||
| St Austell | Borlase | McArthur | Agar-Robartes | Layland-Barratt | ||||||||||||||
| St Ives | St Aubyn | → | Bolitho | Hain | → | Cory | ||||||||||||
| Truro | Bickford-Smith | → | Williams | Durning-Lawrence | Morgan | |||||||||||||
1918 to 1950 (5 MPs)
Coalition Liberal (1918-22) / National Liberal (1922-23) Conservative Constitutionalist Independent Independent Liberal Labour Liberal National Liberal (1931-68)
| Constituency | 1918 | 22 | 1922 | 1923 | 1924 | 24 | 28 | 1929 | 31 | 1931 | 32 | 1935 | 37 | 39 | 41 | 1945 | 46 | 47 |
|---|---|---|---|---|---|---|---|---|---|---|---|---|---|---|---|---|---|---|
| Bodmin | Hanson | Foot | Harrison | Foot | Rathbone | B. Rathbone | Marshall | |||||||||||
| Camborne | Dyke Acland | Moreing | Jones | Moreing | → | Jones | Agnew | |||||||||||
| Cornwall North | Marks | → | → | Williams | Maclean | Dyke Acland | Horabin | → | → | |||||||||
| Penryn and Falmouth | Nicholl | Shipwright | Mansel | Pilcher | Walters | Petherick | King | |||||||||||
| St Ives | Cory | Hawke | Cory | Hawke | H. Runciman | W. Runciman | → | Beechman | ||||||||||
1950 to 2010 (5 MPs)
Conservative Labour Liberal Liberal Democrats National Liberal (1931-68)
| Constituency | 1950 | 1951 | 1955 | 1959 | 1964 | 1966 | 68 | 1970 | Feb 1974 | Oct 1974 | 1979 | 1983 | 87 | 1987 | 88 | 1992 | 1997 | 2001 | 2005 |
|---|---|---|---|---|---|---|---|---|---|---|---|---|---|---|---|---|---|---|---|
| Cornwall North | Roper | Scott-Hopkins | Pardoe | Neale | Tyler | Rogerson | |||||||||||||
| Bodmin / Cornwall South East (1983) | Marshall | Bessell | Hicks | Tyler | Hicks | Breed | |||||||||||||
| Falmouth and Camborne | Hayman | Dunwoody | Mudd | Coe | Atherton | Goldsworthy | |||||||||||||
| St Ives | Howard | Nott | → | Harris | George | ||||||||||||||
| Truro / Truro and St Austell (1997) | Wilson | Dixon | Penhaligon | Taylor | → | ||||||||||||||
2010 to present (6 MPs)
Conservative Liberal Democrats
| Constituency | 2010 | 2015 | 2017 | 2019 |
|---|---|---|---|---|
| Camborne and Redruth | Eustice | |||
| North Cornwall | Rogerson | Mann | ||
| St Ives | George | Thomas | ||
| South East Cornwall | Murray | |||
| St Austell and Newquay | Gilbert | Double | ||
| Truro and Falmouth | Newton | Mackrory | ||
Notes
- The majority is the number of votes the winning candidate receives more than their nearest rival.
References
- Baker, Carl; Uberoi, Elise; Cracknell, Richard (28 January 2020). "General Election 2019: full results and analysis". Cite journal requires
|journal=(help) - "Constituencies A-Z - Election 2019". BBC News. Retrieved 24 April 2020.
- "Polling Districts and Polling Places Review 2014". Cornwall Council. 27 February 2018.
- "The Parliamentary Constituencies (England) Order 2007". Office of Public Sector Information. Crown copyright. 13 June 2007. Retrieved 7 November 2009.
- Boundary Commission for England pp. 1004–1007
- "Update: Strengthening Democracy:Written statement - HCWS183". UK Parliament. Retrieved 20 April 2020.
- "Parliamentary Constituencies Act 2020".
- "2023 Review launched | Boundary Commission for England". Retrieved 8 January 2021.
- Watson, Christopher; Uberoi, Elise; Loft, Philip (17 April 2020). "General election results from 1918 to 2019". Cite journal requires
|journal=(help)