List of Parliamentary constituencies in Hertfordshire
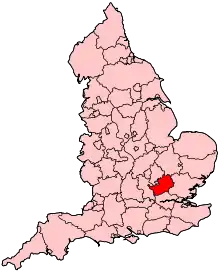
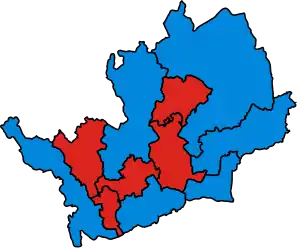
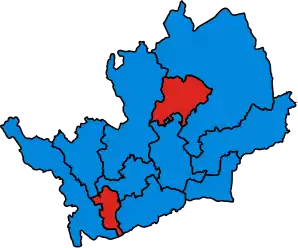
The county of Hertfordshire in England is divided into eleven Parliamentary constituencies. Each of the eleven elects a Member of Parliament (MP) to represent it at the United Kingdom (UK) Parliament in Westminster. As of the 2019 general election, ten of Hertfordshire's eleven MPs are Conservatives. The county currently has two urban borough constituencies (BC) – Broxbourne and Watford – while the other nine are classed as more rural county constituencies (CC).
Constituencies
Limits of the seats were amended by the Fifth Periodic Review of Westminster constituencies carried out by the Boundary Commission for England for future elections which have included 2010, 2015, 2017 and 2019. Each constituency is made up of whole or partial local government wards, which elect councillors at English local elections. Nine are designated as county constituencies (in which candidates can spend more per head than their borough counterparts). Two are borough constituencies.
[1] Conservative † Labour ‡ Liberal Democrat ¤
| Name[nb 1] | Electorate[2] | Majority[3][nb 2] | Member of Parliament[3] | Nearest opposition[3] | Map | ||
|---|---|---|---|---|---|---|---|
| Broxbourne BC | 73,182 | 19,807 | Charles Walker †[4] | Sean Waters ‡ |  | ||
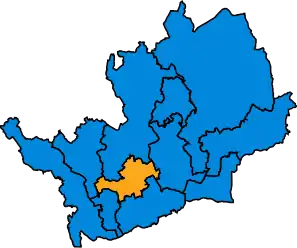
| Hemel Hempstead CC | 74,035 | 14,563 | Michael Penning † | Nabila Ahmed ‡ | 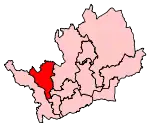 | ||
| Hertford and Stortford CC | 81,765 | 19,620 | Julie Marson † | Chris Vince ‡ | 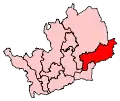 | ||
| Hertsmere CC | 73,971 | 21,313 | Oliver Dowden † | Holly Kal-Weiss ‡ | 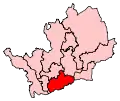 | ||
| Hitchin and Harpenden CC | 76,323 | 6,895 | Bim Afolami † | Sam Collins ¤ | 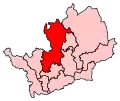 | ||
| North East Hertfordshire CC | 76,123 | 18,189 | Oliver Heald † | Kelley Green ‡ | 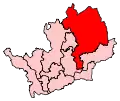 | ||
| South West Hertfordshire CC | 80,499 | 14,408 | Gagan Mohindra † | David Gauke | 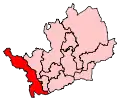 | ||
| St Albans CC | 73,727 | 6,293 | Daisy Cooper ¤ | Anne Main † | 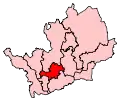 | ||
| Stevenage CC | 71,562 | 8,562 | Stephen McPartland † | Jill Borcherds ‡ | 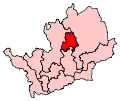 | ||
| Watford BC | 83,359 | 4,433 | Dean Russell † | Chris Ostrowski ‡ | 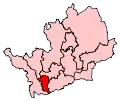 | ||
| Welwyn Hatfield CC | 74,892 | 10,955 | Grant Shapps † | Rosie Newbigging ‡ | 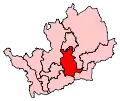 | ||
2010 boundary changes
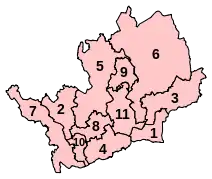
The Boundary Commission for England decided not to change Hertfordshire's representation in Parliament for the 2010 election. It did however suggest slight boundary changes to reduce electoral disparity. The recommendations, which became law with the Parliamentary Constituencies (England) Order 2007, also ensured that local government wards in Hertfordshire would no longer be split between two Parliamentary constituencies.[5][6]
| No. on map | Constituency | Pre-2010 Boundaries | Post-2010 Boundaries |
|---|---|---|---|
| 1 | Broxbourne | 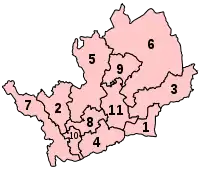 |
 |
| 2 | Hemel Hempstead | ||
| 3 | Hertford and Stortford | ||
| 4 | Hertsmere | ||
| 5 | Hitchin and Harpenden | ||
| 6 | North East Hertfordshire | ||
| 7 | South West Hertfordshire | ||
| 8 | St Albans | ||
| 9 | Stevenage | ||
| 10 | Watford | ||
| 11 | Welwyn Hatfield |
Proposed boundary changes
The Boundary Commission for England submitted their final proposals in respect of the Sixth Periodic Review of Westminster Constituencies (the 2018 review) in September 2018. Although the proposals were immediately laid before Parliament they were not brought forward by the Government for approval. Accordingly, they did not come into effect for the 2019 election which took place on 12 December 2019, and which was contested using the constituency boundaries in place since 2010.
Under the terms of the Parliamentary Voting System and Constituencies Act 2011, the Sixth Review was based on reducing the total number of MPs from 650 to 600 and a strict electoral parity requirement that the electorate of all constituencies should be within a range of 5% either side of the electoral quota.
On 24 March 2020, the Minister of State for the Cabinet Office, Chloe Smith, issued a written statement to Parliament setting out the Government's thinking with regard to parliamentary boundaries.[7] Subsequently, the Parliamentary Constituencies Act 2020[8] was passed into law on 14 December 2020. This formally removed the duty to implement the 2018 review and set out the framework for future boundary reviews. The Act provided that the number of constituencies should remain at the current level of 650, rather than being reduced to 600, while retaining the requirement that the electorate should be no more than +/- 5% from the electoral quota.
The Act specified that the next review should be completed no later than 1 July 2023 and the Boundary Commission formally launched the 2023 Review on 5 January 2021.[9] See 2023 Periodic Review of Westminster constituencies for further details.
Results history
Primary data source: House of Commons research briefing - General election results from 1918 to 2019[10]
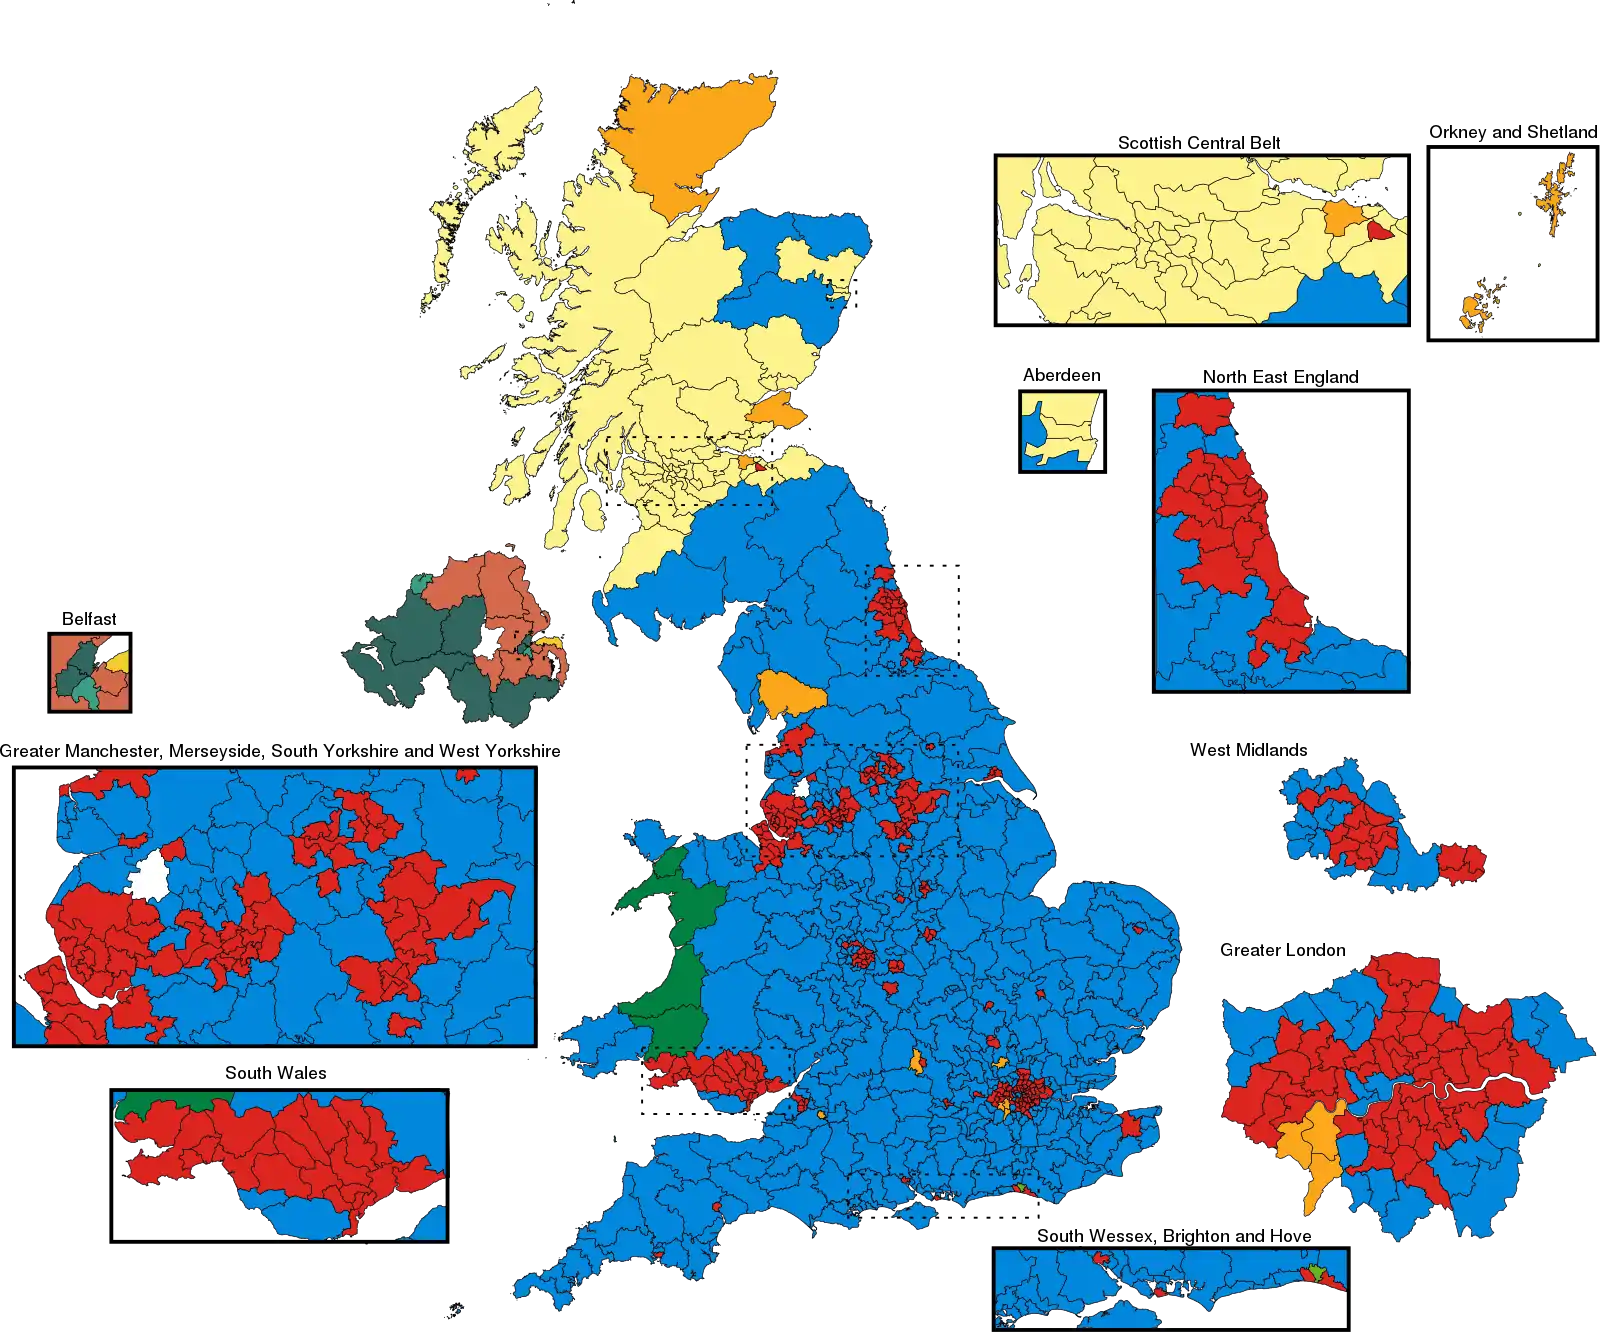
2019
The number of votes cast for each political party who fielded candidates in constituencies comprising Hertfordshire in the 2019 general election were as follows:
| Party | Votes | % | Change from 2017 | Seats | Change from 2017 |
|---|---|---|---|---|---|
| Conservative | 317,018 | 52.7% | 10 | ||
| Labour | 141,143 | 20.1% | 0 | 0 | |
| Liberal Democrats | 110,006 | 18.6% | 1 | ||
| Greens | 15,132 | 3.3% | 0 | 0 | |
| Others | 17,764 | 0.6% | 0 | 0 | |
| Total | 601,063 | 100.0 | 11 |
Percentage votes
| Election year | 1974
(Feb) |
1974
(Oct) |
1979 | 1983 | 1987 | 1992 | 1997 | 2001 | 2005 | 2010 | 2015 | 2017 | 2019 |
|---|---|---|---|---|---|---|---|---|---|---|---|---|---|
| Conservative | 40.4 | 41.3 | 51.1 | 50.3 | 52.0 | 53.3 | 40.6 | 41.8 | 44.8 | 50.4 | 52.6 | 54.3 | 52.7 |
| Labour | 35.0 | 38.5 | 34.4 | 19.0 | 19.8 | 25.5 | 39.7 | 38.9 | 30.2 | 19.0 | 22.4 | 32.1 | 23.5 |
| Liberal Democrat1 | 24.4 | 19.8 | 13.2 | 30.2 | 27.8 | 20.3 | 16.0 | 16.9 | 21.4 | 24.0 | 8.7 | 9.9 | 18.3 |
| Green Party | - | - | - | - | * | * | * | * | * | 0.8 | 3.6 | 2.3 | 2.5 |
| UKIP | - | - | - | - | - | - | * | * | * | 3.3 | 12.5 | 1.2 | * |
| Other | 0.2 | 0.4 | 1.3 | 0.5 | 0.4 | 0.9 | 3.7 | 2.4 | 3.6 | 2.5 | 0.2 | 0.2 | 3.0 |
11974 & 1979 - Liberal Party; 1983 & 1987 - SDP-Liberal Alliance
* Included in Other
Seats
| Election year | 1974
(Feb) |
1974
(Oct) |
1979 | 1983 | 1987 | 1992 | 1997 | 2001 | 2005 | 2010 | 2015 | 2017 | 2019 |
|---|---|---|---|---|---|---|---|---|---|---|---|---|---|
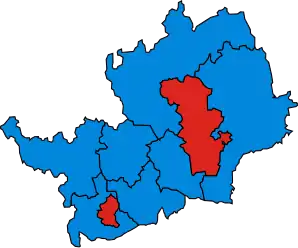
| Conservative | 7 | 5 | 9 | 10 | 10 | 10 | 6 | 6 | 9 | 11 | 11 | 11 | 10 |
| Labour | 2 | 4 | 0 | 0 | 0 | 0 | 5 | 5 | 2 | 0 | 0 | 0 | 0 |
| Liberal Democrat1 | 0 | 0 | 0 | 0 | 0 | 0 | 0 | 0 | 0 | 0 | 0 | 0 | 1 |
| Total | 9 | 9 | 9 | 10 | 10 | 10 | 11 | 11 | 11 | 11 | 11 | 11 | 11 |
11974 & 1979 - Liberal Party; 1983 & 1987 - SDP-Liberal Alliance
Maps
 Feb 1974
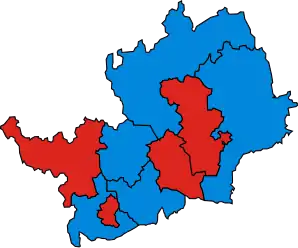 Oct 1974
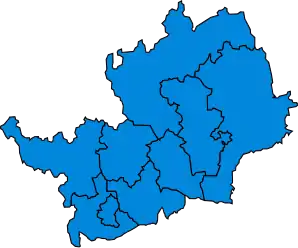 1979
1979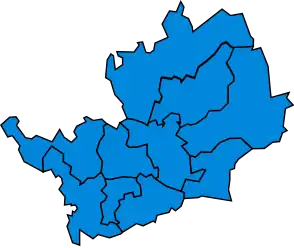 1983
1983- 1987
- 1992
 1997
1997- 2001
 2005
2005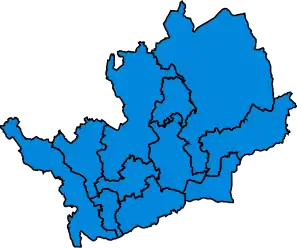 2010
2010- 2015
- 2017
 2019
2019
Timeline
- Former constituency
- * Constituency for the 2017 United Kingdom general election
| Constituency | Years | |||||||||||
|---|---|---|---|---|---|---|---|---|---|---|---|---|
| 1290–1298 | 1298–1307 | 1307–1852 | 1852–1885 | 1885–1918 | 1918–1945 | 1945–1950 | 1950–1955 | 1955–1974 | 1974–1983 | 1983–1997 | 1997–* | |
| Hertfordshire[11] | 1290–1885 | |||||||||||
| Hertford[11][12] | 1298–1974 | |||||||||||
| St Albans[nb 3][11][12] | 1307–1852 | 1885–* | ||||||||||
| Watford[12] | 1885–* | |||||||||||
| Hitchin[12] | 1885–1983 | |||||||||||
| Hemel Hempstead[13] | 1918–1983 | 1997–* | ||||||||||
| Barnet | 1945–1974 | Part of Greater London from 1965 | ||||||||||
| South West Hertfordshire[14][15] | 1950–* | |||||||||||
| East Hertfordshire[16] | 1955–1983 | |||||||||||
| Hertford and Stevenage | 1974–1983 | |||||||||||
| South Hertfordshire | 1974–1983 | |||||||||||
| Welwyn Hatfield | 1974–* | |||||||||||
| North Hertfordshire | 1983–1997 | |||||||||||
| West Hertfordshire | 1983–1997 | |||||||||||
| Broxbourne | 1983–* | |||||||||||
| Hertford and Stortford | 1983–* | |||||||||||
| Hertsmere | 1983–* | |||||||||||
| Stevenage | 1983–* | |||||||||||
| Hitchin and Harpenden | 1997–* | |||||||||||
| North East Hertfordshire | 1997–* | |||||||||||
Historical representation by party
A cell marked → (with a different colour background to the preceding cell) indicates that the previous MP continued to sit under a new party name.
1885 to 1945
Anti-Waste League Conservative Independent Liberal Silver Badge
| Constituency | 1885 | 1886 | 1892 | 1895 | 98 | 1900 | 04 | 1906 | Jan 10 | Dec 10 | 11 | 16 | 1918 | 19 | 20 | 21 | 1922 | 1923 | 1924 | 1929 | 1931 | 33 | 1935 | 37 | 41 | 43 | ||
|---|---|---|---|---|---|---|---|---|---|---|---|---|---|---|---|---|---|---|---|---|---|---|---|---|---|---|---|---|
| Hertford | A. Smith | E. Cecil | A. H. Smith | Rolleston | Billing | → | Sueter | → | ||||||||||||||||||||
| Hitchin | Dimsdale | Hudson | Bertram | Hillier | R. Cecil | Kindersley | Knebworth | Wilson | Berry | |||||||||||||||||||
| St Albans | J. W. Grimston | Gibbs | Slack | Carlile | Fremantle | J. Grimston | ||||||||||||||||||||||
| Watford | Halsey | Micklem | Ward | Herbert | Helmore | |||||||||||||||||||||||
| Hemel Hempstead | Talbot | J. Davidson | Dunn | J. Davidson | F. Davidson | |||||||||||||||||||||||
1945 to present
Conservative Independent Labour Liberal Democrats
| Constituency | 1945 | 1950 | 1951 | 1955 | 1959 | 1964 | 1966 | 1970 | Feb 1974 | Oct 1974 | 1979 | 79 | 1983 | 1987 | 1992 | 1997 | 2001 | 2005 | 2010 | 2015 | 2017 | 19 | 2019 |
|---|---|---|---|---|---|---|---|---|---|---|---|---|---|---|---|---|---|---|---|---|---|---|---|
| Barnet | Taylor | Maudling | Transferred to Greater London | ||||||||||||||||||||
| Hemel Hempstead (1945–83, 97-) / West Hertfordshire (1983) | Davidson | Allason | Corbett | Lyell | Jones | McWalter | Penning | ||||||||||||||||
| Hertford / & Stevenage (1974) / H & Stortford (1983) | Walker-Smith | Lindsay | Williams | Wells | Prisk | Marson | |||||||||||||||||
| Hitchin / North Hertfordshire (1983) / NE Hertfordshire (1997) | Jones | Fisher | Maddan | Williams | Stewart | Heald | |||||||||||||||||
| St Albans | Dumpleton | Grimston | Goodhew | Lilley | Pollard | Main | Cooper | ||||||||||||||||
| Watford | Freeman | Farey-Jones | Tuck | Garel-Jones | Ward | Harrington | Russell | ||||||||||||||||
| Hertfordshire SW | Longden | Dodsworth | Page | Gauke | → | Mohindra | |||||||||||||||||
| Hertfordshire E / Broxbourne (1983) | Walker-Smith | Roe | Walker | ||||||||||||||||||||
| Hertfordshire South / Hertsmere (1983) | Parkinson | Clappison | Dowden | ||||||||||||||||||||
| Welwyn and Hatfield | Lindsay | Hayman | Murphy | Evans | Johnson | Shapps | |||||||||||||||||
| Stevenage | Wood | Follett | McPartland | ||||||||||||||||||||
| Hitchin and Harpenden | Lilley | Afolami | |||||||||||||||||||||
See also
Footnotes
- BC denotes borough constituency, CC denotes county constituency.
- The majority is the number of votes the winning candidate receives more than their nearest rival.
- St Albans was abolished in 1852, but re-established in 1885.
References
- General
- "Boundary Commission for England: Fifth Periodical Report" (PDF). Boundary Commission for England. Crown Copyright. 2007. Archived from the original (PDF) on July 26, 2011. Retrieved 6 November 2009.
- Craig, Frederick Walter Scott (1972). Boundaries of Parliamentary Constituencies 1885–1972. Chichester, Sussex: Political Reference Publications. ISBN 0-900178-13-2.
- Robinson, Gwennah (1978). Barracuda Guide to County History, Vol III: Hertfordshire. Barracuda Books. ISBN 0-86023-030-9.
- Richard Hacker (13 February 2001). "Report on a local inquiry into the Parliamentary constituency boundaries for the county of Hertfordshire" (PDF). Archived from the original (PDF) on January 28, 2007. Retrieved 28 November 2009.
- Specific
- "Variation of election expenses limits for candidates at UK Parliamentary and local government elections" (PDF). The Electoral Commission. Retrieved 26 November 2009.
- Baker, Carl; Uberoi, Elise; Cracknell, Richard (2020-01-28). "General Election 2019: full results and analysis". Cite journal requires
|journal=(help) - "Constituencies A-Z - Election 2019". BBC News. Retrieved 2020-04-23.
- "Constituency:Broxbourne". BBC News. Retrieved 2 August 2010.
- Boundary Commission for England pp. 346–350.
- "The Parliamentary Constituencies (England) Order 2007". Office of Public Sector Information. Crown copyright. 13 June 2007. Archived from the original on February 11, 2010. Retrieved 7 November 2009.
- "Update: Strengthening Democracy:Written statement - HCWS183". UK Parliament. Retrieved 2020-04-20.
- "Parliamentary Constituencies Act 2020".
- "2023 Review launched | Boundary Commission for England". Retrieved 2021-01-08.
- Watson, Christopher; Uberoi, Elise; Loft, Philip (2020-04-17). "General election results from 1918 to 2019". Cite journal requires
|journal=(help) - David Boothroyd. "Parliamentary Constituencies in the unreformed House". David Boothroyd. Retrieved 9 November 2009.
- "Historic maps". David Rumsey Historical Map Collection. Retrieved 28 November 2009.
- "Full text of "The Representation of the people act, 1918 : with explanatory notes"". Internet Archive. Retrieved 28 November 2009.
- "UK General Election results July 1945". politicsresources.net. Archived from the original on 11 August 2011. Retrieved 29 November 2009.
- "UK General Election results February 1950". politicsresources.net. Archived from the original on 11 August 2011. Retrieved 29 November 2009.
- "UK General Election results May 1955". politicsresources.net. Archived from the original on 11 August 2011. Retrieved 29 November 2009.