List of Parliamentary constituencies in the East of England (region)
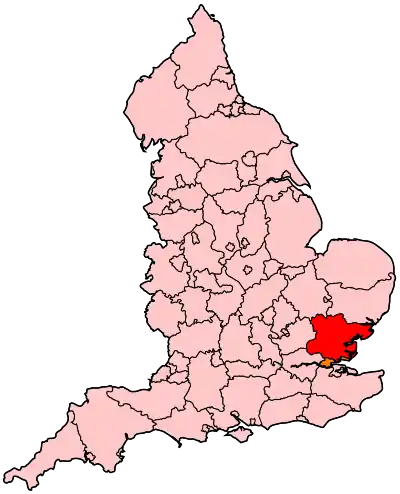
The region[1] of East of England is divided into 58 parliamentary constituencies which is made up of 16 Borough Constituencies and 42 County Constituencies. Since the general election of December 2019,[2] 52 are represented by Conservative MPs, five by Labour MPs, and one by a Liberal Democrat MP.
Constituencies
† Conservative ‡ Labour ¤ Liberal Democrat # Independent


Proposed boundary changes
The Boundary Commission for England submitted their final proposals in respect of the Sixth Periodic Review of Westminster Constituencies (the 2018 review) in September 2018. Although the proposals were immediately laid before Parliament they were not brought forward by the Government for approval. Accordingly, they did not come into effect for the 2019 election which took place on 12 December 2019, and which was contested using the constituency boundaries in place since 2010.
Under the terms of the Parliamentary Voting System and Constituencies Act 2011, the Sixth Review was based on reducing the total number of MPs from 650 to 600 and a strict electoral parity requirement that the electorate of all constituencies should be within a range of 5% either side of the electoral quota.
On 24 March 2020, the Minister of State for the Cabinet Office, Chloe Smith, issued a written statement to Parliament setting out the Government's thinking with regard to parliamentary boundaries.[5] Subsequently, the Parliamentary Constituencies Act 2020[6] was passed into law on 14 December 2020. This formally removed the duty to implement the 2018 review and set out the framework for future boundary reviews. The Act provided that the number of constituencies should remain at the current level of 650, rather than being reduced to 600, while retaining the requirement that the electorate should be no more than +/- 5% from the electoral quota.
The Act specified that the next review should be completed no later than 1 July 2023 and the Boundary Commission formally launched the 2023 Review on 5 January 2021.[7] The Commission have calculated that the number of seats to be allocated to the Eastern region will increase by 3, from 58 to 61.[8]
See 2023 Periodic Review of Westminster constituencies for further details.
Results history
Primary data source: House of Commons research briefing - General election results from 1918 to 2019[9]
2019
The number of votes cast for each political party who fielded candidates in constituencies comprising the East of England region in the 2019 general election were as follows:
| Party | Votes | % | Change from 2017 | Seats | Change from 2017 |
|---|---|---|---|---|---|
| Conservative | 1,754,091 | 57.2% | 52 | ||
| Labour | 749,906 | 24.4% | 5 | ||
| Liberal Democrats | 410,849 | 13.4% | 1 | 0 | |
| Greens | 90,957 | 3.0% | 0 | 0 | |
| Brexit | 11,707 | 0.4% | new | 0 | 0 |
| Others | 50,751 | 1.6% | 0 | 0 | |
| Total | 3,068,261 | 100.0 | 58 |
Percentage votes
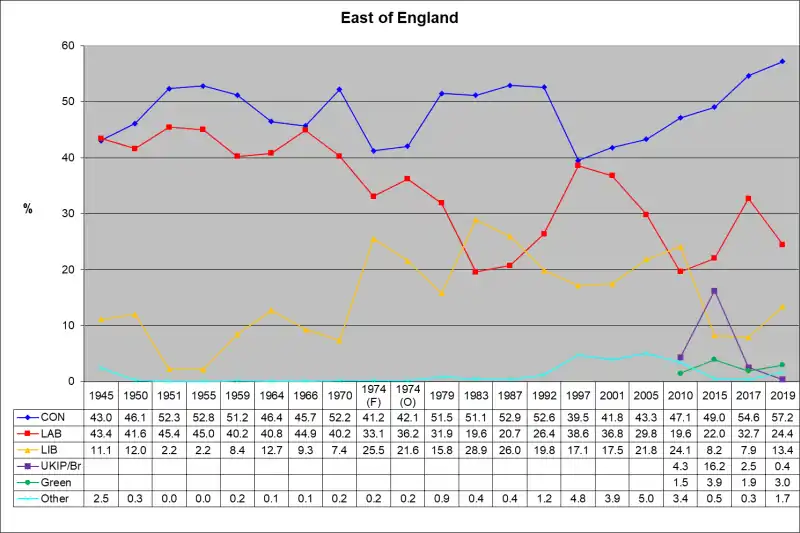
Key:
CON - Conservative Party, including National Liberal Party up to 1966
LAB - Labour Party
LIB - Liberal Party up to 1979; SDP-Liberal Alliance 1983 & 1987; Liberal Democrats from 1992
UKIP/Br - UK Independence Party 2010 to 2017 (included in Other up to 2005 and in 2019); Brexit Party in 2019
Green - Green Party of England and Wales (included in Other up to 2005)
Seats
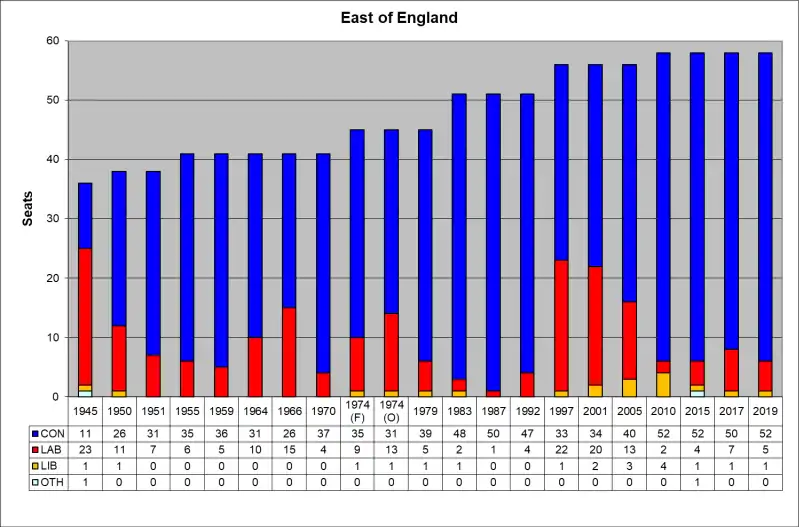
Key: CON - Conservative Party, including National Liberal Party up to 1966
LAB - Labour Party
LIB - Liberal Party up to 1979; SDP-Liberal Alliance 1983 & 1987; Liberal Democrats from 1992
OTH - 1945 - Common Wealth Party (unopposed by Labour); 2015 - UK Independence Party
See also
- List of United Kingdom Parliament constituencies
- List of Parliamentary constituencies in Bedfordshire
- List of Parliamentary constituencies in Cambridgeshire
- List of Parliamentary constituencies in Essex
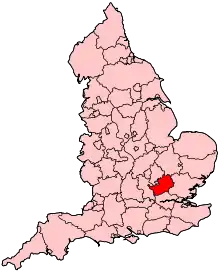
- List of Parliamentary constituencies in Hertfordshire
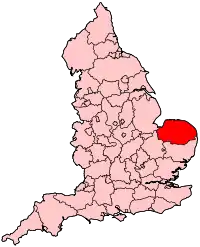
- List of Parliamentary constituencies in Norfolk
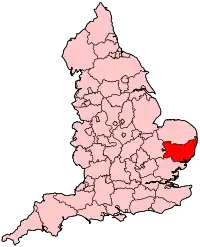
- List of Parliamentary constituencies in Suffolk
Notes
- BC denotes borough constituency, CC denotes county constituency
- The majority is the number of votes the winning candidate receives more than their nearest rival
References
- See NUTS 1 statistical regions of England
- "2019 Election Results". BBC News. 13 December 2019.
- Baker, Carl; Uberoi, Elise; Cracknell, Richard (2020-01-28). "General Election 2019: full results and analysis". Cite journal requires
|journal=(help) - "Constituencies A-Z - Election 2019". BBC News. Retrieved 2020-04-26.
- "Update: Strengthening Democracy:Written statement - HCWS183". UK Parliament. Retrieved 2020-04-20.
- "Parliamentary Constituencies Act 2020".
- "2023 Review launched | Boundary Commission for England". Retrieved 2021-01-08.
- "2023 Review | Boundary Commission for England". Retrieved 2021-01-08.
- Watson, Christopher; Uberoi, Elise; Loft, Philip (2020-04-17). "General election results from 1918 to 2019". Cite journal requires
|journal=(help)