List of Parliamentary constituencies in Wiltshire
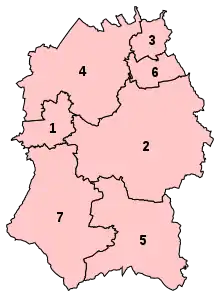
The ceremonial county of Wiltshire, England, (which includes the unitary authority of Swindon), is divided into seven Parliamentary constituencies. They are all County constituencies.
Constituencies
† Conservative ‡ Labour ¤ Liberal Democrat
| Constituency[nb 1] | Electorate[1] | Majority[2][nb 2] | Member of Parliament[2] | Nearest opposition[2] | Map | ||
|---|---|---|---|---|---|---|---|
| Chippenham CC | 77,221 | 11,288 | Michelle Donelan† | Helen Belcher¤ | 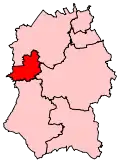 | ||
| Devizes CC | 73,372 | 23,993 | Danny Kruger† | Jo Waltham¤ | 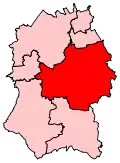 | ||
| North Swindon CC | 82,441 | 16,171 | Justin Tomlinson† | Kate Linnegar† | 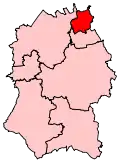 | ||
| North Wiltshire CC | 73,208 | 17,626 | James Gray† | Brian Matthew¤ | 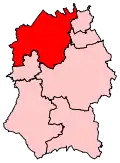 | ||
| Salisbury CC | 74,556 | 19,736 | John Glen† | Victoria Charleston¤ | 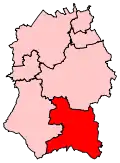 | ||
| South Swindon CC | 73,118 | 6,625 | Robert Buckland† | Sarah Church† | 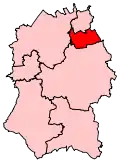 | ||
| South West Wiltshire CC | 77,969 | 21,630 | Andrew Murrison† | Emily Pomroy-Smith† | 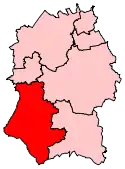 | ||
Boundary changes
Previous constituency boundaries
| Name | Pre-2010 Boundaries |
|---|---|
 Parliamentary constituencies in Wiltshire | |
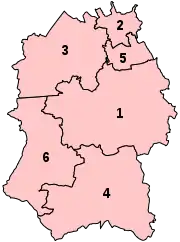
Current constituency boundaries [3]
| Name | New boundaries |
|---|---|
 Proposed Revision | |
Proposed boundary changes
The Boundary Commission for England submitted their final proposals in respect of the Sixth Periodic Review of Westminster Constituencies (the 2018 review) in September 2018. Although the proposals were immediately laid before Parliament they were not brought forward by the Government for approval. Accordingly, they did not come into effect for the 2019 election which took place on 12 December 2019, and which was contested using the constituency boundaries in place since 2010.
Under the terms of the Parliamentary Voting System and Constituencies Act 2011, the Sixth Review was based on reducing the total number of MPs from 650 to 600, and a strict electoral parity requirement that the electorate of all constituencies should be within a range of 5% either side of the electoral quota.
On 24 March 2020, the Minister of State for the Cabinet Office, Chloe Smith, issued a written statement to Parliament setting out the Government's thinking with regard to parliamentary boundaries.[4] Subsequently, the Parliamentary Constituencies Act 2020[5] was passed into law on 14 December 2020. This formally removed the duty to implement the 2018 review and set out the framework for future boundary reviews. The Act provided that the number of constituencies should remain at the current level of 650, rather than being reduced to 600, while retaining the requirement that the electorate should be no more than +/- 5% from the electoral quota.
The Act specified that the next review should be completed no later than 1 July 2023 and the Boundary Commission formally launched the 2023 Review on 5 January 2021.[6] See 2023 Periodic Review of Westminster constituencies for further details.
Results history
Primary data source: House of Commons research briefing - General election results from 1918 to 2019[7]
2019
The number of votes cast for each political party who fielded candidates in constituencies comprising Wiltshire in the 2019 general election were as follows:
| Party | Votes | % | Change from 2017 | Seats | Change from 2017 |
|---|---|---|---|---|---|
| Conservative | 217,955 | 57.8% | 7 | 0 | |
| Labour | 77,343 | 20.1% | 0 | 0 | |
| Liberal Democrats | 69,876 | 18.6% | 0 | 0 | |
| Greens | 11,378 | 3.3% | 0 | 0 | |
| Others | 745 | 0.6% | 0 | 0 | |
| Total | 377,297 | 100.0 | 7 |
Percentage votes
| Election year | 1918 | 1922 | 1923 | 1924 | 1929 | 1931 | 1935 | 1945 | 1950 | 1951 | 1955 | 1959 | 1964 | 1966 | 1970 | 1974
(Feb) |
1974
(Oct) |
1979 | 1983 | 1987 | 1992 | 1997 | 2001 | 2005 | 2010 | 2015 | 2017 | 2019 |
|---|---|---|---|---|---|---|---|---|---|---|---|---|---|---|---|---|---|---|---|---|---|---|---|---|---|---|---|---|
| Conservative | 52.8 | 50.0 | 45.7 | 53.9 | 43.2 | 60.7 | 56.2 | 41.6 | 41.0 | 50.1 | 49.6 | 49.3 | 43.2 | 43.8 | 51.0 | 41.9 | 40.3 | 47.4 | 50.3 | 51.9 | 50.9 | 40.2 | 42.1 | 44.3 | 47.7 | 52.4 | 56.8 | 57.8 |
| Labour | 17.1 | 15.4 | 11.4 | 15.7 | 21.9 | 20.2 | 24.0 | 39.9 | 39.2 | 46.2 | 41.7 | 38.7 | 37.5 | 40.6 | 37.2 | 28.1 | 29.3 | 22.8 | 14.9 | 16.7 | 18.3 | 28.0 | 29.0 | 24.3 | 15.3 | 17.3 | 27.4 | 20.5 |
| Liberal Democrat1 | 30.1 | 34.6 | 42.9 | 30.4 | 34.8 | 19.1 | 19.8 | 18.4 | 19.6 | 3.7 | 8.7 | 10.7 | 18.9 | 15.2 | 11.7 | 29.8 | 30.2 | 27.5 | 34.2 | 31.2 | 28.7 | 26.2 | 25.0 | 26.9 | 30.4 | 11.8 | 11.8 | 18.5 |
| Green Party | - | - | - | - | - | - | - | - | - | - | - | - | - | - | - | - | - | - | - | * | * | * | * | * | 1.0 | 4.7 | 1.8 | 3.0 |
| UKIP | - | - | - | - | - | - | - | - | - | - | - | - | - | - | - | - | - | - | - | - | - | * | * | * | 4.0 | 13.5 | 1.8 | * |
| Other | - | - | - | - | - | - | - | - | 0.1 | - | - | 1.3 | 0.4 | 0.4 | 0.2 | 0.3 | 0.2 | 2.2 | 0.7 | 0.1 | 2.2 | 5.6 | 3.9 | 4.5 | 1.6 | 0.4 | 0.4 | 0.2 |
1pre-1979 - Liberal Party; 1983 & 1987 - SDP-Liberal Alliance
* Included in Other
Seats
| Election year | 1950 | 1951 | 1955 | 1959 | 1964 | 1966 | 1970 | 1974
(Feb) |
1974
(Oct) |
1979 | 1983 | 1987 | 1992 | 1997 | 2001 | 2005 | 2010 | 2015 | 2017 | 2019 |
|---|---|---|---|---|---|---|---|---|---|---|---|---|---|---|---|---|---|---|---|---|
| Conservative | 4 | 4 | 4 | 4 | 4 | 4 | 4 | 4 | 4 | 4 | 5 | 5 | 5 | 4 | 4 | 4 | 6 | 7 | 7 | 7 |
| Labour | 1 | 1 | 1 | 1 | 1 | 1 | 1 | 1 | 1 | 1 | 0 | 0 | 0 | 2 | 2 | 2 | 0 | 0 | 0 | 0 |
| Liberal Democrat1 | 0 | 0 | 0 | 0 | 0 | 0 | 0 | 0 | 0 | 0 | 0 | 0 | 0 | 0 | 0 | 0 | 1 | 0 | 0 | 0 |
| Total | 5 | 5 | 5 | 5 | 5 | 5 | 5 | 5 | 5 | 5 | 5 | 5 | 5 | 6 | 6 | 6 | 7 | 7 | 7 | 7 |
11974 & 1979 - Liberal Party; 1983 & 1987 - SDP-Liberal Alliance
Maps
 1974 Feb
- 1974 Oct
- 1979
 1983
1983- 1987
- 1992
 1997
1997- 2001
- 2005
 2010
2010 2015
2015- 2017
- 2019
Historical representation by party
A cell marked → (with a different colour background to the preceding cell) indicates that the previous MP continued to sit under a new party name.
1885 to 1918
Conservative Liberal Liberal Unionist
| Constituency | 1885 | 1886 | 1892 | 1895 | 97 | 98 | 00 | 1900 | 05 | 1906 | Jan 1910 | Dec 1910 | 11 | 18 |
|---|---|---|---|---|---|---|---|---|---|---|---|---|---|---|
| Westbury | Fuller | Chaloner | Fuller | Howard | ||||||||||
| Cricklade | Maskelyne | → | Husband | Hopkinson | FitzMaurice | Massie | Calley | Lambert | ||||||
| Chippenham | Fletcher | Bruce | Dickson-Poynder | → | Terrell | |||||||||
| Devizes | Long | Hobhouse | Goulding | Rogers | Peto | |||||||||
| Salisbury | Grenfell | Hulse | Allhusen | Palmer | Tennant | Locker-Lampson | ||||||||
| Wilton | Grove | → | Pleydell-Bouverie | J. Morrison | Morse | Bathurst | H. Morrison | |||||||
1918 to 1974
| Constituency | 1918 | 1922 | 1923 | 1924 | 27 | 1929 | 31 | 1931 | 34 | 1935 | 42 | 43 | 1945 | 1950 | 1951 | 1955 | 1959 | 62 | 64 | 1964 | 65 | 1966 | 69 | 1970 |
|---|---|---|---|---|---|---|---|---|---|---|---|---|---|---|---|---|---|---|---|---|---|---|---|---|
| Chippenham | Terrell | Bonwick | Cazalet | Eccles | Awdry | |||||||||||||||||||
| Westbury | Palmer | Darbishire | Shaw | Long | Grimston | Walters | ||||||||||||||||||
| Devizes | Bell | Macfadyen | Hurd | Hollis | Pott | C. Morrison | ||||||||||||||||||
| Salisbury | H. Morrison | Moulton | H. Morrison | Despencer-Robertson | J. Morrison | Hamilton | ||||||||||||||||||
| Swindon | Young | Banks | Addison | Banks | Addison | Wakefield | Reid | Noel-Baker | Ward | Stoddart | ||||||||||||||
1974 to present
Conservative Labour Liberal Democrats
| Constituency | Feb 1974 | Oct 1974 | 1979 | 1983 | 1987 | 1992 | 1997 | 2001 | 2005 | 2010 | 2015 | 2017 | 2019 |
|---|---|---|---|---|---|---|---|---|---|---|---|---|---|
| Chippenham (2010) | Hames | Donelan | |||||||||||
| Chippenham / N Wiltshire (1983) | Awdry | Needham | Gray | ||||||||||
| Devizes | Morrison | Ancram | Perry | Kruger | |||||||||
| Salisbury | Hamilton | Key | Glen | ||||||||||
| Westbury / South West Wiltshire (2010) | Walters | Faber | Murrison | ||||||||||
| Swindon / South Swindon (1997) | Stoddart | Coombs | Drown | Snelgrove | Buckland | ||||||||
| North Swindon (1997) | Wills | Tomlinson | |||||||||||
Notes
- BC denotes borough constituency, CC denotes county constituency.
- The majority is the number of votes the winning candidate receives more than their nearest rival.
References
- Baker, Carl; Uberoi, Elise; Cracknell, Richard (2020-01-28). "General Election 2019: full results and analysis". Cite journal requires
|journal=(help) - "Constituencies A-Z - Election 2019". BBC News. Retrieved 2020-04-25.
- The Boundary Commission for England recommended that the county should be divided into seven constituencies. These changes were implemented at the 2010 United Kingdom general election.
- "Update: Strengthening Democracy:Written statement - HCWS183". UK Parliament. Retrieved 2020-04-20.
- "Parliamentary Constituencies Act 2020".
- "2023 Review launched | Boundary Commission for England". Retrieved 2021-01-08.
- Watson, Christopher; Uberoi, Elise; Loft, Philip (2020-04-17). "General election results from 1918 to 2019". Cite journal requires
|journal=(help)
1. https://www.bbc.co.uk/news/politics/constituencies 2.http://geo.digiminster.com/election/2015-05-07/Search?Query=wiltshire