List of countries by rail usage
This is a list of countries by rail usage. Rail usage may be measured in tonne-kilometres (tkm) or passenger-kilometres (pkm) travelled for freight and passenger transport respectively. This is the number of tonnes or passengers multiplied by the average distance of their journeys in kilometres.
Overview
Almost 10,000 billion freight tonne-kilometres are travelled around the world. Roughly one quarter of these are travelled in the United States, another quarter in China, and a third in Russia. Of the 3,000bn passenger-kilometres travelled across the world, 1,346bn of these are travelled solely in China. The average Swiss person travels 2,430 km by train each year, almost 500 more than the average Japanese person (the Japanese having the second-highest average kilometres travelled per passenger in the world).
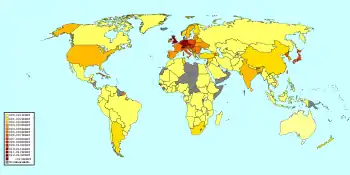
In 2014, there were around 1 million kilometres of railway in the world (a decrease of 3% compared to 2013). Of this, 350,000 km were in Europe and mainly used for passenger service, 370,000 km were in North America and mainly used for freight, and 230,000 km were in Asia and used for both freight and passenger service.[1] In America and Europe, there are many low cost airlines and motorways which compete with rail for passenger traffic, while Asia has seen a large growth in high-speed rail with 257bn pkm representing 72% of total world high-speed rail passenger traffic.[1]
Passenger rail
These figures do not include metro railway systems; see Lists of rapid transit systems for metro rail statistics.
Passenger-kilometres of rail transport per year
Countries with more than five billion passenger-kilometres (pkm) travelled per year. Unless otherwise specified, data come from the Railway Statistics 2015 Report by the International Union of Railways (UIC).
| Rank | Country/Region | Billion passenger-kilometres | Data year |
|---|---|---|---|
| 1 | 1,471[2] | 2019 | |
| 2 | 1,161[3] | 2017 | |
| 3 | 431.8[3] | 2016 | |
| 4 | 129.4[3] | 2018 | |
| 5 | 110.5[3] | 2017 | |
| 6 | 95.5[3] | 2017 | |
| 7 | 80.2[3] | 2017 | |
| 8 | 77.8[3] | 2016 | |
| 9 | 52.2[3] | 2017 | |
| 10 | 37.1 | 2015 | |
| 11 | 27.5[3] | 2017 | |
| 12 | 20.8[3] | 2017 | |
| 13 | 20.3 | 2015 | |
| 14 | 20.3[3] | 2015 | |
| 15 | 19.8 | 2015 | |
| 16 | 18.5 | 2015 | |
| 17 | 18.4[3] | 2017 | |
| 18 | 16.6 | 2011 | |
| 19 | 16.3 | 2014 | |
| 20 | 15.7[3] | 2015 | |
| 21 | 13.3[3] | 2017 | |
| 22 | 12.6[3] | 2017 | |
| 23 | 10.6[3] | 2017 | |
| 24 | 10.2[3] | 2017 | |
| 25 | 9.5[3] | 2017 | |
| 26 | 9.0[3] | 2013 | |
| 27 | 8.4[3] | 2017 | |
| 28 | 7.7[3] | 2017 | |
| 29 | 7.5 | 2011 | |
| 30 | 7.3 | 2010 | |
| 31 | 6.7[3] | 2016 | |
| 32 | 5.7[3] | 2015 | |
| 33 | 5.3 | 2014 | |
| World | 2,954 | 2014 | |
| 583.7 | 2015 |
Passengers carried in rail transport per year
Countries with more than 20 million passengers per year. Unless otherwise specified, data come from the Railway Statistics 2019 Report by the International Union of Railways.
| Rank | Country | Million passengers | Data year | Notes |
|---|---|---|---|---|
| 1 | 9,392 | 2016[4] | Includes only the JR group rail companies. Including all passenger rail the figure in 2016 was 24.6 billion | |
| 2 | 8,418 | 2018 | Includes Indian Railways suburban and intercity traffic only, excludes the passengers carried by rapid transit systems. The Delhi Metro alone transported 1.73 billion passengers in 2018. | |
| 3 | 3,660 | 2019[5] | Excludes most urban passenger trips which are handled by rapid transit systems. Rapid transit lines in China alone handled 23.71 billion passengers in 2019.[6] | |
| 4 | 2,865.1 | 2018 | ||
| 5 | 1,762.7 | 2018 | The London Underground ("The Tube") had an additional 1.34 billion passengers in 2015-16[7] | |
| 6 | 1,762 | 2017 | Includes only SNCF services[8] and RATP sections of the RER.[9] | |
| 7 | 1,157.2 | 2018 | Moscow Metro alone had 2.45 billion passengers in 2014[10] | |
| 8 | 1,125.8 | 2018 | CPTM[11] and SuperVia [12] commuter rail networks alone | |
| 9 | 883.3 | 2019[13] | ||
| 10 | 702.9 | 2016–17 | Heavy urban passenger rail statistics (not including long-distance)[14] | |
| 11 | 636 | 2019[15] | Madrid Metro alone had 657.2 million passengers in 2018.[16] | |
| 12 | 550 | 2018 | ||
| 13 | 533 | 2017 | Amtrak had 32.5 million passengers in Fiscal Year 2017 (ending September 30).[17] Among regional systems that report to the American Public Transportation Association, there were 502.5 million commuter rail riders in calendar year 2019.[18] | |
| 14 | 482.3 | 2018[19] | ||
| 15 | 426.2 | 2018 | 423,202,522 Buenos Aires commuter[20] 2,036,792 regional[21] 1,009,357 long distance | |
| 16 | 399 | 2014 | ||
| 17 | 393.3 | 2018 | ||
| 18 | 324.1 | 2019[13] | Passengers carried by all rail passenger transport companies in Poland.[22] | |
| 19 | 320 | 2015 | ||
| 20 | 291.84 | 2018 | ||
| 21 | 269 | 2017–18[23] | ||
| 22 | 278 | 2019[13] | Vienna U-Bahn alone had 463.1 million passengers in 2018.[24] | |
| 23 | 264.6 | 2019[13] | Stockholm metro alone had 353 million passengers in 2017.[25] | |
| 24 | 246.94 | 2018 | ||
| 25 | 206.6 | 2018 | ||
| 26 | 193.5 | 2019[13] | Prague Metro alone had 435.6 million passengers in 2017.[26] | |
| 27 | 175.5 | 2019[13] | Lisbon Metro alone had 169 million passengers in 2018.[27] | |
| 28 | 138.66 | 2017 [28] | ||
| 29 | 127.84 | 2018 | ||
| 30 | 119 | 2018 | Budapest Metro alone had 409.3 million passengers in 2017.[29] | |
| 31 | 101 | 2018 | Istanbul Metro alone had 469.7 million passengers in 2018.[30] | |
| 32 | 92.8 | 2019[31] | 14.9 million / year long-distance 77.9 million / year in Helsinki commuter traffic | |
| 33 | 84 | 2017[32] | ||
| 34 | 80 | 2019[13] | ||
| 35 | 79.86 | 2018 | Minsk Metro alone had 293.7 million passengers in 2019.[33] | |
| 36 | 77.81 | 2018 | ||
| 37 | 73.51 | 2017[34] | Oslo Metro alone had 122 million passengers in 2018.[35] | |
| 38 | 67.9 | 2019[13] | Bucharest Metro alone had 178.9 million passengers in 2017.[36] | |
| 39 | 67.69 | 2018 | Heavy rail only. The Jerusalem Light Rail had an additional 42.5 million passengers in 2017.[37] | |
| 40 | 57 | 2018 | Tren Suburbano statistics only[38] | |
| 41 | 52.39 | 2018 | ||
| 42 | 50.06 | 2019[13] | ||
| 43 | 50 | 2017[39] | Bangkok MRT alone had 113.7 million passengers in 2018.[40] | |
| 44 | 48 | 2017[41] | ||
| 45 | 47 | 2018[42] | Santiago Metro alone had 721 million passengers in 2018.[43] | |
| 46 | 44.51 | 2018 | ||
| 47 | 41 | 2017 | ||
| 48 | 39 | 2018 | Algiers Metro alone had 40 million passengers in 2018.[44] | |
| 49 | 35 | 2018 | ||
| 50 | 35 | 2019[45] | ||
| 51 | 28.09 | 2018 | Tehran Metro alone had 721 million passengers in 2016.[46] | |
| 52 | 25 | 2019 | ||
| 53 | 22.9 | 2018 | ||
| 54 | 21.84 | 2018 | ||
| 55 | 21.59 | 2018 | Tashkent Metro alone had 71.2 million passengers in 2019.[33] | |
| 56 | 21.3 | 2019 | Sofia Metro alone had 93.1 million passengers in 2018.[47] |
Passenger modal share for rail
The modal share of railway transport (excluding tram & metro) as compared to other modes of transport.
| Rank | Country | Modal share (%) | year |
|---|---|---|---|
| 1 | 37.2 | 2016[4][48] | |
| 2 | 24.4 | 2018[49] | |
| 3 | 20.9 | 2017[50] | |
| 4 | 12.1 | 2016[51] | |
| 5 | 11.0 | 2016[51] | |
| 6 | 10.0 | 2018[52] | |
| 7 | 9.7 | 2016[51] | |
| 8 | 9.4 | 2016[51] | |
| 9 | 9.3 | 2016[51] | |
| - | 9.3 | 2016[51] | |
| 10 | 8.9 | 2016[51] | |
| 11 | 8.8 | 2016[51] | |
| 12 | 8.6 | 2016[51] | |
| - | 8.6 | 2016[51] | |
| 14 | 7.7 | 2016[51] | |
| 15 | 7.3 | 2016[51] | |
| 16 | 6.6 | 2016[51] | |
| 17 | 6.3 | 2005[53] | |
| 18 | 6.1 | 2012[54] | |
| 19 | 5.6 | 2016[51] | |
| 20 | 5.1 | 2016[51] | |
| 21 | 4.6 | 2016[51] | |
| 22 | 4.2 | 2016[51] | |
| - | 4.2 | 2016[51] | |
| 24 | 3.4 | 2016[51] | |
| 25 | 2.9 | 2016[51] | |
| 26 | 2.7 | 2016[51] | |
| 27 | 2.2 | 2016[51] | |
| 28 | 2.0 | 2016[51] | |
| - | 2.0 | 2016[51] | |
| 30 | 1.4 | 2016[51] | |
| 31 | 1.0 | 2016[51] | |
| - | 1.0 | 2016[51] | |
| - | 1.0 | 2016[51] | |
| 34 | 0.3 | 2004[55] |
Passenger rail by passenger-kilometres per capita
Countries with more than five billion passenger-kilometres travelled per year.
| Country | Kilometers/year | Year |
|---|---|---|
| 2430.9 | 2013[56][57] | |
| 2,142 | 2016[4][Note 1] | |
| 1,505 | 2018[58] | |
| 1,329 | ||
| 1,298[59] | 2014 | |
| 1,220 | ||
| 1,150 | ||
| 1,030 | ||
| 1,009 | ||
| 981[60] | 2015 | |
| 959[61] | 2014 | |
| 940 | ||
| 880 | ||
| 780 | ||
| 777 | ||
| 690 | ||
| 660 | ||
| 653 | ||
| 650 | ||
| 620 | ||
| 550 | ||
| 460 | ||
| 450 | ||
| 410 | ||
| 380 | ||
| 180 | ||
| 170 | ||
| 160 | ||
| 150 | ||
| 110 | ||
| 80 | ||
| 80 |
Freight rail
Tonne-kilometres of rail transport per year
Countries with more than one billion tonne-kilometres (tkm) travelled per year. Unless otherwise specified, data come from the Railway Statistics 2014 Report by the International Union of Railways.
| Rank | Country | Billion tkm | Data year |
|---|---|---|---|
| 1 | 3,018[2] | 2019 | |
| 2 | 2,596[62] | 2018 | |
| 3 | 2,326[63] | 2016 | |
| 4 | 1223[64] | 2018 | |
| 5 | 352 | 2011 | |
| 6 | 267 | 2014 | |
| — | 261 | 2014 | |
| 7 | 237 | 2011 | |
| 8 | 236 | 2012 | |
| 9 | 198[65] | 2008 | |
| 10 | 135 | 2014 | |
| 11 | 126.9[66] | 2017 | |
| 12 | 113[67] | 2019 | |
| 13 | 53.8[68] | 2019 | |
| 14 | 45 | 2014 | |
| 15 | 31.8[69] | 2019 | |
| 16 | 24.4[70] | 2014 | |
| 17 | 22 | 2012 | |
| 18 | 22 | 2013 | |
| 19 | 21.7[71] | 2019 | |
| 20 | 21.1[72] | 2014 | |
| 21 | 21[73] | 2014 | |
| 22 | 21[74] | 2019 | |
| 23 | 16.2[75] | 2019 | |
| 24 | 16.2[76] | 2019 | |
| 25 | 15[77] | 2019 | |
| 26 | 14.7[78] | 2019 | |
| 27 | 12 | 2010 | |
| 28 | 12 | 2012 | |
| 29 | 12 | 2009 | |
| 30 | 11[79] | 2019 | |
| 31 | 10.3[80] | 2019 | |
| 32 | 10 | 2013 | |
| 33 | 10 | 2014 | |
| 34 | 9.6[1] | 2014 | |
| 35 | 8 | 2014 | |
| 36 | 8 | 2010 | |
| 37 | 7 | 2010 | |
| 38 | 6[81] | 2013 | |
| 39 | 6 | 2011 | |
| 40 | 5 | 2014 | |
| 41 | 4[81] | 2013 | |
| 42 | 4 | 2009 | |
| 43 | 4 | 2012 | |
| 44 | 3 | 2011 | |
| 45 | 3 | 2014 | |
| 46 | 3 | 2011 | |
| 47 | 2.2[82] | 2019 | |
| 48 | 2 | 2014 | |
| 49 | 2 | 2014 | |
| 50 | 2[81] | 2013 | |
| 51 | 2 | 2010 | |
| 52 | 2 | 2010 | |
| 53 | 1.7 | 2014[83] | |
| 54 | 1.4 | 2016[84] | |
| 55 | 1 | 2012 | |
| 56 | 1 | 2011 |
Tonnes carried in rail transport per year
Countries with more than ten million tonnes carried per year. Unless otherwise specified, data come from the Railway Statistics 2014 Report by the International Union of Railways.
| Rank | Country | Million tonnes | Data year |
|---|---|---|---|
| 1 | 4,389[2] | 2019 | |
| 2 | 1,710 | 2011 | |
| 3 | 1,298[85] | 2014 | |
| 4 | 1,221[86] | 2018 | |
| 5 | 1,218[87] | 2015 | |
| 6 | 460 | 2014 | |
| 7 | 457 | 2011 | |
| 8 | 310 | 2011 | |
| 9 | 295 | 2012 | |
| 10 | 225 [88] | 2015 | |
| 11 | 221 | 2014 | |
| 12 | 197 | 2011 | |
| 13 | 141 | 2014 | |
| 14 | 128 | 2018 | |
| 15 | 110.1[89] | 2014 | |
| 16 | 82 | 2014 | |
| 17 | 74 | 2014 | |
| 18 | 65 [90] | 2015 | |
| 19 | 63 | 2011 | |
| 20 | 59 | 2014 | |
| 21 | 57 | 2014 | |
| 22 | 57 | 2014 | |
| 23 | 50[1] | 2014 | |
| 24 | 49 | 2014 | |
| 25 | 44 | 2014 | |
| 26 | 40 | 2013 | |
| 27 | 38 | 2014 | |
| 28 | 37 | 2014 | |
| 29 | 37 | 2009 | |
| 30 | 36 | 2014 | |
| 31 | 37 | 2011 | |
| 32 | 33 | 2013 | |
| 33 | 31 | 2010 | |
| 34 | 27 | 2012 | |
| 35 | 26 | 2014 | |
| 36 | 26 | 2012 | |
| 37 | 25 | 2014 | |
| 38 | 25 | 2013 | |
| 39 | 24 | 2010 | |
| 40 | 23 | 2012 | |
| 41 | 20 | 2012 | |
| 42 | 20 | 2010 | |
| 43 | 18 | 2011 | |
| 44 | 17 | 2014 | |
| 45 | 13 | 2014 | |
| 46 | 12 | 2011 | |
| 47 | 12 | 2014 | |
| 48 | 11 | 2012 | |
| 49 | 11 | 2011 | |
| 50 | 10 | 2014 | |
| 51 | 10 | 2012 |
Freight modal share for rail
The modal share carried by rail of all freight in a given country.
| Rank | Country | Modal share (%) | Data year |
|---|---|---|---|
| 1 | 68[91] | 2009 | |
| 2 | 61[92] | 2012 | |
| 3 | 59[91] | 2010 | |
| 4 | 47[92] | 2012 | |
| 5 | 46[56] | 2012 | |
| 6 | 44[91] | 2008 | |
| 7 | 41[92] | 2012 | |
| 8 | 40[92] | 2012 | |
| 9 | 40[93] | 2009 | |
| 10 | 38[92] | 2012 | |
| 12 | 33[94] | 2016 | |
| 11 | 31[91] | 2009 | |
| 13 | 27[92] | 2012 | |
| 14 | 25[95] | 2005 | |
| 15 | 24[92] | 2012 | |
| 16 | 23[92] | 2012 | |
| 17 | 22[92] | 2012 | |
| 18 | 21[92] | 2012 | |
| 19 | 20[92] | 2012 | |
| 20 | 18[92] | 2012 | |
| 21 | 18[92] | 2012 | |
| 22 | 15[92] | 2012 | |
| 23 | 14[92] | 2012 | |
| 24 | 12[92] | 2012 | |
| 25 | 9[92] | 2012 | |
| 26 | 6.2[91] | 2010 | |
| 27 | 5[92] | - | |
| 28 | 0.7[96] | 2007 | |
Freight rail by tonne-kilometres per capita
| Rank | Country | Tonne-kilometre per capita | Data year |
|---|---|---|---|
| 1 | 12,599 | ||
| 2 | 10,517 | ||
| 3 | 9,165 | ||
| 4 | 2,308 | ||
| 5 | 2,150 | ||
| 6 | 1,480[56][57] | 2013 | |
| 7 | 1,060 | ||
| 782 |
Brief railway statistics by country
| Country | area (million km2) | pop (million) | Rail company | Net (thousand km) | Double (thousand km) | Electrified (thousand km) | HSR (thousand km) | passenger-km (billion) | tonne-km (billion) | HS. pkm | Pass. modal % | Frt. modal % | Pass/ pop % | Elec % |
|---|---|---|---|---|---|---|---|---|---|---|---|---|---|---|
| 0.08 | 8.57 | ÖBB | 9.8[97] | 4.9[97] | 3.5[97] | 0.28 | 11.2[97] | 32.9[97] | 12.1[51] | 41[92] | 73 | |||
| 8.54 | 209 | 29 | 0.5 | 232 | ||||||||||
| 9.6 | 1,397[98] | CR | 141[2] | 83 | 100 | 36 | 1470 | 3018 | 200 | 31 | 71.9 | |||
| 1 | 93 | ENR | 5 | 1.5 | 0.07 | 41 | 4 | 6.1 | ||||||
| 0.55 | 64 | SNCF | 29 | 16 | 14 | 1.8 | 81 | 40 | 48 | 16.8 | ||||
| 0.36 | 80.68 | DB | 34 | 18 | 20 | 1.2 | 74 | 91 | 22 | 10 | 17 | 22.4 | 60 | |
| 3.28 | 1,326 | IR | 67.3 | 17.4 | 40.5 | 696 | 481 | 5.5 | 64 | |||||
| 1.6 | 80.04 | RAI | 7 | 1 | 0.15 | 0.25 | 13 | 21 | 0 | 4 | 7 | 0.3 | 1 | |
| 0.3 | 59 | FS | 16 | 7 | 12 | 0.82 | 45 | 21 | 9 | |||||
| 0.38 | 126 | JR | 20 | 8 | 12 | 2.5 | 253 | 23 | 79 | 29 | 69.6 | 100 | ||
| 2.72 | 17 | KTZ | 14 | 5 | 4 | 14 | 191 | |||||||
| 0.44 | 34 | ONCFM | 2 | 0.6 | 1 | 4 | 6 | 0.8 | 89 | |||||
| 0.04 | 17 | NS | 3.2 | 2.0 | 2.3 | 0.1 | 17.8 | 6 | 8.8 | 5 | 76.4 | |||
| .796 | 192 | PR | 7 | 0.3 | 26 | 6 | ||||||||
| 0.31 | 38 | PKP | 19 | 9 | 12 | |||||||||
| 17.09 | 143 | RZD | 128 | 36 | 48 | 1.3 | 173 | 2090 | 14 | 42 | 67 | 9.1 | 80 | |
| 0.049 | 5.45 | ŽSR | 3.627[99] | 1.587[99] | 0 | 3.815[100] | 6.729[100] | 0 | ||||||
| 1.22 | 54 | SAR | 24 | 2 | 8 | 14 | 109 | 11 | ||||||
| 0.1 | 50 | KNR | 3 | 1 | 2 | 0.32 | 32 | 11 | 10 | 20.4 | 20 | |||
| 0.51 | 46 | Renfe | 15 | 5 | 9 | 1.27 | 21 | 11 | 4 | |||||
| 0.041 | 8.38 | SBB | 4 | 2 | 3 | 15 | 13 | 40.9 | 100 | |||||
| 0.036 | 23 | TRA | 1 | 0.67 | 0.69 | 0.33 | 9 | 1 | ||||||
| 0.78 | 79 | TCDD | 9 | 04 | 1.9 | 0.25 | 6 | 10 | 24 | |||||
| 0.24 | 65 | NR | 16 | 5 | 0.3 | 48 | 21 | 65 | ||||||
| 9.6 | 324 | AMTK | 227 | 2820 | 42 | 1 | ||||||||
| World | 149 | 7,432 | 900 | 250 | 240 | 35.44 | 2468 | 9486 | 178 | 10 | 20 | 50 |
Notes
- Only includes JR rail group companies. Including all passenger rail the figure is 3,400.
References
- "Railway Statistics – 2014 Synopsis" (PDF). Paris, France: UIC (International Union of Railways). 2014. Retrieved November 8, 2015.
- "2019 年铁道统计公报" (PDF). www.mot.gov.cn.
- "Transport - Passenger transport - OECD Data". OECD.
- "Statistical handbook of Japan" (PDF) (online statistics). stat.go.jp. 2018. Retrieved 2019-09-26.
- (Chinese) 2019 年铁道统计公报 - 2019 Railway statistical bulletin
- "详情". www.camet.org.cn. Retrieved 2020-07-01.
- "Facts & Figures". London: Transport for London.
- "Memento statistiques SNCF Mobilités 2017" (PDF). La Plaine Saint-Denis, France: SNCF Mobilités. 2017. p. 14. Retrieved 2 May 2019.
- "Trafic annuel et journalier", file "trafic annuel tous modes 2000-2017.xlsx" (XLS), 2017. Observatoire de la mobilité en Île-de-France. Retrieved 5 May 2019.
- "Moscow Metro in numbers".
- "RELATÓRIO INTEGRADO DA ADMINISTRAÇÃO 2018" (PDF). empresaspublicas.imprensaoficial.com.br. 8 March 2019. Retrieved 31 August 2020.
- "Com perda de 7 mi de passageiros, Supervia pede R$ 65 milhões para manter operações". gauchazh.clicrbs.com.br. 9 April 2020. Retrieved 31 August 2020.
- "Railway passenger transport statistics" (PDF). Europa EU. 8 December 2019. Retrieved 9 January 2021.
- "Trainline 6 – Statistical Report" (PDF). www.bitre.gov.au.
- "Los usuarios de avión suben un 6,4% en 2019 y los del AVE aumentan un 4,9%". El País (in Spanish). 11 February 2020. Retrieved 13 April 2020.
- "Evolución de la demanda – Cierre año 2018" [Evolution of demand – End of 2018] (PDF) (in Spanish). Metro de Madrid. 11 February 2019. p. 2. Retrieved 2019-03-10.
- "Amtrak tours record ridership, revenue for fiscal 2019". Washington Post. 2019-11-08. Retrieved 2020-09-12.
- "2019 Public Transport FACT BOOK" (PDF). American Public Transportation Association. Retrieved 2020-09-12.
- "Railway passenger transport statistics - Europa EU" (PDF). ec.europa.eu. 15 January 2019. Retrieved 9 November 2019.
- "2018 Informe Estadistico Annual - Red ferroviaria de pasajeros del área metropolitano de Buenos Aires" (PDF). www.argentina.gob.ar. Retrieved 31 August 2020.
- "Informe Estadístico - Gerencia de Control de Gestión Ferroviaria" (PDF). www.argentina.gob.ar. Retrieved 31 August 2020.
- Internet, JSK. "Passenger rail transport results 2015".
- "Deliberate train fires cost South African rail service $42.5 mln". Reuters. 9 October 2019. Retrieved 3 December 2019.
- "2018 Zahlen, Daten, Fakten – Unternehmen" [Company Profile – Figures, Data, Facts 2018] (PDF) (in German). Wiener Linien. March 2019. p. 3. Retrieved 2019-06-14.
- "Hållbarhetsredovisning 2017, året i korthet" (in Swedish). MTR Nordic. 2018. Retrieved 2018-12-02.
- "Annual Report 2017" (PDF). Dopravní podnik hlavnívo města Prahy (DPP). April 2018. p. 20. Archived from the original (PDF) on 2018-08-13. Retrieved 2018-08-13.
- https://www.metrolisboa.pt/institucional/wp-content/uploads/sites/2/2019/01/07_PRRecordeMetroPassageiros2018.pdf
- "Performance Report - 2017 Department of Sri Lanka Railways" (PDF). www.railway.gov.lk.
- "Magyarország, 2017" [Hungary, 2017] (PDF) (in Hungarian). Központi Statisztikai Hivatal [Central Statistics Bureau]. 2018-04-15. p. 173. Retrieved 2018-08-01.
- "Hat Bazlı Yıllık Yolculuk Sayıları (2018)" [Number of Annual Journeys by Line (2018)] (PDF) (in Turkish). Metro İstanbul A.Ş. pp. 1–6. Retrieved 2019-12-04 – via Yolcu İstatistikleri.
- "Growth continued in passenger traffic by rail in Finland in 2019". Statistics Finland. 27 August 2020. Retrieved 9 January 2021.
- "Canada's Passenger Railways: Moving People". www.railcan.ca. Retrieved 2 December 2019.
- Основные технико-эксплуатационные характеристики метрополитенов за 2019 год [Main technical and operational specifications for Subways in Year 2019] (PDF) (in Russian). Международная Ассоциация "Метро" [International Association of Metros]. Retrieved 2020-08-25.
- "Passenger transport by rail" (in Norwegian). Ssb.no. 2018-12-10. Retrieved 2019-03-01.
- "Nøkkeltall" [Key figures] (in Norwegian). Ruter As. Retrieved 2019-10-28.
- "Activity Report – 2017" (pdf). Metrorex S.A. p. 36. Retrieved 2019-06-14.
- "ביצוע תקציב 2017" [Budget Report 2017] (PDF) (in Hebrew). Israel Ministry of Transport. 2018. Retrieved May 24, 2018.
- Juárez, Pilar (December 7, 2018). "Tren Suburbano alcanza viabilidad financiera". Milenio (in Spanish). Mexico City. Retrieved May 28, 2020.
- "50 Years of Reliable Rail in Thailand". GE Report.
- "Ridership Report". www.bemplc.co.th. Bangkok Expressway and Metro Public Company Ltd. Retrieved 2019-06-14.
- "Railway rider numbers grow after management revamp". Myanmar Times. 20 February 2018. Retrieved 3 December 2019.
- "The renaissance of the train in Chile". Chile Today. 10 January 2019. Retrieved 24 April 2019.
- "Memoria Anual 2018" [2018 Annual Report] (PDF) (in Spanish). Metro de Santiago. 29 March 2019. p. 19. Retrieved 2019-06-20 – via .
- "Statistiques voyageur" [Passenger statistics] (in French). EMA - Entreprise Metro d’Alger. Archived from the original on 22 July 2017.
- "KiwiRail Annual Integrated Report 2019" (PDF). KiwiRail. 2019. Retrieved 2 December 2019.
- هر ۳۴۰۰ مسافر یک واگن مترو.
- Ilkova, A., ed. (29 May 2020). "Statistical Yearbook 2019" (PDF). www.nsi.bg. National Statistical Institute. p. 348. Retrieved 2020-06-06.
- https://www.mlit.go.jp/road/road_e/statistics.html
- "Железнодорожный транспорт России: вызовы до 2025 года". 2014. Archived from the original (PDF) on 2016-08-26.
- "Transport - Bundesamt für Statistik - Leistungen Personenverkehr". B7ndesamt für Statistik (online statistics). Bundesamt für Statistik. 2018. Retrieved 2019-06-16.
- Eurostat (2016). "Passenger Transport Statistics" (PDF). Retrieved August 15, 2019.
- Nandi, Shreya (2020-09-08). "Aim to take modal share of Railways' freight business to 40%: Piyush Goyal". mint. Retrieved 2020-10-29.
- "High Speed Train Project in Indonesia (Jakarta – Surabaya corridor)" (PDF). Ministry of Transportation. Archived from the original (PDF) on 2011-06-14.
- "Modal split of inland passenger transport, 2002 and 2012". eurostat Statistics Explained. Retrieved February 1, 2016.
- "EU Transport in Figures; Statistical Pocketbook". European Commission Directorate-General for Energy and Transport; Eurostat. 2007. Archived from the original on 2008-06-01.
- "Mobility and Transport: Pocket Statistics 2014" (PDF) (Official publication) (in English, German, French, and Italian). Switzerland: Federal Office for Statistics. July 30, 2013. Retrieved 14 October 2014.
- "Mobility and Transport: Key figures" (web page) (in English, German, French, and Italian). Switzerland: Federal Office for Statistics. October 2014. Retrieved 2014-10-14.
- "Deutlich mehr Bahnpassagiere - ORF.at".
- "Population of France 2014".
- "UK Passenger Rail Usage 2014-15" (PDF).
- "Population of Germany 2014".Using above table and population at July 2014
- "РЖД" (PDF).
- "Rail freight transportation - U.S. 2002-2016 | Statistic". Statista.
- "An uphill task: Here are six steps to boost railways' modal share of freight". cnbctv18.com. Retrieved 2020-10-29.
- Bureau of Infrastructure, Transport and Regional Economics; Australian Railway Association (February 2010). "Australian rail freight performance indicators 2007–08" (PDF). bitre.gov.au. p. 38. Archived from the original (PDF) on May 10, 2017. Retrieved September 6, 2016.
- Ferroviario, Agencia Reguladora del Transporte. "Sistema Ferroviario Mexicano". gob.mx (in Spanish). Retrieved 2020-11-09.
- Eurostat (November 2020). "Railway freight transport statistics" (PDF). ec.europa.eu. p. 5. Retrieved January 5, 2020.
- Eurostat (November 2020). "Railway freight transport statistics" (PDF). ec.europa.eu. p. 5. Retrieved January 5, 2020.
- Eurostat (November 2020). "Railway freight transport statistics" (PDF). ec.europa.eu. p. 5. Retrieved January 5, 2020.
- "Freight Britain: Continuity and certainty for rail freight" (PDF). Rail Delivery Group. 2015. p. 3. Archived from the original (PDF) on March 6, 2016. Retrieved September 6, 2016.
- Eurostat (November 2020). "Railway freight transport statistics" (PDF). ec.europa.eu. p. 5. Retrieved January 5, 2020.
- "Railway transport 2014, quarter 4" (PDF). Trafa.se (in Swedish). March 10, 2015. p. 8. Retrieved September 6, 2016.
- "Key Transport Statistics 2014 Data" (PDF). Archived from the original (PDF) on 2015-09-22.
- Eurostat (November 2020). "Railway freight transport statistics" (PDF). ec.europa.eu. p. 5. Retrieved January 5, 2020.
- Eurostat (November 2020). "Railway freight transport statistics" (PDF). ec.europa.eu. p. 5. Retrieved January 5, 2020.
- Eurostat (November 2020). "Railway freight transport statistics" (PDF). ec.europa.eu. p. 5. Retrieved January 5, 2020.
- Eurostat (November 2020). "Railway freight transport statistics" (PDF). ec.europa.eu. p. 5. Retrieved January 5, 2020.
- Eurostat (November 2020). "Railway freight transport statistics" (PDF). ec.europa.eu. p. 5. Retrieved January 5, 2020.
- Eurostat (November 2020). "Railway freight transport statistics" (PDF). ec.europa.eu. p. 5. Retrieved January 5, 2020.
- Eurostat (November 2020). "Railway freight transport statistics" (PDF). ec.europa.eu. p. 5. Retrieved January 5, 2020.
- "IRG–Rail 3rd Annual Market Monitoring Report 2014" (PDF). IRG-Rail. April 3, 2015. p. 31. Archived from the original (PDF) on April 3, 2016. Retrieved September 6, 2016.
- Eurostat (November 2020). "Railway freight transport statistics" (PDF). ec.europa.eu. p. 5. Retrieved January 5, 2020.
- "The CEO Magazine – RVR achieves Net Ton per Kilometer (NTK) target". The CEO Magazine. March 6, 2015. Archived from the original on November 16, 2017. Retrieved March 17, 2015.
- "Railway Services (2011 Classification)" (PDF). Israel Central Bureau of Statistics. August 30, 2017. Retrieved July 7, 2018.
- Bureau of Infrastructure, Transport and Regional Economics; Australian Railway Association (November 2015). "Trainline 3, Statistical Report" (PDF). bitre.gov.au. p. 6. Archived from the original (PDF) on May 11, 2017. Retrieved September 6, 2016.
- https://economictimes.indiatimes.com/industry/transportation/railways/economic-survey-2019-zero-train-collisions-reported-in-2018-19/articleshow/70076320.cms. Missing or empty
|title=(help) - "ЕМИСС".
- Internet, JSK. "Freight rail transport results 2015".
- Amusan, Folusho (May 21, 2015). "Freight Rail Usage 2014-15 Quarter 4 Statistical Release" (PDF). Office of Rail and Road. p. 10. Retrieved September 6, 2016.
- Rail Traffic 2015. Trafikanalys, page 25. Retrieved 2016-12-28.
- OECD Competition Committee (2014). "Recent Developments in Rail Transportation Services" (PDF). The Organisation for Economic Co-operation and Development. p. 40. Retrieved September 6, 2016.
- Statistics Explained (2012). "Freight transport statistics". European Commission. Retrieved May 29, 2015.
- Bureau of Infrastructure, Transport and Regional Economics (2009). "Road and rail freight: competitors or complements?" (PDF). bitre.gov.au. Archived from the original (PDF) on May 10, 2017. Retrieved February 4, 2016.
- Anirban Chowdhury (2016). "Railway Budget 2016: Suresh Prabhu announces measures for freight to increase modal share". Economic Times (India). Retrieved Dec 18, 2016.
- "Prices, Investment and Efficiency on the Railways" (PDF). The Department of Trade and Industry (Republic of South Africa). 2008. p. 134. Retrieved December 19, 2016.
- Derval Cummins, Booz and Company (2009). "Rail Freight in Ireland" (PDF). Engineers Ireland. p. 22. Retrieved December 18, 2016.
- ÖBB-Holding AG (2018). "Zahlen Daten Fakten 2017" (PDF). pp. 4–12. Retrieved August 15, 2019.
- "Population, total - China". data.worldbank.org. World Bank.
- Výročná Správa ŽSR 2018 (PDF) (Report). 2018.
- "RAILISA STAT UIC". uic-stats.uic.org. Retrieved 2020-03-06.
_(%25_of_total_inland_passenger-km)_YB15.png)