List of countries by traffic-related death rate
This list of countries by traffic-related death rate shows the annual number of road fatalities per capita per year, per number of motor vehicles, and per vehicle-km in some countries in the year the data was collected.
According to the World Health Organization, road traffic injuries caused an estimated 1.35 million deaths worldwide in 2016.[2]
That is, one person is killed every 25 seconds. Only 28 countries, representing 449 million people (seven percent of the world's population), have adequate laws that address all five risk factors (speed, drunk driving, helmets, seat-belts and child restraints). Over a third of road traffic deaths in low- and middle-income countries are among pedestrians and cyclists. However, less than 35 percent of low- and middle-income countries have policies in place to protect these road users.[3] The average rate was 17.4 per 100,000 people. Low-income countries now have the highest annual road traffic fatality rates, at 24.1 per 100,000, while the rate in high-income countries is lowest, at 9.2 per 100,000.[3]
74 percent of road traffic deaths occur in middle-income countries, which account for only 53 percent of the world's registered vehicles. In low-income countries it is even worse. Only one percent of the world's registered cars produce 16 percent of world's road traffic deaths. This indicates that these countries bear a disproportionately high burden of road traffic deaths relative to their level of motorization.[3]
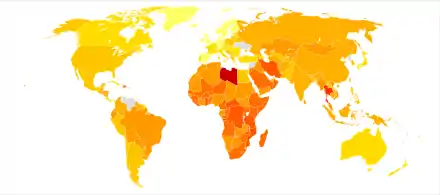
There are large disparities in road traffic death rates between regions. The risk of dying as a result of a road traffic injury is highest in the African Region (26.6 per 100 000 population), and lowest in the European Region (9.3 per 100 000).[3]
Adults aged between 15 and 44 years account for 59 percent of global road traffic deaths. 77 percent of road deaths are males.[4]
The total fatalities figures comes from the WHO report (table A2, column point estimate, pp. 264–271) and are often an adjusted number of road traffic fatalities in order to reflect the different reporting and counting methods among the many countries (e.g., "a death after how many days since accident event is still counted as a road fatality?" (by international standard adjusted to a 30-day period), or "to compensate for under-reporting in some countries".[3][5]:62–74
List
The table shows that the highest death tolls tend to be in African countries, and the lowest in European countries. The table first lists WHO geographic regions before alphabetically sorted countries.
| Country/region | Continent | Road fatalities per 100,000 inhabitants per year[5][2] |
Road fatalities per 100,000 motor vehicles[5][2] |
Road fatalities per 1 billion vehicle-km[6] |
Total fatalities latest year (adjusted/estimated figures by WHO report)[5][2] |
Year, data source (standard source: The WHO report 2015,[3] data from 2013 The WHO report 2018,[2] data from 2016) |
|---|---|---|---|---|---|---|
| World | 18.2 | 1,350,000 | 2016 | |||
| Africa | 26.6 | 574[7] | 246,719[7] | 2016 | ||
| Eastern Mediterranean | 18.0 | 139[7] | 122,730[7] | 2016 | ||
| Western Pacific | 16.9 | 69[7] | 328,591[7] | 2016 | ||
| South-east Asia | 20.7 | 101[7] | 316,080[7] | 2016 | ||
| Americas | 15.6 | 33[7] | 153,789[7] | 2016 | ||
| Europe | 9.3 | 19[7] | 85,629[7] | 2016 | ||
| Asia | 15.5 | 722.4 | 4,734 | 2013 | ||
| Europe | 15.1 | 107.2 | 478 | 2016 | ||
| Africa | 23.8 | 127.8 | 9,337 | 2013 | ||
| Europe | 7.6 | 7.9 | 6 | 2013 | ||
| Africa | 26.9 | 992 | 5,769 | 2013 | ||
| North America | 6.7 | 20 | 6 | 2013 | ||
| South America | 13.6 | 24.3 | 5,619 | 2013 | ||
| Europe | 18.3 | 18.2 | 546 | 2016 | ||
| Oceania | 5.6 | 7.4 | 5.2 | 1,351 | 2016 | |
| Europe | 5.4 | 6.1 | 5.1 | 455 | 2016 | |
| Europe | 10.0 | 70.9 | 943 | 2016 | ||
| North America | 13.8 | 36 | 52 | 2013 | ||
| Asia | 5.2 | 14.3 | 78 | 2017[nb 2][8] | ||
| Asia | 13.6 | 1020.6 | 21,316 | 2013 | ||
| North America | 6.7 | 16.9 | 19 | 2013 | ||
| Europe | 13.7 | 32.9 | 1282 | 2016 | ||
| Europe | 5.4 | 9 | 7.3 | 657 | 2019[9] | |
| North America | 24.4 | 26 | 81 | 2013 | ||
| Africa | 27.5 | 635.6 | 2,986 | 2016 | ||
| Asia | 15.1 | 167.2 | 114 | 2013 | ||
| South America | 23.2 | 205.2 | 3,476 | 2013 | ||
| Europe | 17.7 | 76.7 | 676 | 2016 | ||
| Africa | 23.6 | 91.6 | 477 | 2013 | ||
| South America | 23.4 | 57.5 | 46,935 | 2013 | ||
| Europe | 9 | 17.2 | 601 | 2019[9] | ||
| Africa | 30.0 | 328.1 | 5,072 | 2013 | ||
| Asia | 17.4 | 107.2 | 2,635 | 2013 | ||
| Africa | 27.6 | 1385.1 | 6,136 | 2013 | ||
| North America | 5.8 | 8.9 | 5.1 | 2,118 | 2016 | |
| Africa | 26.1 | 229 | 130 | 2013 | ||
| Africa | 33.6 | 4484.4 | 1,546 | 2016 | ||
| Africa | 24.1 | 497 | 3,089 | 2013 | ||
| South America | 12.4 | 51.1 | 2,179 | 2013 | ||
| Asia | 18.8 | 104.5 | 261,367 | 2016 | ||
| South America | 16.8 | 83.3 | 8,107 | 2013 | ||
| Africa | 26.4 | 1063 | 1,174 | 2013 | ||
| Oceania | 24.2 | 40.2 | 5 | 2013 | ||
| North America | 13.9 | 38.4 | 676 | 2013 | ||
| Europe | 7.3 | 21.1 | 340 | 2019[9] | ||
| North America | 7.5 | 133.7 | 840 | 2013 | ||
| Asia | 5.9 | 9.2 | 60 | 2019[9] | ||
| Europe | 5.8 | 8.6 | 11.5 | 630 | 2019[9] | |
| Africa | 33.7 | 26,529 | 2016 | |||
| Europe | 3.4 | 7.2 | 3.9 | 227 | 2019[9] | |
| Africa | 24.7 | 216 | 2013 | |||
| North America | 15.3 | 44.7 | 11 | 2013 | ||
| North America | 29.3 | 94.9 | 3,052 | 2013 | ||
| South America | 20.1 | 183.8 | 3,164 | 2013 | ||
| Africa | 12.8 | 148.7 | 10,466 | 2013 | ||
| North America | 21.1 | 163.7 | 1,339 | 2013 | ||
| Africa | 24.1 | 2171.5 | 1,527 | 2013 | ||
| Europe | 7.0 | 12.8 | 90 | 2016 | ||
| Africa | 26.7 | 385.7 | 27,326 | 2016 | ||
| Oceania | 5.8 | 58.9 | 51 | 2013 | ||
| Europe | 3.8 | 5 | 5.1 | 260 | 2019[9] | |
| Europe | 5 | 8.4 | 5.8 | 3,585 | 2019[9] | |
| Africa | 22.9 | 196.4 | 383 | 2013 | ||
| Africa | 29.4 | 998.7 | 544 | 2013 | ||
| Europe | 11.8 | 37.4 | 514 | 2016 | ||
| Europe | 3.7 | 6.4 | 4.2 | 3,327 | 2019[9] | |
| Africa | 26.2 | 443.1 | 6,789 | 2013 | ||
| Europe | 6.5 | 12.8 | 699 | 2019[9] | ||
| North America | 19.0 | 114.7 | 2,939 | 2013 | ||
| Africa | 28.2 | 1343.7 | 3,490 | 2016 | ||
| Africa | 27.5 | 751.9 | 468 | 2013 | ||
| South America | 17.3 | 864.4 | 138 | 2013 | ||
| North America | 17.4 | 1021.7 | 1,408 | 2013 | ||
| Asia | 1.1 | -- | -- | -- | 2020 | |
| Europe | 6.2 | 20.7 | 756 | 2019[9] | ||
| Europe | 6.6 | 7.6 | 4.9 | 22 | 2016 | |
| Asia | 16.6 | 130.1 | 207,551 | 2016 | ||
| Asia | 15.3 | 36.7 | 38,279 | 2016 | ||
| Asia | 20.5 | 54.1 | 16,426 | 2016 | ||
| Asia | 20.2 | 151.2 | 6,826 | 2013 | ||
| Europe | 2.9 | 7.5 | 3.8 | 194 | 2019[9] | |
| Asia | 4.2 | 10.7 | 5.9 | 345 | 2016 | |
| Europe | 5.2 | 6.3 | 3,333 | 2019[9] | ||
| Africa | 24.2 | 828.9 | 4,924 | 2013 | ||
| North America | 11.5 | 61.7 | 320 | 2013 | ||
| Asia | 4.1 | 5.7 | 6.4 | 5,224 | 2016 | |
| Asia | 26.3 | 151.4 | 1,913 | 2013 | ||
| Asia | 24.2 | 101.4 | 3,983 | 2016 | ||
| Africa | 29.1 | 640.7 | 12,891 | 2013 | ||
| Oceania | 2.9 | 86.9 | 3 | 2013 | ||
| Asia | 18.7 | 34.2 | 629 | 2013 | ||
| Asia | 22.0 | 127.3 | 1220 | 2016 | ||
| Asia | 14.3 | 67.5 | 971 | 2013 | ||
| Europe | 6.9 | 24.8 | 205 | 2019[9] | ||
| Asia | 22.6 | 64.8 | 1088 | 2016 | ||
| Africa | 28.2 | 474.8 | 584 | 2013 | ||
| Africa | 35.9 | 1,657 | 2016 | |||
| Africa | 26.1 | 46.3 | 1,645 | 2016 | ||
| Europe | 6.6 | 16.1 | 234 | 2019[9] | ||
| Europe | 8.7 | 9.9 | 46 | 2016 | ||
| Europe | 9.4 | 49.1 | 198 | 2016 | ||
| Africa | 28.4 | 2963 | 6,506 | 2013 | ||
| Africa | 31.0 | 5,601 | 2016 | |||
| Asia | 23.6 | 29.8 | 7,374 | 2016 | ||
| Asia | 3.5 | 19.5 | 12 | 2013 | ||
| Africa | 25.6 | 1352.5 | 3,920 | 2013 | ||
| Europe | 5.1 | 6.8 | 22 | 2016 | ||
| Oceania | 5.7 | 141.8 | 3 | 2013 | ||
| Africa | 24.5 | 228.7 | 952 | 2013 | ||
| Africa | 12.2 | 35.6 | 158 | 2013 | ||
| North America | 12.3 | 43 | 27.5 | 15,062 | 2013 | |
| Oceania | 1.9 | 24 | 2 | 2013 | ||
| Europe | 0 | 0 | 2013 | |||
| Asia | 21.0 | 88.4 | 597 | 2016 | ||
| Europe | 10.7 | 31.7 | 67 | 2016 | ||
| Africa | 18.0 | 209 | 6,870 | 2013 | ||
| Africa | 31.6 | 1507 | 8,173 | 2013 | ||
| Asia | 20.3 | 250.8 | 10,809 | 2013 | ||
| Africa | 23.9 | 196.4 | 551 | 2013 | ||
| Asia | 17.0 | 399.8 | 4,713 | 2013 | ||
| Europe | 3.8 | 6 | 4.7 | 648 | 2019[9] | |
| Oceania | 7.8 | 10 | 7.2 | 364 | 2016 | |
| North America | 15.3 | 164.3 | 931 | 2013 | ||
| Africa | 26.4 | 1491.1 | 4,706 | 2013 | ||
| Africa | 20.5 | 615.4 | 35,621 | 2013 | ||
| Europe | 2 | 3 | 3.0 | 110 | 2019[9] | |
| Asia | 25.4 | 85.3 | 924 | 2013 | ||
| Asia | 14.2 | 283.9 | 25,781 | 2013 | ||
| Oceania | 4.8 | 14.1 | 1 | 2013 | ||
| North America | 10.0 | 38.4 | 386 | 2013 | ||
| Oceania | 16.8 | 1306.5 | 1,232 | 2013 | ||
| South America | 20.7 | 114.7 | 1,408 | 2013 | ||
| South America | 13.9 | 99.3 | 4,234 | 2013 | ||
| Asia | 10.5 | 135 | 10,379 | 2013 | ||
| Europe | 7.7 | 13.5 | 3,698 | 2019[9] | ||
| Europe | 6.3 | 11.7 | 768 | 2019[9] | ||
| Asia | 15.2 | 50.9 | 330 | 2013 | ||
| Europe | 12.5 | 61.8 | 437 | 2016 | ||
| Europe | 9.6 | 31.4 | 1,881 | 2019[9] | ||
| Europe | 18.9 | 50 | 27,025 | 2016 | ||
| Africa | 32.1 | 3521.1 | 3,782 | 2013 | ||
| North America | 18.1 | 2103.3 | 33 | 2013 | ||
| North America | 8.2 | 31.7 | 9 | 2013 | ||
| Oceania | 15.8 | 171.9 | 30 | 2013 | ||
| Europe | 3.2 | 1.8 | 1 | 2013 | ||
| Africa | 27.5 | 161.5 | 55 | 2016 | ||
| Asia | 27.4 | 119.7 | 7,898 | 2013 | ||
| Africa | 27.2 | 956.4 | 3,844 | 2013 | ||
| Europe | 7.6 | 28.4 | 649 | 2019[9] | ||
| Africa | 8.6 | 43 | 8 | 2013 | ||
| Africa | 27.3 | 2414.2 | 1,661 | 2013 | ||
| Asia | 3.6 | 20.2 | 197 | 2013 | ||
| Europe | 4.5 | 12.7 | 330 | 2019[9] | ||
| Europe | 4.9 | 9.5 | 7.0 | 134 | 2019[9] | |
| Oceania | 19.2 | 240 | 108 | 2013 | ||
| Africa | 25.4 | 6532.5 | 3,884 | 2016 | ||
| Africa | 25.1 | 133.9 | 13,273 | 2013 | ||
| Asia | 6.5 | 13 | 13.8[6] | 3,349 | 2019[10] | |
| Europe | 3.7 | 5.8 | 1,922 | 2019[9] | ||
| Asia | 17.4 | 70.9 | 3,691 | 2013 | ||
| Africa | 24.3 | 2872.8 | 9,221 | 2013 | ||
| South America | 19.1 | 49.7 | 103 | 2013 | ||
| Africa | 24.2 | 1667.4 | 303 | 2013 | ||
| Europe | 2.2 | 4.6 | 3.8 | 223 | 2019[9] | |
| Europe | 2.2 | 3.7 | 3.2 | 223 | 2019[9] | |
| Asia | 7.8[nb 3] | 1,849[nb 3] | 2019[nb 3][nb 2][11] | |||
| Asia | 18.8 | 374.9 | 1,543 | 2016 | ||
| Africa | 32.9 | 1073.7 | 16,211 | 2013 | ||
| Asia | 32.7 | 60.2 | 22,491 | 2016 | ||
| Asia | 16.6 | 295.8 | 188 | 2013 | ||
| Africa | 31.1 | 3653.4 | 2,123 | 2013 | ||
| Oceania | 7.6 | 98.1 | 8 | 2013 | ||
| North America | 14.1 | 58.9 | 189 | 2013 | ||
| Africa | 24.4 | 154.4 | 2,679 | 2013 | ||
| Europe | 12.3 | 46.4 | 9,782 | 2016 | ||
| Asia | 17.4 | 107.8[nb 4] | 914 | 2016 | ||
| Africa | 27.4 | 836.8 | 10,280 | 2013 | ||
| Europe | 13.7 | 42.2 | 6,089 | 2016 | ||
| Asia | 18.1 | 62.7 | 1,678 | 2013 | ||
| Europe | 2.9 | 5.7 | 3.4 | 2,026 | 2019[9] | |
| North America | 12.4 | 14.2 | 7.3 | 39,888 | 2018 | |
| South America | 13.4 | 19.6 | 460 | 2016 | ||
| Asia | 11.5 | 3,617 | 2016 | |||
| Oceania | 16.6 | 300 | 42 | 2013 | ||
| Asia | 24.5 | 55 | 22,419 | 2013 | ||
| Asia | 21.5 | 436.6 | 5,248 | 2013 | ||
| Africa | 24.7 | 670.9 | 3,586 | 2013 | ||
| Africa | 28.2 | 429.8 | 3,985 | 2013 |
See also
- Epidemiology of motor vehicle collisions
- Traffic collision
- Road traffic safety
- Smeed's law
- List of countries by vehicles per capita
Nations:
- List of motor vehicle deaths in Australia by year
- Road toll (Australia and New Zealand)
- List of motor vehicle deaths in Iceland by year
- List of motor vehicle deaths in Japan by year
- List of road traffic accidents deaths in Republic of Ireland by year
- Motor vehicle fatality rate in U.S. by year
- Road safety in Europe
General:
Notes
- The following groupings/assumptions were made:
- France includes the overseas departments as well as overseas collectivities.
- The United Kingdom includes the Crown dependencies as well as the overseas territories.
- The United States of America includes the insular areas.
- The Netherlands includes Aruba and the Netherlands Antilles.
- Denmark includes Greenland and the Faroe islands.
- China includes the SARs of Hong Kong and Macao.
- Not included in WHO 2018 report
- Non-harmonized figures!
- Figures from 2013.
References
- Data from World Health Organization Estimated Deaths 2015
- WHO, ed. (2018). Global Status Report on Road Safety 2018 (PDF) (official report). Geneva: World Health Organization (WHO). pp. xiv–xv, 1–13, 91ff (countries), 302–313 (table A2), 392–397 (table A11). ISBN 978-92-4-156568-4. Retrieved 5 May 2019.
Tables A2 & A11, data from 2016
- WHO, ed. (2015). Global Status Report on Road Safety 2015 (PDF) (official report). Geneva: World Health Organization (WHO). pp. vii, 1–14, 75ff (countries), 264–271 (table A2), 316–332 (table A10). ISBN 978-92-4-156506-6. Retrieved 27 January 2016.
Tables A2 & A10, data from 2013
- WHO, ed. (2013). Global Status Report on Road Safety 2013: supporting a decade of action (PDF) (official report). Geneva, Switzerland: World Health Organization (WHO). pp. vii, 1–8, 53ff (countries), 244–251 (table A2), 296–303 (table A10). ISBN 978-92-4-156456-4. Retrieved 30 May 2014.
Tables A2 & A10, data from 2010
- WHO, ed. (2015). "WHO Report 2015: Data tables" (PDF) (official report). Geneva: World Health Organization (WHO). Retrieved 26 January 2016.
- OECD/ITF, ed. (18 May 2018). Road Safety Annual Report 2018 (PDF) (official report). Paris: International Transport Forum (itf). p. 21. Retrieved 18 December 2018.
data from 2016
- WHO, ed. (2015). "Deaths on the roads: Based on the WHO Global Status Report on Road Safety 2015" (PDF) (official report). Geneva, Switzerland: World Health Organization (WHO). Retrieved 26 January 2016.
- "Bahrain traffic fatalities lowest in GCC". Ministry of Interior, Bahrein. 11 March 2018. Retrieved 8 May 2019.
- "Road deaths in the European Union – latest data | ETSC". etsc.eu. Retrieved 21 June 2020.
- http://www.index.go.kr/potal/main/EachDtlPageDetail.do?idx_cd=1614
- https://www.npa.gov.tw/NPAGip/wSite/public/Data/f1583122337347.csv
External links
- Annual Accident Report 2018 ( including deaths for all EU countries 2007-2016), European Road Safety Observatory.