List of the busiest airports in the United States
These are lists of the busiest airports in the United States, based on various ranking criteria.
Busiest U.S. airports by total passenger boardings
The FAA uses passenger boarding for a full calendar year to determine Airport Improvement Program (AIP) entitlements.[1] The term hub is used by the FAA to identify very busy commercial service airports. Large hubs are the airports that each account for at least one percent of total U.S. passenger enplanements. Medium hubs are defined as airports that each account for between 0.25 percent and one percent of the total passenger enplanements.
The 30 large hubs move 70% of the passengers with a traffic increasing by 2.5% from 2016 to 2017, while the 31 medium hubs grew by 5.2% and sixteen airports lost airline services between 2014 and 2018, from 445 to 429. Mainline carriers are up-gauging their fleet while scope clauses regional aircraft operations and turboprops and 50-seat regional jets are abandoned: aircraft with 50 seats or fewer represented 30% of domestic departures and 12% of seats offered in 2014, falling to 19% in 2018 and 7% of seats. Accounting for 18% of passenger traffic, medium hubs stimulate point-to-point services like for Southwest Airlines, operating at 29, carrying most mainline passengers at 24 and more than half at 10.[2]
1–30
| Rank (2019) | Airports (large hubs) | IATA Code | Major city served | State | 2019[3] | 2018[4] | 2017[5] | 2016[6] | 2015[7] | 2014[8] | 2013[9] | 2012[10] | 2011[11] | 2010[12] | 2009[13] |
|---|---|---|---|---|---|---|---|---|---|---|---|---|---|---|---|
| 1 | Hartsfield–Jackson Atlanta International Airport | ATL | Atlanta | GA | 53,505,795 | 51,866,464 | 50,251,964 | 50,501,858 | 49,340,732 | 46,604,273 | 45,308,407 | 45,798,809 | 44,414,121 | 43,130,585 | 42,280,868 |
| 2 | Los Angeles International Airport | LAX | Los Angeles | CA | 42,939,104 | 42,626,783 | 41,232,432 | 39,636,042 | 36,351,226 | 34,314,197 | 32,425,892 | 31,326,268 | 30,528,737 | 28,857,755 | 27,439,897 |
| 3 | O'Hare International Airport | ORD | Chicago | IL | 40,871,223 | 39,874,879 | 38,593,028 | 37,589,899 | 36,305,668 | 33,686,811 | 32,317,835 | 32,171,743 | 31,892,301 | 32,171,831 | 31,135,732 |
| 4 | Dallas/Fort Worth International Airport | DFW | Dallas | TX | 35,778,573 | 32,800,721 | 31,816,933 | 31,283,579 | 31,589,832 | 30,766,940 | 29,038,128 | 28,022,877 | 27,518,358 | 27,100,656 | 26,663,984 |
| 5 | Denver International Airport | DEN | Denver | CO | 33,592,945 | 31,363,573 | 29,809,097 | 28,267,394 | 26,280,043 | 26,000,591 | 25,496,885 | 25,799,832 | 25,667,499 | 25,241,962 | 24,013,669 |
| 6 | John F. Kennedy International Airport | JFK | New York | NY | 31,036,655 | 30,541,459 | 29,533,154 | 29,239,151 | 27,782,369 | 26,244,928 | 25,036,358 | 24,520,943 | 23,664,830 | 22,934,047 | 22,710,272 |
| 7 | San Francisco International Airport | SFO | San Francisco | CA | 27,779,230 | 27,794,154 | 26,900,048 | 25,707,101 | 24,190,549 | 22,756,008 | 21,704,626 | 21,284,224 | 20,038,679 | 19,359,003 | 18,467,908 |
| 8 | Seattle–Tacoma International Airport | SEA | Seattle | WA | 25,001,762 | 24,894,338 | 22,639,124 | 21,887,110 | 21,231,781 | 18,781,489 | 17,450,425 | 16,625,787 | 16,425,732 | 15,406,243 | 15,273,092 |
| 9 | McCarran International Airport | LAS | Las Vegas | NV | 24,728,361 | 23,655,285 | 23,364,393 | 22,833,267 | 21,824,231 | 20,551,016 | 19,946,179 | 19,941,173 | 19,854,759 | 18,996,738 | 19,445,952 |
| 10 | Orlando International Airport | MCO | Orlando | FL | 24,562,271 | 23,184,634 | 21,565,448 | 20,283,541 | 18,759,938 | 17,278,608 | 16,884,524 | 17,159,425 | 17,250,415 | 17,017,491 | 16,371,016 |
| 11 | Charlotte Douglas International Airport | CLT | Charlotte | NC | 24,199,688 | 22,283,574 | 22,011,251 | 21,511,880 | 21,913,166 | 21,542,277 | 21,346,601 | 20,032,426 | 19,022,535 | 18,629,181 | 18,165,476 |
| 12 | Newark Liberty International Airport | EWR | Newark | NJ | 23,160,763 | 22,798,354 | 21,571,198 | 19,923,009 | 18,684,818 | 17,680,826 | 17,546,506 | 17,035,098 | 16,814,092 | 16,571,754 | 16,659,441 |
| 13 | Phoenix Sky Harbor International Airport | PHX | Phoenix | AZ | 22,433,552 | 21,623,842 | 21,185,458 | 20,896,265 | 21,351,445 | 20,344,867 | 19,525,109 | 19,556,189 | 19,750,306 | 18,907,171 | 18,559,647 |
| 14 | George Bush Intercontinental Airport | IAH | Houston | TX | 21,905,309 | 21,157,948 | 19,603,731 | 20,062,072 | 20,595,874 | 19,772,054 | 18,952,840 | 19,038,958 | 19,306,660 | 19,528,631 | 19,290,239 |
| 15 | Miami International Airport | MIA | Miami | FL | 21,421,031 | 21,025,210 | 20,709,225 | 20,875,813 | 20,986,341 | 19,468,523 | 19,420,089 | 18,987,488 | 18,342,158 | 17,017,654 | 16,187,768 |
| 16 | General Edward Lawrence Logan International Airport | BOS | Boston | MA | 20,699,377 | 20,010,262 | 18,759,742 | 17,749,202 | 16,290,362 | 15,425,869 | 14,810,153 | 14,293,675 | 14,171,476 | 13,561,814 | 12,566,797 |
| 17 | Minneapolis–Saint Paul International Airport | MSP | Minneapolis | MN | 19,192,917 | 18,363,493 | 18,409,704 | 18,123,844 | 17,634,252 | 16,972,678 | 16,280,835 | 15,943,751 | 15,895,653 | 15,512,487 | 15,551,206 |
| 18 | Detroit Metropolitan Airport | DTW | Detroit | MI | 18,143,040 | 17,437,716 | 17,036,092 | 16,826,287 | 16,255,520 | 15,775,941 | 15,683,523 | 15,599,877 | 15,716,865 | 15,643,890 | 15,211,402 |
| 19 | Fort Lauderdale–Hollywood International Airport | FLL | Fort Lauderdale | FL | 17,950,989 | 17,613,957 | 15,817,043 | 14,263,270 | 13,061,607 | 11,987,607 | 11,538,140 | 11,445,101 | 11,332,466 | 10,829,810 | 10,258,118 |
| 20 | Philadelphia International Airport | PHL | Philadelphia | PA | 16,006,389 | 15,285,948 | 14,271,243 | 14,564,419 | 15,101,318 | 14,747,112 | 14,727,945 | 14,587,631 | 14,883,180 | 14,951,254 | 15,002,961 |
| 21 | LaGuardia Airport | LGA | New York | NY | 15,393,601 | 15,059,648 | 14,614,802 | 14,706,123 | 14,762,593 | 13,415,797 | 13,372,269 | 12,818,717 | 11,989,227 | 12,001,501 | 11,084,300 |
| 22 | Baltimore/Washington International Airport | BWI | Baltimore | MD | 13,284,687 | 13,373,773 | 12,976,554 | 12,340,972 | 11,738,828 | 11,022,200 | 11,132,731 | 11,183,965 | 11,067,317 | 10,848,633 | 10,338,950 |
| 23 | Salt Lake City International Airport | SLC | Salt Lake City | UT | 12,840,841 | 12,228,677 | 11,615,954 | 11,143,738 | 10,634,519 | 10,139,065 | 9,668,048 | 9,579,836 | 9,701,756 | 9,910,493 | 9,903,821 |
| 24 | San Diego International Airport | SAN | San Diego | CA | 12,648,692 | 12,176,303 | 11,139,933 | 10,340,164 | 9,985,739 | 9,333,152 | 8,878,772 | 8,686,592 | 8,465,683 | 8,430,509 | 8,453,854 |
| 25 | Washington Dulles International Airport | IAD | Washington, D.C. | VA | 11,884,117 | 11,628,309 | 11,024,306 | 10,596,942 | 10,363,918 | 10,415,948 | 10,570,993 | 10,785,683 | 11,043,829 | 11,276,481 | 11,132,098 |
| 26 | Ronald Reagan Washington National Airport | DCA | Washington, D.C. | VA | 11,595,454 | 11,367,176 | 11,506,310 | 11,470,854 | 11,242,375 | 10,057,794 | 9,838,034 | 9,462,206 | 9,053,004 | 8,736,804 | 8,490,288 |
| 27 | Tampa International Airport | TPA | Tampa | FL | 10,978,756 | 10,369,622 | 9,548,580 | 9,194,994 | 9,150,414 | 8,531,561 | 8,267,752 | 8,216,153 | 8,174,194 | 8,137,222 | 8,263,294 |
| 28 | Chicago Midway International Airport | MDW | Chicago | IL | 10,081,781 | 10,685,565 | 10,912,074 | 11,044,353 | 11,044,387 | 10,318,311 | 9,915,646 | 9,431,796 | 9,134,576 | 8,518,957 | 8,253,620 |
| 29 | Daniel K. Inouye International Airport | HNL | Honolulu | HI | 9,988,678 | 9,578,505 | 9,743,989 | 9,656,340 | 9,656,340 | 9,463,000 | 9,466,995 | 9,210,270 | 8,643,494 | 8,740,077 | 8,739,389 |
| 30 | Portland International Airport | PDX | Portland | OR | 9,797,408 | 9,940,866 | 9,435,473 | 9,071,154 | 8,340,234 | 7,878,760 | 7,452,603 | 7,142,620 | 6,808,486 | 6,582,227 | 6,430,119 |
31–61
| Rank (2018) | Airports (medium hubs) | IATA Code | City served | State | 2019 | 2018 | 2017 | 2016 | 2015[6] | 2014[1] |
|---|---|---|---|---|---|---|---|---|---|---|
| 31 | Nashville International Airport | BNA | Nashville | TN | 9,132,344 | 8,007,049 | 7,015,119 | 6,338,517 | 5,708,852 | 5,396,958[14] |
| 32 | Austin–Bergstrom International Airport | AUS | Austin | TX | 8,683,711 | 7,921,797 | 6,973,115 | 6,095,545 | 5,797,547 | 5,219,982 |
| 33 | Dallas Love Field | DAL | Dallas | TX | 8,408,457 | 8,134,848 | 7,876,769 | 7,554,596 | 7,040,921 | 4,522,341 |
| 34 | St. Louis Lambert International Airport | STL | St. Louis | MO | 7,946,986 | 7,822,274 | 7,372,805 | 6,793,076 | 6,239,231 | 6,108,758 |
| 35 | Norman Y. Mineta San José International Airport | SJC | San Jose | CA | 7,828,885 | 7,140,616 | 6,225,148 | 5,321,603 | 4,885,690 | 4,621,003 |
| 36 | William P. Hobby Airport | HOU | Houston | TX | 7,069,614 | 6,937,061 | 6,741,870 | 6,285,181 | 5,937,944 | 5,800,726 |
| 37 | Raleigh-Durham International Airport | RDU | Raleigh | NC | 6,919,429 | 6,416,822 | 5,851,004 | 5,401,714 | 4,954,717 | 4,673,869 |
| 38 | Louis Armstrong New Orleans International Airport | MSY | New Orleans | LA | 6,717,105 | 6,565,482 | 6,005,527 | 5,569,705 | 5,329,696 | 4,870,569 |
| 39 | Oakland International Airport | OAK | Oakland | CA | 6,560,230 | 6,798,321 | 6,530,308 | 5,934,639 | 5,506,672 | 5,069,257 |
| 40 | Sacramento International Airport | SMF | Sacramento | CA | 6,454,413 | 6,031,630 | 5,460,526 | 4,969,366 | 4,816,440 | 4,384,616 |
| 41 | Kansas City International Airport | MCI | Kansas City | MO | 5,759,419 | 5,935,131 | 5,744,918 | 5,391,557 | 5,135,127 | 4,982,722 |
| 42 | John Wayne Airport | SNA | Orange County | CA | 5,153,276 | 5,317,149 | 5,195,047 | 5,217,242 | 4,945,175 | 4,584,147 |
| 43 | Southwest Florida International Airport[15] | RSW | Fort Myers | FL | 5,144,467 | 4,719,568 | 4,461,304 | 4,350,650 | 4,231,134 | 4,025,959 |
| 44 | San Antonio International Airport | SAT | San Antonio | TX | 5,022,980 | 4,844,427 | 4,521,611 | 4,179,994 | 4,091,389 | 4,046,856 |
| 45 | Cleveland Hopkins International Airport | CLE | Cleveland | OH | 4,894,541 | 4,836,580 | 4,562,740 | 4,205,739 | 4,083,476 | 3,686,315 |
| 46 | Pittsburgh International Airport | PIT | Pittsburgh | PA | 4,715,947 | 4,670,033 | 4,327,431 | 3,986,114 | 3,890,677 | 3,827,860 |
| 47 | Indianapolis International Airport | IND | Indianapolis | IN | 4,709,183 | 4,695,040 | 4,376,432 | 4,216,766 | 3,889,567 | 3,605,908 |
| 48 | Luis Muñoz Marín International Airport | SJU | San Juan | PR | 4,590,117 | 4,033,412 | 4,163,587 | 4,343,354 | 4,218,785 | 4,150,828 |
| 49 | Cincinnati/Northern Kentucky International Airport | CVG | Cincinnati | OH/KY | 4,413,457 | 4,269,258 | 3,926,158 | 3,269,979 | 3,036,697 | 2,874,684 |
| 50 | John Glenn Columbus International Airport | CMH | Columbus | OH | 4,172,067 | 4,054,572 | 3,765,007 | 3,567,864 | 3,312,496 | 3,115,501 |
| 51 | Kahului Airport | OGG | Kahului | HI | 3,791,807 | 3,572,133 | 3,442,189 | 3,352,813 | 3,220,753 | 3,019,338 |
| 52 | Jacksonville International Airport | JAX | Jacksonville | FL | 3,479,923 | 3,118,540 | 2,759,067 | 2,799,587 | 2,716,465 | 2,589,198 |
| 53 | Palm Beach International Airport | PBI | West Palm Beach | FL | 3,460,429 | 3,263,042 | 3,166,532 | 3,100,624 | 3,113,485 | 2,926,242 |
| 54 | Milwaukee Mitchell International Airport | MKE | Milwaukee | WI | 3,374,073 | 3,548,817 | 3,452,544 | 3,383,271 | 3,229,876 | 3,228,607 |
| 55 | Bradley International Airport | BDL | Hartford | CT | 3,323,614 | 3,330,734 | 3,214,976 | 2,982,194 | 2,926,047 | 2,913,380 |
| 56 | Hollywood Burbank Airport | BUR | Burbank | CA | 2,988,720 | 2,681,598 | 2,365,361 | 2,104,625 | 1,972,531 | 1,931,948 |
| 57 | Ontario International Airport | ONT | Ontario | CA | 2,723,002 | 2,499,171 | 2,247,645 | 2,127,387 | 2,089,801 | 2,037,346 |
| 58 | Ted Stevens Anchorage International Airport | ANC | Anchorage | AK | 2,713,843 | 2,642,901 | 2,556,188 | 2,563,524 | 2,525,876 | 2,381,826 |
| 59 | Albuquerque International Sunport | ABQ | Albuquerque | NM | 2,641,450 | 2,647,567 | 2,483,861 | 2,341,719 | 2,323,850 | 2,354,184 |
| 60 | Buffalo Niagara International Airport | BUF | Buffalo | NY | 2,459,199 | 2,523,630 | 2,348,463 | 2,313,724 | 2,331,545 | 2,378,469 |
| 61 | Eppley Airfield | OMA | Omaha | NE | 2,455,274 | 2,457,087 | 2,303,223 | 2,127,387 | 2,046,155 | 2,020,354 |
Busiest U.S. airports by total passenger traffic (2019)
List of busiest airports in the U.S. based on total passengers, data are based on numbers provided from annual or monthly published figures by own airport authorities.
| Location of 35 busiest airports in the United States |
|---|
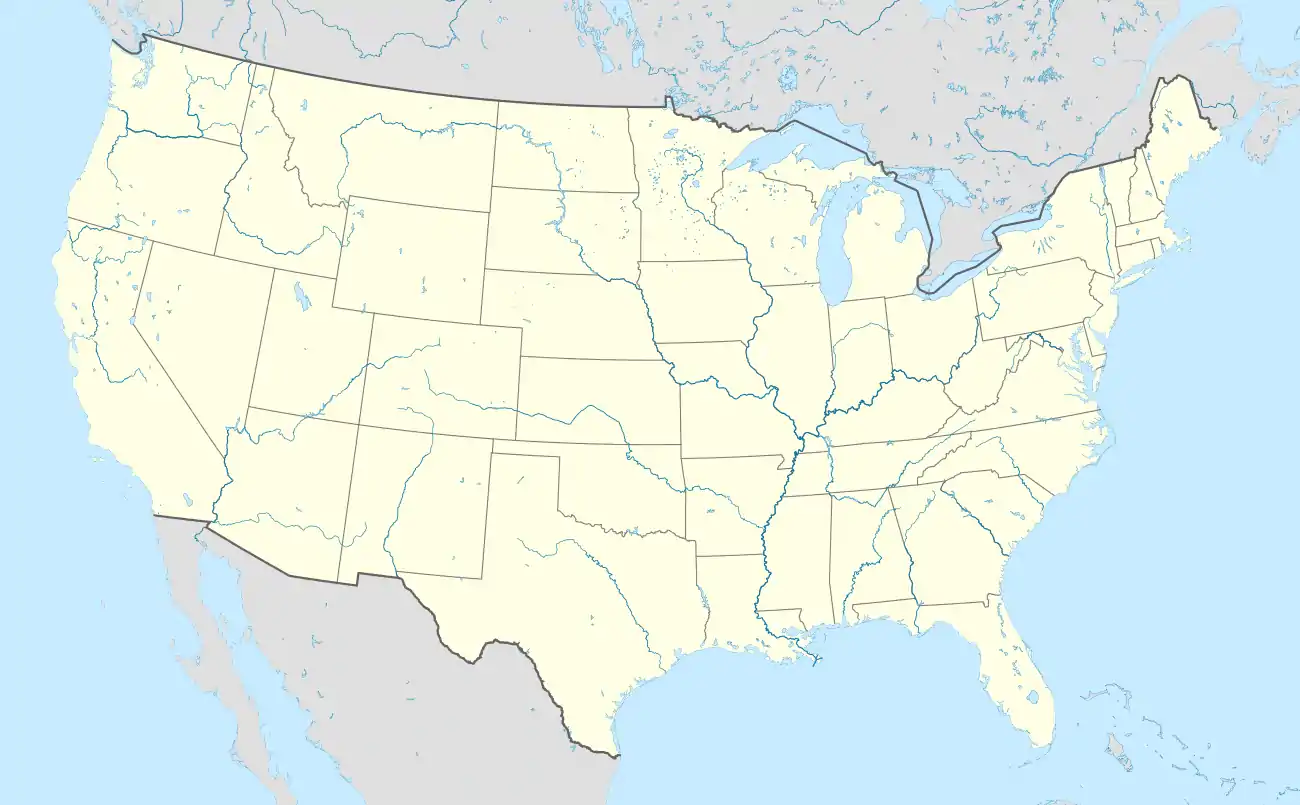 New York–JFK Busiest airports in the United States |
Busiest U.S. airports by total passenger traffic (2018)
List of busiest airports in the U.S. based on total passengers, data are based on numbers provided from annual or monthly published figures by own airport authorities.
36 busiest U.S. airports by total passenger traffic (2016)
Listed according to data compiled by Airports Council International North America, and ranked according to total passengers during 2016.
All 36 airports on this list are also featured on the FAA list, but the order varies. The FAA ranks by passengers boarding. ACI ranks by sum of boarding, disembarking, and flying through without leaving airplane. The statistics are slightly more than twice as high.
25 busiest U.S. airports by international passenger traffic (2018)
Listed according to data compiled by the Office of Aviation Analysis, part of the United States Department of Transportation, and ranked according to total international passengers during 2018.[70]
10 busiest airports in the U.S. by total cargo throughput (2017)
Listed according to data compiled by the Federal Aviation Administration for the United States and ranked according to total cargo throughput in pounds during 2017.[71]
| Rank | Airport name | Location | IATA code |
Cargo | |
|---|---|---|---|---|---|
| Ibs. | % chg. 2017/16 | ||||
| 1 | Memphis International Airport | Memphis, Tennessee | MEM | 23,949,525,780 | |
| 2 | Ted Stevens Anchorage International Airport | Anchorage, Alaska | ANC | 17,337,337,377 | |
| 3 | Louisville International Airport | Louisville, Kentucky | SDF | 13,403,682,652 | |
| 4 | O'Hare International Airport | Chicago, Illinois | ORD | 10,373,559,593 | |
| 5 | Miami International Airport | Miami, Florida | MIA | 7,963,988,407 | |
| 6 | Los Angeles International Airport | Los Angeles, California | LAX | 7,197,930,264 | |
| 7 | Cincinnati/Northern Kentucky International Airport | Hebron, Kentucky | CVG | 5,700,282,994 | |
| 8 | Indianapolis International Airport | Indianapolis, Indiana | IND | 5,138,500,318 | |
| 9 | Dallas/Fort Worth International Airport | Irving, Texas | DFW | 4,155,362,297 | |
| 10 | Ontario International Airport | Ontario, California | ONT | 3,522,510,318 | |
References
- "Statistics" (PDF). Faa.gov. 2014.
- Sean Broderick (Jul 23, 2018). "Mature U.S. Market Has Room For Upstarts". Aviation Week & Space Technology.
- "CY 2019 Commercial Service Enplanements Data" (PDF). Faa.gov. Retrieved 2021-01-24.
- "Preliminary CY 2018 Commercial Service Enplanements" (PDF). Faa.gov. Retrieved 2019-08-16.
- "Preliminary CY 2017 Commercial Service Enplanements Data" (PDF). Faa.gov. Retrieved 2018-08-06.
- "Commercial Service Airports (Rank Order) 10/5/2017 : based on Calendar Year 2016 Enplanements" (PDF). Faa.gov. Retrieved 5 February 2019.
- "Calendar Year 2015 Revenue Enplanements at Commercial Service Airports". Federal Aviation Administration. Retrieved July 5, 2015.
- "CY 2014 Primary Airports -- Preliminary Data" (PDF). Faa.gov. Retrieved 5 February 2019.
- "CY 2013 Primary Airports" (PDF). Faa.gov. Retrieved 5 February 2019.
- "CY 2012 Primary Airports" (PDF). Faa.gov. Retrieved 5 February 2019.
- "CY 2011 Primary Airports" (PDF). Faa.gov. Retrieved 5 February 2019.
- CY 2010 Enplanements at Primary Airports Archived 2015-02-02 at the Wayback Machine
- "Passenger Boarding (Enplanement) and All-Cargo Data for U.S. Airports – Airports". Faa.gov.
- BNA Website
- "Southwest Florida International Airport Enplanements Statistics" (PDF). Retrieved April 27, 2020.
- "Calendar YTD January to December" (PDF). Retrieved January 31, 2020.
- "Summary Statistics for 2019". Retrieved March 7, 2020.
- "Traffic Statistics". Retrieved January 31, 2020.
- "2019 Statistics" (PDF). Retrieved January 31, 2020.
- "Summary Statistics for 2019". Retrieved March 7, 2020.
- "Monthly Statistical Report December 2019" (PDF). Retrieved January 31, 2020.
- "Houston Airport System December 2019". Retrieved January 31, 2020.
- "Monthly Airport Traffic Summary - December 2019 (Year starting on January)" (PDF). Massport. Retrieved 2020-02-03.
- "Year End Operation Report 2019". Retrieved January 31, 2020.
- "Aviation Statistics December 2019" (PDF). Retrieved February 14, 2020.
- "Traffic recap December 2019" (PDF). Retrieved January 31, 2020.
- "Summary Statistics for 2019". Retrieved March 7, 2020.
- "Summary Statistics for 2019" (PDF). Retrieved January 31, 2020.
- "Air Traffic Report Summary" (PDF). Retrieved March 7, 2020.
- "Twelve-Month Passenger Market Share" (PDF). Retrieved January 31, 2020.
- "Monthly Traffic Report December 2019" (PDF). Retrieved March 7, 2020.
- "Total Passengers" (PDF). Retrieved January 31, 2020.
- "Total Passengers". Retrieved January 31, 2020.
- "CY2019 Passenger & Operation Statistics" (PDF). Retrieved January 31, 2020.
- "Activity Report" (PDF). Retrieved January 31, 2020.
- "Airport Traffic Report Dec-18" (PDF). Retrieved February 20, 2019.
- "Calendar YTD January to December" (PDF). Retrieved February 20, 2019.
- "Calendar YTD operations December 18" (PDF). Retrieved April 17, 2019.
- "DFW Total Passengers" (PDF). Retrieved February 20, 2019.
- "Operations and Traffic December 2018" (PDF). Retrieved February 20, 2019.
- "December 2018 Traffic Report" (PDF). Retrieved February 20, 2019.
- "Comparative Traffic Report Dec 2018" (PDF). Retrieved February 20, 2019.
- "Traffic Statistics". Retrieved February 20, 2019.
- "2018 Statistics" (PDF). Retrieved February 20, 2019.
- "Calendar Year End 2017 vs 2018". Retrieved February 20, 2019.
- "CLT Breaks All-Time High Passenger Record". www.cltairport.com. Archived from the original on 2019-03-31. Retrieved 2019-02-21.
- "December 2018 Traffic Report" (PDF). Retrieved February 20, 2019.
- "Traffic Report" (PDF). Retrieved February 20, 2019.
- "Monthly Statistical Report December 2018" (PDF). Retrieved February 20, 2019.
- "Houston Airport System December 2018" (PDF). Retrieved February 20, 2019.
- "Monthly Airport Traffic Summary" (PDF). Retrieved February 20, 2019.
- "Year End Operation Report". Retrieved February 20, 2019.
- "Monthly Stats" (PDF). Retrieved February 20, 2019.
- "December Calendar Year Monthly Summary" (PDF). Retrieved February 20, 2019.
- "Aviation Activity Report". Retrieved February 20, 2019.
- "December 2018 Traffic Report" (PDF). Retrieved February 20, 2019.
- "Monthly Statistical Report Summary" (PDF). Retrieved February 20, 2019.
- "Summary Statistics for 2018" (PDF). Retrieved February 20, 2019.
- "Traffic Report Summary December 2018". Retrieved March 1, 2019.
- "Monthly Operations December 2018" (PDF). Retrieved April 17, 2019.
- "Monthly Operations December 2018" (PDF). Retrieved April 17, 2019.
- "Monthly Operations December 2018" (PDF). Retrieved April 17, 2019.
- "Monthly Activity Report". Retrieved March 1, 2019.
- "Calendar Year Report 2018" (PDF). Retrieved March 1, 2019.
- "Traffic Statistics". Archived from the original on May 12, 2018. Retrieved March 1, 2019.
- "Airport Data". Retrieved March 1, 2019.
- "Aviation Activity Report 2018" (PDF). Retrieved March 1, 2019.
- "CY2018 Passenger & Operation Statistics" (PDF). Retrieved March 1, 2019.
- "Activity Report" (PDF). Retrieved May 14, 2019.
- U.S. International Air Passenger and Freight Statistics, December 2018 (PDF) (Report). International Aviation Developments Series. U.S. Department of Transportation. December 1, 2018. Retrieved August 18, 2019.
- "U.S. Airports" (PDF). Federal Aviation Administration. Retrieved 4 January 2018.
External links
United States Department of Transportation:
- "Top 20 U.S. Gateways for Nonstop International Air Travel: 2008 and 2009". Bureau of Transportation Statistics.
- "Top 20 U.S. Gateways for Nonstop International Air Travel: 2005 and 2006". Bureau of Transportation Statistics.
- "Top 20 U.S. Gateways for Nonstop International Air Travel: 1990, 1995, and 2000". Bureau of Transportation Statistics.
- "Top 20 Routes for U.S. International Airport Pair Passengers: 1990, 1995, and 2000". Bureau of Transportation Statistics.
- Federal Aviation Administration (FAA): National Plan of Integrated Airport Systems (NPIAS) 2005-2009
- FAA National Flight Data Center (NFDC): Airport Data (Form 5010), also available from AirportIQ 5010