Najac
Najac is a commune in the Aveyron department in southern France.
Najac | |
|---|---|
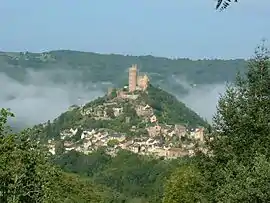 A general view of Najac | |
.svg.png.webp) Coat of arms | |
Location of Najac 
| |
 Najac  Najac | |
| Coordinates: 44°13′11″N 1°58′43″E | |
| Country | France |
| Region | Occitanie |
| Department | Aveyron |
| Arrondissement | Villefranche-de-Rouergue |
| Canton | Aveyron et Tarn |
| Government | |
| • Mayor (2008–2014) | Raymond Rébellac |
| Area 1 | 53.88 km2 (20.80 sq mi) |
| Population (2017-01-01)[1] | 698 |
| • Density | 13/km2 (34/sq mi) |
| Time zone | UTC+01:00 (CET) |
| • Summer (DST) | UTC+02:00 (CEST) |
| INSEE/Postal code | 12167 /12270 |
| Elevation | 198–500 m (650–1,640 ft) (avg. 300 m or 980 ft) |
| 1 French Land Register data, which excludes lakes, ponds, glaciers > 1 km2 (0.386 sq mi or 247 acres) and river estuaries. | |

Najac village is set along a ridge above a bend in the Aveyron River. In the earlier part of the last century the village had around 2000 people but it suffered marked population decline as workers migrated to towns and cities. Several films concern the village and its surrounds, for example, La Vie Comme Elle Va.
The village economy, once famous for ham, is based largely on tourism and agriculture. Most land in the commune is still used for farming and there are a significant number of long-term inhabitants. During the summer, the population increases significantly due to second home owners and holiday-makers. Most holiday home owners are British, Canadian, Dutch or from the north of France.
The village is known for historic buildings and apparent medieval character. A partly ruined château dominates; it was built by villagers in 1253 on the orders of Alphonse de Poitiers. The 13th century Eglise Saint-Jean, built by villagers as a punishment for Cathar beliefs, overlooks the lower village, while at the other end, the faubourg has the typical architecture of many bastide villages with timber-framed houses and commercial arcades around an open area.
Najac is also one of the 140 or so Plus Beaux Villages de France (most beautiful villages of France), which in addition to ensuring its tourism status, brings money to maintain the village.
Population
| Year | Pop. | ±% |
|---|---|---|
| 1793 | 2,029 | — |
| 1800 | 2,181 | +7.5% |
| 1806 | 2,157 | −1.1% |
| 1821 | 2,251 | +4.4% |
| 1831 | 2,417 | +7.4% |
| 1836 | 2,201 | −8.9% |
| 1841 | 2,070 | −6.0% |
| 1846 | 2,130 | +2.9% |
| 1851 | 2,189 | +2.8% |
| 1856 | 2,388 | +9.1% |
| 1861 | 2,406 | +0.8% |
| 1866 | 2,415 | +0.4% |
| 1872 | 2,455 | +1.7% |
| 1876 | 2,266 | −7.7% |
| 1881 | 2,040 | −10.0% |
| 1886 | 2,029 | −0.5% |
| 1891 | 1,870 | −7.8% |
| 1896 | 1,771 | −5.3% |
| 1901 | 1,660 | −6.3% |
| 1906 | 1,623 | −2.2% |
| 1911 | 1,515 | −6.7% |
| 1921 | 1,246 | −17.8% |
| 1926 | 1,207 | −3.1% |
| 1931 | 1,138 | −5.7% |
| 1936 | 1,098 | −3.5% |
| 1946 | 996 | −9.3% |
| 1954 | 825 | −17.2% |
| 1962 | 767 | −7.0% |
| 1968 | 1,029 | +34.2% |
| 1975 | 928 | −9.8% |
| 1982 | 818 | −11.9% |
| 1990 | 766 | −6.4% |
| 1999 | 744 | −2.9% |
| 2008 | 752 | +1.1% |
References
- "Populations légales 2017". INSEE. Retrieved 6 January 2020.
External links
| Wikimedia Commons has media related to Najac. |
| Authority control |
|---|