Opinion polling for the 1983 United Kingdom general election
In the run-up to the 1983 United Kingdom general election, various organisations carried out opinion polling to gauge voting intention. Results of such polls are displayed in this article. The date ranges for these opinion polls are from the 1979 general election until 6 June 1983.
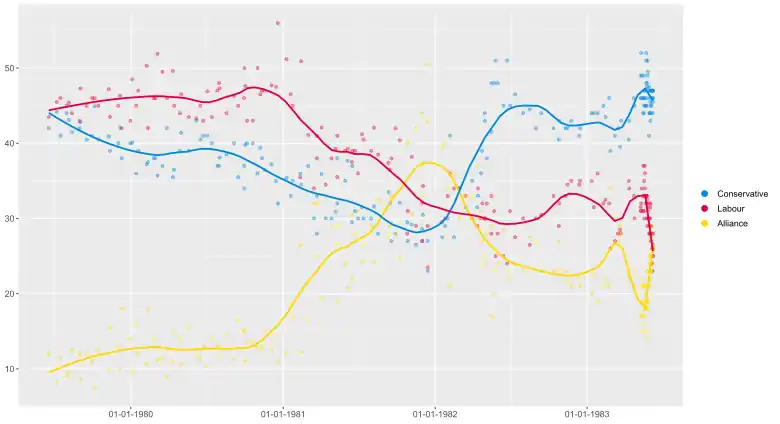
Conservative Labour SDP–Liberal Alliance
| Opinion polling for UK general elections |
|---|
| October 1974 election |
| Opinion polls |
| 1979 election |
| Opinion polls |
| 1983 election |
| Opinion polls |
| 1987 election |
| Opinion polls |
| 1992 election |
| Opinion polls |
Polling results
All data is from UK Polling Report.[1]
1983
| Survey End Date | Polling Organisation/Client | Con | Lab | All | Lead |
|---|---|---|---|---|---|
| 9 June | General election results | 42.4% | 27.6% | 25.4% | 14.8% |
| 8 Jun | Harris/Observer | 47% | 26% | 25% | 21% |
| 8 Jun | Gallup/Telegraph | 47% | 25% | 26% | 21% |
| 8 Jun | Marplan/Guardian | 45.5% | 26.5% | 26% | 19% |
| 8 Jun | NOP/Northcliffe | 46% | 26% | 26% | 20% |
| 8 Jun | MORI/Evening Standard | 47% | 25% | 26% | 21% |
| 8 Jun | NOP/Daily Mail | 44% | 28% | 26% | 16% |
| 7 Jun | Audience Selection/Sun | 46% | 28% | 24% | 18% |
| 7 Jun | Marplan/Guardian | 46% | 23% | 29% | 17% |
| 6 Jun | Audience Selection/Sun | 47% | 26% | 25% | 21% |
| 5 Jun | Harris/Observer | 45% | 24% | 28% | 17% |
| 3 Jun | Marplan/Sunday Mirror | 47% | 28% | 23% | 19% |
| 3 Jun | NOP/Mail on Sunday | 44% | 27% | 27.5% | 16.5% |
| 3 Jun | Gallup/Sunday Telegraph | 47% | 29% | 23% | 18% |
| 2 Jun | MORI/Sunday Times | 45.5% | 31.5% | 22% | 14% |
| 2 Jun | MORI/Express | 45% | 28% | 25% | 17% |
| 2 Jun | Marplan/Guardian | 43% | 32% | 23% | 11% |
| 1 Jun | Harris/TV-Eye | 47% | 30% | 22% | 17% |
| 1 Jun | MORI/Daily Star | 46% | 28% | 24% | 18% |
| 31 May | Audience Selection/Sun | 44% | 32% | 21% | 12% |
| 31 May | Gallup/Telegraph | 44% | 29% | 25% | 15% |
| 30 May | Audience Selection/TV-AM | 47.5% | 28% | 23% | 19.5% |
| 30 May | Harris/Observer | 41% | 30% | 24% | 11% |
| 27 May | Marplan/Sunday Mirror | 47% | 30% | 21% | 17% |
| 27 May | Gallup/Telegraph | 49.5% | 31% | 19% | 18.5% |
| 26 May | MORI/Express | 49% | 31.5% | 18% | 17.5% |
| 26 May | Marplan/Guardian | 51% | 29% | 19% | 22% |
| 25 May | Harris/Thames | 47.5% | 32.5% | 19% | 15% |
| 25 May | MORI/Sunday Times | 48% | 33% | 18% | 15% |
| 25 May | Audience Selection/Sun | 46% | 30% | 23% | 16% |
| 24 May | Gallup/Telegraph | 45% | 32% | 21% | 13% |
| 23 May | Audience Selection/TV-AM | 48% | 33% | 18% | 15% |
| 23 May | MORI/Daily Star | 45% | 32% | 20% | 13% |
| 23 May | NOP/Daily Mail | 51% | 33% | 15% | 18% |
| 23 May | Harris/Observer | 52% | 33% | 14% | 19% |
| 20 May | Marplan/Sunday Mirror | 45% | 36% | 18% | 9% |
| 20 May | MORI/Express | 47% | 34% | 18% | 13% |
| 19 May | MORI/Sunday Times | 46% | 37% | 16% | 9% |
| 18 May | Harris/Thames | 47% | 30% | 21% | 17% |
| 18 May | NOP/Daily Mail | 45% | 35% | 17% | 10% |
| 17 May | Audience Selection/Sun | 49% | 31% | 19% | 18% |
| 17 May | Gallup/Telegraph | 44% | 33% | 21% | 11% |
| 16 May | MORI/Daily Star | 46% | 33% | 19% | 13% |
| 16 May | Audience Selection/TV-AM | 44% | 37% | 17% | 7% |
| 16 May | MORI/Express | 46% | 31% | 21% | 15% |
| 13 May | The Dissolution of the 48th Parliament and campaigning officially begins | ||||
| 12 May | MORI | 49% | 34% | 15% | 15% |
| 11 May | Harris/Thames | 46% | 32% | 22% | 14% |
| 11 May | MORI/Daily Star | 52% | 31% | 17% | 21% |
| 10 May | Gallup/Telegraph | 46% | 31% | 21% | 15% |
| 9 May | MORI | 49% | 31.5% | 17.5% | 17.5% |
| 25 Apr | MORI | 45% | 30% | 23% | 15% |
| 23 Apr | MORI | 46% | 33% | 21% | 13% |
| 12 Apr | Gallup/Telegraph | 43% | 34% | 22% | 9% |
| 11 Apr | MORI | 40.5% | 35% | 22.5% | 5.5% |
| 24 Mar | Darlington by-election | ||||
| 23 Mar | Gallup/Telegraph | 43% | 28% | 28% | 15% |
| 21 Mar | MORI | 39.5% | 28.5% | 29% | 10.5% |
| 16 Mar | MORI | 42% | 28% | 27% | 14% |
| 9 Mar | MORI | 41% | 27% | 30% | 11% |
| 26 Feb | MORI | 39% | 26% | 34% | 5% |
| 24 Feb | Bermondsey by-election | ||||
| 23 Feb | Gallup/Telegraph | 46% | 32% | 21% | 14% |
| 14 Feb | MORI | 43.5% | 32.5% | 22% | 11% |
| 9 Feb | MORI | 45% | 32% | 21% | 13% |
| 26 Jan | Gallup/Telegraph | 44% | 36% | 19% | 8% |
| 17 Jan | MORI | 44% | 31.5% | 22.5% | 12.5% |
| 12 Jan | MORI | 44% | 35% | 20% | 9% |
1982
| Survey End Date | Polling Organisation/Client | Con | Lab | All | Lead |
|---|---|---|---|---|---|
| 15 Dec | Gallup/Telegraph | 42% | 35% | 21% | 7% |
| 13 Dec | MORI | 41% | 34.5% | 22% | 6.5% |
| 2 Dec | Glasgow Queen's Park by-election | ||||
| 24 Nov | Gallup/Telegraph | 43% | 35% | 21% | 8% |
| 15 Nov | MORI | 42% | 34.5% | 21.5% | 7.5% |
| 10 Nov | MORI | 42% | 33% | 23% | 9% |
| 28 Oct | Birmingham Northfield and Peckham by-elections | ||||
| 26 Oct | Gallup/Telegraph | 43% | 32% | 23% | 11% |
| 25 Oct | MORI | 40.5% | 29% | 27% | 11.5% |
| 20 Oct | 1982 Northern Ireland Assembly election[2] | ||||
| 12 Oct | Gallup/Telegraph | 42% | 33% | 23% | 9% |
| 16 Sep | Gower by-election | ||||
| 13 Sep | MORI | 44% | 30.5% | 23% | 13.5% |
| 31 Aug | Gallup/Telegraph | 42% | 30% | 27% | 12% |
| 16 Aug | MORI | 44.5% | 26.5% | 27.5% | 17% |
| 31 Jul | Gallup/Telegraph | 44% | 30% | 23% | 14% |
| 12 Jul | MORI | 46.5% | 27.5% | 24% | 19% |
| 30 Jun | MORI | 45% | 31% | 22% | 14% |
| 24 Jun | Coatbridge and Airdrie by-election | ||||
| 23 Jun | Gallup/Telegraph | 51% | 24% | 23% | 27% |
| 14 Jun | MORI | 45% | 25% | 28.5% | 16.5% |
| 14 Jun | The Falklands War ends[3] | ||||
| 3 Jun | Mitcham and Morden by-election | ||||
| 31 May | MORI | 48% | 28% | 24% | 20% |
| 27 May | Beaconsfield by-election | ||||
| 26 May | MORI | 51% | 25% | 23% | 26% |
| 23 May | Gallup/Telegraph | 48% | 31% | 20% | 17% |
| 16 May | MORI | 41.5% | 28% | 29% | 12.5% |
| 16 May | MORI | 48% | 33% | 17% | 15% |
| 6 May | 1982 United Kingdom local elections | ||||
| 5 May | MORI | 38% | 32% | 28% | 6% |
| 30 Apr | MORI | 44% | 30% | 24% | 14% |
| 30 Apr | MORI | 43% | 30% | 25% | 13% |
| 24 Apr | MORI | 39% | 32% | 27% | 7% |
| 21 Apr | MORI | 36% | 30% | 31% | 5% |
| 14 Apr | Gallup/Telegraph | 33% | 34% | 30% | 1% |
| 12 Apr | MORI | 31.5% | 29% | 37% | 5.5% |
| 2 Apr | The Falklands War begins[4] | ||||
| 31 Mar | Gallup/Telegraph | 35% | 30% | 33% | 2% |
| 25 Mar | Glasgow Hillhead by-election | ||||
| 15 Mar | MORI | 31.5% | 33% | 33% | Tie |
| 4 Mar | Belfast South by-election | ||||
| 28 Feb | Gallup/Telegraph | 34% | 34% | 30% | Tie |
| 15 Feb | NOP/Daily Mail | 27.5% | 34% | 36% | 2% |
| 5 Feb | MORI | 41% | 36% | 21% | 5% |
| 31 Jan | MORI | 30% | 33% | 34% | 1% |
| 25 Jan | Gallup/Telegraph | 29% | 30% | 40% | 10% |
| 18 Jan | Gallup/Telegraph | 27.5% | 29.5% | 39.5% | 10% |
1981
| Survey End Date | Polling Organisation/Client | Con | Lab | All | Lead |
|---|---|---|---|---|---|
| 14 Dec | MORI | 23% | 23.5% | 50.5% | 27% |
| 14 Dec | NOP | 27% | 29% | 43% | 14% |
| 3 Dec | MORI | 30.5% | 34.3% | 33.1% | 1.2% |
| 1 Dec | NOP | 27% | 27% | 44% | 17% |
| 1 Dec | Gallup/Telegraph | 28.6% | 32.1% | 37.1% | 5% |
| 26 Nov | Crosby by-election | ||||
| 16 Nov | NOP | 26.5% | 29% | 42% | 13% |
| 6 Nov | MORI | 29.2% | 38.2% | 30.6% | 7.6% |
| 27 Oct | Gallup/Telegraph | 27% | 31% | 40% | 9% |
| 26 Oct | NOP | 29.5% | 28% | 40% | 12% |
| 22 Oct | Croydon North West by-election | ||||
| 8 Oct | MORI | 32.1% | 40.4% | 24.7% | 8.3% |
| 28 Sep | MORI | 28% | 42% | 28% | 14% |
| 18 Sep | Gallup/Telegraph | 27% | 38% | 33% | 5% |
| 14 Sep | NOP | 32% | 36.5% | 29% | 7.5% |
| 11 Sep | Gallup/Telegraph | 33.5% | 37.4% | 27.7% | 3.9% |
| 20 Aug | Fermanagh & South Tyrone second by-election | ||||
| 17 Aug | NOP | 28% | 38.5% | 32.5% | 6% |
| 7 Aug | MORI | 31.6% | 42.1% | 24.3% | 10.5% |
| 31 Jul | Gallup/Telegraph | 30% | 39% | 29% | 9% |
| 16 Jul | Warrington by-election | ||||
| 13 Jul | NOP | 30% | 40.5% | 26.5% | 10.5% |
| 9 Jul | MORI | 31.5% | 41.2% | 24.2% | 9.7% |
| 30 Jun | MORI | 30% | 36% | 31% | 6% |
| 22 Jun | MORI | 31% | 39% | 28% | 8% |
| 16 Jun | Gallup/Telegraph | 37% | 39% | 22% | 2% |
| 15 Jun | NOP | 29.5% | 37.5% | 30.5% | 8% |
| 7 Jun | The Social Democratic Party is formed[5] | ||||
| 5 Jun | MORI | 37.7% | 39.3% | 20.8% | 1.6% |
| 30 May | Gallup/Telegraph | 35% | 39% | 24% | 4% |
| 11 May | MORI | 32% | 35.5% | 29% | 3.5% |
| 11 May | NOP | 38% | 41% | 19% | 3% |
| 7–20 May | 1981 United Kingdom local elections | ||||
| 7 May | MORI | 30.9% | 39.3% | 26.6% | 8.4% |
| 27 Apr | Gallup/Telegraph | 30% | 38% | 29% | 8% |
| 13 Apr | NOP | 30% | 34.5% | 33% | 4.5% |
| 9 Apr | Fermanagh & South Tyrone by-election | ||||
| 3 Apr | MORI | 35.9% | 42.1% | 19.5% | 6.2% |
| 23 Mar | MORI | 33% | 41% | 25% | 8% |
| 23 Mar | Gallup/Telegraph | 28% | 38% | 32% | 10% |
| 16 Mar | NOP | 30% | 34% | 32% | 4% |
| 2 Mar | NOP | 37% | 41.1% | 16.5% | 4.1% |
| 13 Feb | Gallup/Telegraph | 34.5% | 50.9% | 12.2% | 16.4% |
| 11 Feb | MORI | 36% | 35.5% | 26.5% | 0.5% |
| 24 Jan | Gallup/Telegraph | 35% | 45% | 17% | 10% |
| 19 Jan | NOP | 33% | 46.5% | 18.5% | 13.5% |
| 9 Jan | MORI | 35.4% | 51.2% | 11.9% | 15.8% |
1980
| Survey End Date | Polling Organisation/Client | Con | Lab | Lib | Lead |
|---|---|---|---|---|---|
| 19 Dec | Gallup/Telegraph | 32% | 56% | 11% | 24% |
| 15 Dec | NOP | 35% | 47.5% | 14.5% | 12.5% |
| 4 Dec | Gallup/Telegraph | 37.2% | 47.7% | 12.6% | 10.5% |
| 17 Nov | MORI | 36.5% | 47% | 15% | 10.5% |
| 11 Nov | NOP | 38% | 47% | 13% | 9% |
| 10 Nov | Michael Foot becomes leader of the Labour Party[6] | ||||
| 7 Nov | MORI | 39.4% | 46.5% | 12.4% | 7.1% |
| 31 Oct | Gallup/Telegraph | 36% | 50% | 13% | 14% |
| 20 Oct | Gallup/Telegraph | 40% | 43% | 13.5% | 3% |
| 6 Oct | NOP | 40% | 43% | 13.5% | 3% |
| 2 Oct | MORI | 39.8% | 47.6% | 11% | 7.8% |
| 30 Sep | MORI | 34% | 50% | 15% | 16% |
| 29 Sep | Gallup/Telegraph | 37% | 46% | 15% | 9% |
| 15 Sep | NOP | 35.5% | 45% | 16.5% | 9.5% |
| 5 Sep | Gallup/Telegraph | 40% | 46.3% | 11.3% | 6.3% |
| 18 Aug | NOP | 38.5% | 44% | 14.5% | 5.5% |
| 1 Aug | MORI | 38.1% | 47.3% | 11.7% | 9.2% |
| 31 Jul | MORI | 37% | 48% | 13% | 11% |
| 27 Jul | Gallup/Telegraph | 37% | 47% | 13% | 10% |
| 14 Jul | NOP | 40% | 43.5% | 14% | 3.5% |
| 3 Jul | MORI | 41% | 46.9% | 10.4% | 5.9% |
| 26 Jun | Glasgow Central by-election | ||||
| 23 Jun | Gallup/Telegraph | 41% | 43% | 13% | 2% |
| 16 Jun | NOP | 40.5% | 45% | 11.5% | 4.5% |
| 6 Jun | Gallup/Telegraph | 43% | 43.3% | 11.7% | 0.3% |
| 19 May | NOP | 39% | 43.5% | 15.5% | 4.5% |
| 1 May | MORI | 41.4% | 46.5% | 10.7% | 5.1% |
| 1 May | 1980 United Kingdom local elections | ||||
| 28 Apr | Gallup/Telegraph | 39% | 44% | 14% | 5% |
| 14 Apr | NOP | 36.5% | 45% | 15% | 8.5% |
| 11 Apr | MORI | 35.5% | 49.6% | 10.9% | 14.1% |
| 28 Mar | Gallup/Telegraph | 42% | 46% | 9% | 4% |
| 17 Mar | NOP | 37% | 49.5% | 11.5% | 12.5% |
| 13 Mar | Southend East by-election | ||||
| 5 Mar | MORI | 35.7% | 51.9% | 11.2% | 16.2% |
| 29 Feb | MORI | 38% | 46% | 13% | 8% |
| 25 Feb | Gallup/Telegraph | 38% | 46% | 14% | 8% |
| 11 Feb | NOP | 37.5% | 42% | 18% | 4.5% |
| 8 Feb | MORI | 37.2% | 50.3% | 10.7% | 13.1% |
| 19 Jan | Gallup/Telegraph | 39% | 47% | 12% | 8% |
| 14 Jan | NOP | 36% | 45% | 16% | 9% |
| 4 Jan | MORI | 40.1% | 48.5% | 9.5% | 8.4% |
1979
| Survey End Date | Polling Organisation / Client | Con | Lab | Lib | Lead |
|---|---|---|---|---|---|
| 31 Dec | Gallup/Telegraph | 40% | 43% | 14% | 3% |
| 13 Dec | South West Hertfordshire by-election | ||||
| 10 Dec | NOP | 38% | 42% | 18% | 4% |
| 6 Dec | MORI | 42.1% | 46.3% | 10.1% | 4.2% |
| 2 Dec | Gallup/Telegraph | 40% | 45% | 13% | 5% |
| 12 Nov | NOP | 39% | 43.5% | 15.5% | 4.5% |
| 9 Nov | Gallup/Telegraph | 40.9% | 47.2% | 10% | 6.3% |
| 15 Oct | NOP | 40.5% | 45% | 12.5% | 4.5% |
| 6 Oct | MORI | 44.9% | 46% | 7.4% | 1.1% |
| 30 Sep | Gallup/Telegraph | 41% | 46% | 11% | 5% |
| 27 Sep | Manchester Central by-election | ||||
| 17 Sep | NOP | 40.5% | 45% | 12% | 4.5% |
| 2 Sep | MORI | 42.8% | 47.3% | 8.6% | 4.5% |
| 31 Aug | Gallup/Telegraph | 42% | 43% | 12% | 1% |
| 13 Aug | NOP | 41.5% | 44% | 12.5% | 2.5% |
| 5 Aug | MORI | 43.1% | 45.4% | 9.5% | 2.3% |
| 31 Jul | Gallup/Telegraph | 44% | 45% | 9% | 1% |
| 16 Jul | NOP | 41% | 46% | 11.5% | 5% |
| 7 Jul | Gallup/Telegraph | 44.2% | 45.5% | 8.2% | 1.3% |
| 18 Jun | Gallup/Telegraph | 42% | 43.5% | 12% | 1.5% |
| 7 Jun | 1979 European Parliament election | ||||
| 3 May | 1979 United Kingdom local elections | ||||
| 3 May | General election results | 43.9% | 36.9% | 13.8% | 7% |
References
- "UK Polling Report". ukpollingreport.co.uk. Retrieved 2018-08-16.
- "1982: Sinn Fein triumph in elections". 1982-10-21. Retrieved 2018-08-16.
- "1982: Argentina invades Falklands". 1982-04-02. Retrieved 2018-08-16.
- "1982: Argentina invades Falklands". 1982-04-02. Retrieved 2018-08-16.
- "1981: 'Gang of four' launches new party". 1981-03-26. Retrieved 2018-08-16.
- "1980: Michael Foot is new Labour leader". 1980-11-10. Retrieved 2018-08-16.
| General elections | |||||||||
|---|---|---|---|---|---|---|---|---|---|
| Leadership approval | |||||||||
| European elections | |||||||||
| Referendums |
| ||||||||
| Issues | |||||||||
| Devolved legislatures |
| ||||||||
This article is issued from Wikipedia. The text is licensed under Creative Commons - Attribution - Sharealike. Additional terms may apply for the media files.