2020 United States presidential election in Maine
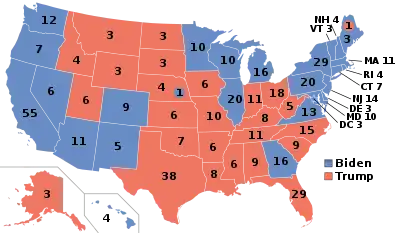
The 2020 United States presidential election in Maine was held on Tuesday, November 3, 2020, as part of the 2020 United States presidential election in which all 50 states plus the District of Columbia participated.[1] Maine voters chose electors to represent them in the Electoral College via a popular vote, pitting the Republican Party's nominee, incumbent President Donald Trump, and running mate Vice President Mike Pence against Democratic Party nominee, former Vice President Joe Biden, and his running mate California Senator Kamala Harris. Maine has four electoral votes in the Electoral College.[2] Unlike all other states except Nebraska, Maine awards two electoral votes based on the statewide vote, and one vote for each congressional district. In the 2016 election, Maine split its vote for the first time since 1828, awarding one electoral vote to Trump as he got the most votes in Maine's 2nd congressional district.[3]
| ||||||||||||||||||||||||||
| Turnout | 78% | |||||||||||||||||||||||||
|---|---|---|---|---|---|---|---|---|---|---|---|---|---|---|---|---|---|---|---|---|---|---|---|---|---|---|
| ||||||||||||||||||||||||||

| ||||||||||||||||||||||||||
| ||||||||||||||||||||||||||

.jpg.webp)
| Elections in Maine |
|---|
 |
Maine became the first state to use ranked-choice voting for a presidential general election, with voters able to rank their preferred candidates on the ballot.[4]
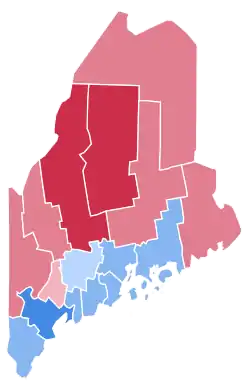
Biden carried Maine by a 9% margin over Trump, improving over Hillary Clinton's 3% win margin in 2016. Biden handily carried Maine's 1st congressional district by 23%, while Trump carried its 2nd congressional district by 7.5%, winning a single electoral vote from the state. This marked the first election in history in which Maine and Nebraska both split their electoral votes. Ranked-choice tabulation was ultimately not used as Biden earned a majority statewide and in the 1st district, while Trump earned a majority in the 2nd district. Biden narrowly flipped Kennebec County (home to the state capital, Augusta) four years after Clinton lost it. All other counties favored the same party they did in 2016.[5]
Maine is located in New England, an area that has become a hotbed for the Democratic Party. It was once a classic Rockefeller Republican state, but social issues have moved it to the Democratic column. Per exit polls by the Associated Press, Biden's strength in Maine came from liberals, with Biden winning whites 54%–44%, including 56% of white women. Biden was even competitive with Trump among Maine's gun owners, a traditionally Republican interest group, capturing 42% of their vote to Trump's 57%.[6]
Maine was one of sixteen states where President Trump received less percentage of the vote than he did in the 2016 election.[lower-alpha 2] This is the first time since 2004 that Maine's 2nd congressional district backed the candidate who lost the electoral college and overall presidential race.
Primary elections
The primary elections were held on Super Tuesday, March 3, 2020.
Republican primary
Incumbent President Donald Trump ran unopposed in the Republican primary, and thus he received all of Maine's 22 delegates to the 2020 Republican National Convention.[7]
| Candidate | Votes | % | Delegates[9] |
|---|---|---|---|
| Donald Trump | 95,360 | 83.85 | 22 |
| Blank ballots | 18,368 | 16.15 | 0 |
| Total | 113,728 | 100% | 22 |
Democratic primary
In an electoral upset, moderate candidate Joe Biden won the state, which primary opponent Bernie Sanders previously won in 2016.
| Candidate | Votes | % | Delegates[11] |
|---|---|---|---|
| Joe Biden | 68,729 | 33.37 | 11 |
| Bernie Sanders | 66,826 | 32.45 | 9 |
| Elizabeth Warren | 32,055 | 15.57 | 4 |
| Michael Bloomberg | 24,294 | 11.80 | |
| Pete Buttigieg (withdrawn†) | 4,364 | 2.12 | |
| Amy Klobuchar(withdrawn†) | 2,826 | 1.37 | |
| Tulsi Gabbard | 1,815 | 0.88 | |
| Andrew Yang (withdrawn†) | 696 | 0.34 | |
| Tom Steyer (withdrawn†) | 313 | 0.15 | |
| Deval Patrick (withdrawn†) | 218 | 0.11 | |
| Marianne Williamson (withdrawn) | 201 | 0.10 | |
| Cory Booker (withdrawn) | 183 | 0.09 | |
| Blank ballots | 3,417 | 1.66 | |
| Total | 205,937 | 100% | 24 |
Libertarian nominee
- Jo Jorgensen, Psychology Senior Lecturer at Clemson University
Green nominee
- Howie Hawkins, co-founder of the Green Party, trade unionist and environmental activist
Alliance nominee
- Rocky De La Fuente, businessman
General election
Libertarian
The Libertarian Party was recognized by Maine as an official party in June 2016 but lost that status in December 2018. To qualify for ballot access, Jorgensen was required to submit 4,000 petition signatures to the state by August 3. Jorgensen sued the state for a reduction of the signature requirement, citing an increase in the difficulty of petitioning caused by the COVID-19 pandemic.[12] Jorgensen was successful in appearing on the ballot.
At-large
| Source | Ranking | As of |
|---|---|---|
| The Cook Political Report[13] | Likely D | September 10, 2020 |
| Inside Elections[14] | Safe D | September 4, 2020 |
| Sabato's Crystal Ball[15] | Likely D | July 14, 2020 |
| Politico[16] | Lean D | September 8, 2020 |
| RCP[17] | Lean D | August 3, 2020 |
| Niskanen[18] | Safe D | July 26, 2020 |
| CNN[19] | Safe D | August 3, 2020 |
| The Economist[20] | Likely D | September 2, 2020 |
| CBS News[21] | Likely D | August 16, 2020 |
| 270towin[22] | Likely D | August 2, 2020 |
| ABC News[23] | Safe D | July 31, 2020 |
| NPR[24] | Likely D | August 3, 2020 |
| NBC News[25] | Likely D | August 6, 2020 |
| 538[26] | Likely D | October 8, 2020 |
1st district
| Source | Ranking | As of |
|---|---|---|
| The Cook Political Report[27] | Safe D | September 10, 2020 |
| Inside Elections[28] | Safe D | September 4, 2020 |
| Sabato's Crystal Ball[29] | Safe D | July 14, 2020 |
| Politico[30] | Safe D | September 8, 2020 |
| RCP[31] | Likely D | August 3, 2020 |
| Niskanen[18] | Safe D | July 26, 2020 |
| CNN[32] | Safe D | August 3, 2020 |
| The Economist[33] | Likely D | September 2, 2020 |
| CBS News[34] | Likely D | August 16, 2020 |
| 270towin[35] | Safe D | August 2, 2020 |
| ABC News[36] | Safe D | July 31, 2020 |
| NPR[37] | Likely D | August 3, 2020 |
| NBC News[38] | Likely D | August 6, 2020 |
| 538[39] | Solid D | September 9, 2020 |
| JHK Forecasts[40] | Safe D | November 3, 2020 |
2nd district
| Source | Ranking | As of |
|---|---|---|
| Princeton Electoral Consortium[41] | Likely D (flip) | October 30, 2020 |
| The Cook Political Report[42] | Tossup | September 10, 2020 |
| Inside Elections[43] | Tossup | September 4, 2020 |
| Sabato's Crystal Ball[44] | Lean R | November 2, 2020 |
| Politico[45] | Tossup | September 8, 2020 |
| RCP[46] | Tossup | August 3, 2020 |
| Niskanen[18] | Tossup | July 26, 2020 |
| CNN[47] | Tossup | August 3, 2020 |
| The Economist[48] | Likely D (flip) | September 2, 2020 |
| CBS News[49] | Tossup | August 16, 2020 |
| 270towin[50] | Tossup | August 2, 2020 |
| ABC News[51] | Tossup | July 31, 2020 |
| NPR[52] | Tossup | August 3, 2020 |
| NBC News[53] | Lean D (flip) | August 6, 2020 |
| 538[54] | Tossup | September 9, 2020 |
| JHK Forecasts[55] | Lean D (flip) | November 3, 2020 |
Graphical summary (statewide)
Aggregate polls
| Source of poll aggregation |
Dates administered |
Dates updated |
Joe Biden Democratic |
Donald Trump Republican |
Other/ Undecided [lower-alpha 3] |
Margin |
|---|---|---|---|---|---|---|
| 270 to Win | September 25 – October 31, 2020 | November 2, 2020 | 51.8% | 40.2% | 8.0% | Biden +11.6 |
| FiveThirtyEight | until October 31, 2020 | November 2, 2020 | 53.9% | 40.4% | 5.7% | Biden +13.5 |
| Average | 52.8% | 40.3% | 6.9% | Biden +12.5 | ||
Statewide polls
| Poll source | Date(s) administered |
Sample size[lower-alpha 4] |
Margin of error |
Donald Trump Republican |
Joe Biden Democratic |
Jo Jorgensen Libertarian |
Howie Hawkins Green |
Other | Undecided |
|---|---|---|---|---|---|---|---|---|---|
| Change Research | Oct 29 – Nov 2, 2020 | 1,024 (LV) | ± 3.5% | 40% | 52% | 4% | 2% | 1%[lower-alpha 5] | 1% |
| SurveyMonkey/Axios | Oct 20 – Nov 2, 2020 | 1,274 (LV) | ± 4% | 42%[lower-alpha 6] | 56% | – | – | – | – |
| Emerson College | Oct 29–31, 2020 | 611 (LV) | ± 3.9% | 43%[lower-alpha 7] | 54% | – | – | 2%[lower-alpha 8] | – |
| SurveyMonkey/Axios | Oct 1–28, 2020 | 1,995 (LV) | – | 43% | 56% | – | – | – | – |
| SurveyUSA/FairVote | Oct 23–27, 2020 | 1,007 (LV) | ± 3.7% | 40%[lower-alpha 9] | 53% | 2% | 2% | 1%[lower-alpha 10] | 2% |
| 42%[lower-alpha 11] | 55% | – | – | 1%[lower-alpha 12] | 2% | ||||
| Colby College | Oct 21–25, 2020 | 879 (LV) | ± 3.3% | 38% | 51% | – | – | 4%[lower-alpha 13] | 8% |
| Pan Atlantic Research | Oct 2–6, 2020 | 600 (LV) | ± 4.5% | 40% | 50% | – | – | 6%[lower-alpha 14] | 4% |
| Critical Insights/Digital Research/Bangor Daily News | Sep 25 – Oct 4, 2020 | 466 (LV) | ± 4.4% | 40%[lower-alpha 9] | 51% | 3% | 1% | 2%[lower-alpha 15] | 3% |
| 40%[lower-alpha 16] | 52% | – | – | 5%[lower-alpha 17] | 3% | ||||
| SurveyMonkey/Axios | Sep 1–30, 2020 | 729 (LV) | – | 38% | 60% | – | – | – | 2% |
| Data for Progress (D) | Sep 23–28, 2020 | 718 (LV) | ± 3.7% | 39%[lower-alpha 9] | 53% | 2% | 1% | – | 5% |
| 41%[lower-alpha 18] | 55% | – | – | – | 4% | ||||
| Colby College | Sep 17–23, 2020 | 847 (LV) | ± 3.4% | 39% | 50% | – | – | 4%[lower-alpha 19] | 6% |
| Suffolk University/Boston Globe | Sep 17–20, 2020 | 500 (LV) | ± 4.4% | 39%[lower-alpha 9] | 51% | 1% | 0% | 1%[lower-alpha 20] | 7% |
| 39%[lower-alpha 21] | 51% | – | – | 2%[lower-alpha 22] | 8% | ||||
| Siena College/NYT Upshot | Sep 11–16, 2020 | 663 (LV) | ± 5.1% | 38%[lower-alpha 23] | 55% | 0% | 0% | 1%[lower-alpha 24] | 6%[lower-alpha 25] |
| Quinnipiac University | Sep 10–14, 2020 | 1,183 (LV) | ± 2.9% | 38% | 59% | – | – | 0%[lower-alpha 26] | 3% |
| Fabrizio Ward/Hart Research Associates/AARP | Aug 30 – Sep 5, 2020 | 800 (LV) | ± 3.5% | 40% | 54% | – | – | 1%[lower-alpha 27] | 5% |
| SurveyMonkey/Axios | Aug 1–31, 2020 | 502 (LV) | – | 37% | 61% | – | – | – | 1% |
| Critical Insights/Digital Research/Bangor Daily News | Jul 28 – Aug 9, 2020 | 453 (LV) | – | 38% | 45% | – | – | 11%[lower-alpha 28] | 6% |
| Quinnipiac University | Jul 30 – Aug 3, 2020 | 805 (RV) | ± 3.7% | 37% | 52% | – | – | 6%[lower-alpha 29] | 4% |
| RMG Research | Jul 27 – Aug 2, 2020 | 500 (RV) | ± 4.5% | 39% | 50% | – | – | 7%[lower-alpha 30] | 4% |
| Data for Progress | Jul 24 – Aug 2, 2020 | 866 (LV) | – | 42%[lower-alpha 9] | 49% | 1% | 1% | – | 7% |
| 43%[lower-alpha 31] | 53% | – | – | – | 4% | ||||
| SurveyMonkey/Axios | Jul 1–31, 2020 | 733 (LV) | – | 41% | 57% | – | – | – | 1% |
| Public Policy Polling/AFSCME[upper-alpha 1] | Jul 23–24, 2020 | 962 (V) | – | 42% | 53% | – | – | – | 5% |
| Colby College/SocialSphere | Jul 18–24, 2020 | 888 (RV) | ± 3.9% | 38% | 50% | – | – | 5%[lower-alpha 32] | 7% |
| Public Policy Polling | Jul 2–3, 2020 | 1,022 (V) | ± 3.1% | 42% | 53% | – | – | – | 5% |
| SurveyMonkey/Axios | Jun 8–30, 2020 | 202 (LV) | – | 46% | 51% | – | – | – | 3% |
| Public Policy Polling | Mar 2–3, 2020 | 872 (V) | ± 3.3% | 42% | 52% | – | – | – | 6% |
| Public Policy Polling | Oct 11–13, 2019 | 939 (LV) | ± 3.2% | 42% | 54% | – | – | – | 4% |
| Fabrizio Ward/AARP | Jul 29–31, 2019 | 600 (LV) | ± 4.0% | 44% | 50% | – | – | – | 5% |
| Gravis Marketing | Jun 24, 2019 | 767 (RV) | ± 3.5% | 46% | 54% | – | – | – | – |
Graphical summary
Aggregate polls
| Source of poll aggregation |
Dates administered |
Dates updated |
Joe Biden Democratic |
Donald Trump Republican |
Other/ Undecided [lower-alpha 3] |
Margin |
|---|---|---|---|---|---|---|
| Real Clear Politics | September 17 – October 6, 2020 | October 30, 2020 | 56.7% | 34.3% | 9.0% | Biden +22.4 |
with Donald Trump and Joe Biden
| Poll source | Date(s) administered |
Sample size[lower-alpha 4] |
Margin of error |
Donald Trump Republican |
Joe Biden Democratic |
Jo Jorgensen Libertarian |
Howie Hawkins Green |
Other | Undecided |
|---|---|---|---|---|---|---|---|---|---|
| Change Research | Oct 29 – Nov 2, 2020 | 549 (LV) | – | 35% | 56% | 4% | 3% | – | – |
| Emerson College | Oct 29–31, 2020 | 310 (LV) | – | 39% | 58% | – | – | 3%[lower-alpha 33] | 1% |
| SurveyUSA/FairVote | Oct 23–27, 2020 | 498 (LV) | – | 35%[lower-alpha 9] | 59% | 2% | 2% | 1%[lower-alpha 34] | 2% |
| 36%[lower-alpha 35] | 61% | – | – | 1%[lower-alpha 36] | 2% | ||||
| Colby College | Oct 21–25, 2020 | 426 (LV) | – | 34% | 56% | – | – | 4%[lower-alpha 37] | 7% |
| Pan Atlantic Research | Oct 2–6, 2020 | 300 (LV) | ± 6.4% | 37% | 54% | – | – | 7% | – |
| Critical Insights/Digital Research/Bangor Daily News | Sep 25 – Oct 4, 2020 | 232 (LV) | – | 30% | 62% | 3% | 1% | 2%[lower-alpha 38] | 3% |
| Colby College | Sep 17–23, 2020 | 416 (LV) | – | 36% | 54% | – | – | 5%[lower-alpha 39] | 5% |
| Suffolk University/Boston Globe | Sep 17–20, 2020 | 267 (LV) | – | 33%[lower-alpha 9] | 54% | 2% | 0% | 1%[lower-alpha 40] | 9% |
| 34%[lower-alpha 41] | 55% | 0% | 0% | 2%[lower-alpha 42] | 9% | ||||
| Quinnipiac University | Sep 10–14, 2020 | 707 (LV) | – | 32% | 64% | – | – | 1%[lower-alpha 43] | 3% |
| Fabrizio Ward/Hart Research Associates/AARP | Aug 30 – Sep 5, 2020 | 433 (LV) | – | 35% | 58% | – | – | – | – |
| Critical Insights/Digital Research/Bangor Daily News | Jul 28 – Aug 9, 2020 | 250 (LV) | – | 33% | 49% | – | – | 11%[lower-alpha 44] | 6% |
| Quinnipiac University | Jul 30 – Aug 3, 2020 | 392 (LV)[lower-alpha 45] | – | 30% | 61% | – | – | 6%[lower-alpha 46] | 3% |
| Colby College/SocialSphere | Jul 18–24, 2020 | 425 (LV) | – | 35% | 55% | – | – | 6%[lower-alpha 47] | 5% |
| Public Policy Polling | Oct 11–13, 2019 | 478 (LV) | – | 38% | 58% | – | – | – | 3% |
Graphical summary
with Donald Trump and Joe Biden
| Poll source | Date(s) administered |
Sample size[lower-alpha 4] |
Margin of error |
Donald Trump Republican |
Joe Biden Democratic |
Jo Jorgensen Libertarian |
Howie Hawkins Green |
Other | Undecided |
|---|---|---|---|---|---|---|---|---|---|
| Change Research | Oct 29 – Nov 2, 2020 | 475 (LV) | ± 4.6% | 46%[lower-alpha 9] | 47% | 4% | 1% | 0%[lower-alpha 48] | 1% |
| 50%[lower-alpha 49] | 50% | – | – | – | – | ||||
| Emerson College | Oct 29–31, 2020 | 301 (LV) | – | 47% | 50% | – | – | 3%[lower-alpha 50] | 0% |
| SurveyUSA/FairVote | Oct 23–27, 2020 | 509 (LV) | – | 45%[lower-alpha 9] | 48% | 2% | 2% | 1%[lower-alpha 51] | 2% |
| 49%[lower-alpha 52] | 51% | – | – | – | – | ||||
| Colby College | Oct 21–25, 2020 | 453 (LV) | – | 42% | 46% | – | – | 4%[lower-alpha 53] | 9% |
| Pan Atlantic Research | Oct 2–6, 2020 | 300 (LV) | ± 6.4% | 43% | 47% | – | – | 6% | – |
| Critical Insights/Digital Research/Bangor Daily News | Sep 25 – Oct 4, 2020 | 234 (LV) | – | 49% | 41% | 2% | 1% | 1%[lower-alpha 54] | 3% |
| Colby College | Sep 17–23, 2020 | 425 (LV) | – | 43% | 46% | – | – | 3%[lower-alpha 55] | 8% |
| Suffolk University/Boston Globe | Sep 17–20, 2020 | 233 (LV) | – | 45%[lower-alpha 9] | 47% | 0% | 0% | 1%[lower-alpha 56] | 6% |
| 45%[lower-alpha 57] | 47% | 0% | 0% | 1%[lower-alpha 58] | 6% | ||||
| Siena College/NYT Upshot | Sep 11–16, 2020 | 440 (LV) | – | 45%[lower-alpha 59] | 47% | – | – | – | – |
| Quinnipiac University | Sep 10–14, 2020 | 476 (LV) | – | 44% | 53% | – | – | 0%[lower-alpha 60] | 3% |
| Fabrizio Ward/Hart Research Associates/AARP | Aug 30 – Sep 5, 2020 | 367 (LV) | – | 45% | 49% | – | – | – | – |
| Left of Centre PAC[upper-alpha 2] | Aug 25–28, 2020 | 400 (LV) | ± 4.9% | 49% | 48% | – | – | – | 3% |
| Critical Insights/Digital Research/Bangor Daily News | Jul 28 – Aug 9, 2020 | 249 (LV) | – | 38% | 39% | – | – | 12%[lower-alpha 61] | 11% |
| Quinnipiac University | Jul 30 – Aug 3, 2020 | 382 (RV)[lower-alpha 45] | – | 45% | 44% | – | – | 6%[lower-alpha 62] | 5% |
| Colby College/SocialSphere | Jul 18–24, 2020 | 449 (LV) | – | 42% | 45% | – | – | 4%[lower-alpha 63] | 9% |
| Public Policy Polling | Oct 11–13, 2019 | 461 (LV) | – | 46% | 49% | – | – | – | 4% |
Former candidates | |||||||||||||||||||||||||||||||||||||||||||||||||||||||||||||||||||||||||||||||||||||||||||||||||||||||||||||||||||||||||||||||||||||||||||||||||||||||||||||||||||||||||||||||||||||||||||||||||||||||||||
|---|---|---|---|---|---|---|---|---|---|---|---|---|---|---|---|---|---|---|---|---|---|---|---|---|---|---|---|---|---|---|---|---|---|---|---|---|---|---|---|---|---|---|---|---|---|---|---|---|---|---|---|---|---|---|---|---|---|---|---|---|---|---|---|---|---|---|---|---|---|---|---|---|---|---|---|---|---|---|---|---|---|---|---|---|---|---|---|---|---|---|---|---|---|---|---|---|---|---|---|---|---|---|---|---|---|---|---|---|---|---|---|---|---|---|---|---|---|---|---|---|---|---|---|---|---|---|---|---|---|---|---|---|---|---|---|---|---|---|---|---|---|---|---|---|---|---|---|---|---|---|---|---|---|---|---|---|---|---|---|---|---|---|---|---|---|---|---|---|---|---|---|---|---|---|---|---|---|---|---|---|---|---|---|---|---|---|---|---|---|---|---|---|---|---|---|---|---|---|---|---|---|---|---|
|
Hypothetical polling | ||||||||||||||||||||||||||||||||||||||||||||||||||||||||
|---|---|---|---|---|---|---|---|---|---|---|---|---|---|---|---|---|---|---|---|---|---|---|---|---|---|---|---|---|---|---|---|---|---|---|---|---|---|---|---|---|---|---|---|---|---|---|---|---|---|---|---|---|---|---|---|---|
|
Statewide (2 electoral votes)
| Party | Candidate | Votes | % | ±% | |
|---|---|---|---|---|---|
| Democratic | Joe Biden Kamala Harris |
435,072 | 53.09% | +5.26% | |
| Republican | Donald Trump Mike Pence |
360,737 | 44.02% | -0.85% | |
| Libertarian | Jo Jorgensen Spike Cohen |
14,152 | 1.73% | -3.36% | |
| Green | Howie Hawkins Angela Walker |
8,230 | 1.00% | -0.91% | |
| Alliance | Rocky De La Fuente Darcy Richardson |
1,183 | 0.14% | N/A | |
| Write-in | 87 | 0.01% | N/A | ||
| Total votes | 819,461 | 100.00% | |||
1st congressional district (1 electoral vote)
| Party | Candidate | Votes | % | ±% | |
|---|---|---|---|---|---|
| Democratic | Joe Biden Kamala Harris |
266,376 | 60.11% | +6.15% | |
| Republican | Donald Trump Mike Pence |
164,045 | 37.02% | -2.13% | |
| Libertarian | Jo Jorgensen Spike Cohen |
7,343 | 1.66% | -3.05% | |
| Green | Howie Hawkins Angela Walker |
4,654 | 1.05% | -0.87% | |
| Alliance | Rocky De La Fuente Darcy Richardson |
649 | 0.15% | N/A | |
| Write-in | 45 | 0.01% | N/A | ||
| Total votes | 443,112 | 100.00% | |||
2nd congressional district (1 electoral vote)
| Party | Candidate | Votes | % | ±% | |
|---|---|---|---|---|---|
| Republican | Donald Trump Mike Pence |
196,692 | 52.26% | +1.00% | |
| Democratic | Joe Biden Kamala Harris |
168,696 | 44.82% | +3.84% | |
| Libertarian | Jo Jorgensen Spike Cohen |
6,809 | 1.81% | -3.71% | |
| Green | Howie Hawkins Angela Walker |
3,576 | 0.95% | -0.94% | |
| Alliance | Rocky De La Fuente Darcy Richardson |
534 | 0.14% | N/A | |
| Write-in | 42 | 0.01% | N/A | ||
| Total votes | 376,349 | 100.00% | |||
By county
| Joe Biden Democrat |
Donald Trump Republican |
Other | Margin | Total | |||||
|---|---|---|---|---|---|---|---|---|---|
| County | Votes | % | Votes | % | Votes | % | Votes | % | Votes |
| Androscoggin | 27,617 | 47.04% | 29,268 | 49.85% | 2,476 | 4.17% | 1,651 | -2.78% | 59,361 |
| Aroostook | 13,956 | 39.04% | 21,080 | 58.97% | 1,174 | 3.24% | 7,124 | -19.67% | 36,210 |
| Cumberland | 128,759 | 66.45% | 59,584 | 30.75% | 7,571 | 3.86% | 69,175 | 35.31% | 195,914 |
| Franklin | 8,484 | 46.16% | 9,294 | 50.57% | 776 | 4.41% | 685 | -3.89% | 17,599 |
| Hancock | 19,369 | 54.83% | 14,982 | 42.41% | 1,325 | 3.71% | 4,387 | 12.30% | 35,676 |
| Kennebec | 34,902 | 48.57% | 34,721 | 48.32% | 2,992 | 4.12% | 181 | 0.25% | 72,615 |
| Knox | 14,695 | 59.38% | 9,442 | 38.16% | 940 | 3.61% | 5,128 | 19.70% | 26,032 |
| Lincoln | 12,684 | 53.76% | 10,256 | 43.47% | 917 | 3.84% | 2,428 | 10.18% | 23,857 |
| Oxford | 14,743 | 44.06% | 17,698 | 52.83% | 1,357 | 4.01% | 2,943 | -8.70% | 33,810 |
| Penobscot | 37,725 | 44.23% | 44,845 | 52.57% | 3,595 | 4.17% | 7,112 | -8.26% | 86,133 |
| Piscataquis | 3,517 | 35.50% | 6,143 | 62.00% | 336 | 3.36% | 2,626 | -26.27% | 9,996 |
| Sagadahoc | 13,528 | 56.28% | 9,755 | 40.58% | 997 | 4.11% | 3,773 | 15.54% | 24,280 |
| Somerset | 10,199 | 36.98% | 16,644 | 60.35% | 1,030 | 3.70% | 6,445 | -23.12% | 27,873 |
| Waldo | 12,345 | 50.76% | 11,196 | 46.03% | 1,025 | 4.17% | 1,149 | 4.68% | 24,566 |
| Washington | 6,761 | 38.95% | 10,194 | 58.73% | 615 | 3.50% | 3,433 | -19.54% | 17,570 |
| York | 71,189 | 54.90% | 54,817 | 42.28% | 5,036 | 3.84% | 16,372 | 12.49% | 131,042 |
By congressional district
Joe Biden won the 1st district as the incumbent Democratic representative was re-elected. Donald Trump won the 2nd district despite the incumbent Democratic representative being re-elected.
| District | Biden | Trump | Representative |
|---|---|---|---|
| 1st | 60.11% | 37.02% | Chellie Pingree |
| 2nd | 44.82% | 52.26% | Jared Golden |
See also
Notes
- Maine uses ranked-choice voting. Results shown are first-choice votes.
- The other fifteen states were Alabama, Connecticut, Delaware, Georgia, Kentucky, Maryland, Massachusetts, Mississippi, Nebraska, New Hampshire, New Jersey, Rhode Island, Tennessee, Texas and Virginia.
- Calculated by taking the difference of 100% and all other candidates combined.
- Key:
A – all adults
RV – registered voters
LV – likely voters
V – unclear - Did not vote with 1%; "Don't recall" and would not vote with 0%
- Overlapping sample with the previous SurveyMonkey/Axios poll, but more information available regarding sample size
- With voters who lean towards a given candidate
- "Someone else" with 2%
- Standard VI response
- De La Fuente (A) with 1%
- Reassigning the second and third preferences of non-Biden/Trump voters
- "No second choice"/"no third choice" with 1%
- "One of the minor party candidates" with 4%
- "All other candidates" with 6%
- "Refused" with 2%; De La Fuente (A) with no voters
- Ressigning the second preferences of Hawkins and Jorgensen voters
- "Refused" with 2%; De La Fuente (A), "No second preference" and "Someone else" with 1%; Hawkins (G) with 0%; Jorgensen (L) with no voters
- If the only candidates were Biden and Trump
- "A minor party candidate" with 4%
- "Refused" with 1%; Fuente (A) and "Other" with 0%
- Reassigning the second and third preferences of non-Biden/Trump voters
- "Refused" with 1%; Fuente (A) and Hawkins (G) with 0%; Jorgensen (L) and "Other" with no voters
- Topline after Ranked-Choice Voting is used
- Would not vote with 1%; "someone else" with 0%
- Includes "Refused"
- "Someone else" with 0%
- Would not vote with 1%
- "Someone else" with 8%; "Prefer not to say" and would not vote with 1%
- "Someone else" and would not vote with 3%
- "Some other candidate" with 7%
- If only Biden and Trump were candidates
- "One of the minor party candidates" with 5%
- "Someone else" with 3%
- De La Fuente (A) with 1%
- Reassigning the second and third preferences of non-Biden/Trump voters
- "No second choice"/"no third choice" with 1%
- "One of the minor party candidates" with 4%
- "Refused" and "Someone else" with 1%; De La Fuente (A) with no voters
- "A minor party candidate" with 5%
- "Refused" with 1%; Fuente (A) and "Other" with 0%
- Reassigning the second and third preferences of non-Biden/Trump voters
- "Refused" with 2%; Fuente (A) with 0%; "Other" with no voters
- "Someone else" with 1%
- "Someone else" with 9%; "Prefer not to say" with 2%; Would not vote with 1%
- Additional data sourced from FiveThirtyEight
- "Someone else" with 2%; would not vote with 4%
- "One of the minor party candidates" with 6%
- Did not vote, "Don't recall" and would not vote with 0%
- After three rounds of ranked choice voting
- "Someone else" with 3%
- De La Fuente (A) with 1%
- With Ranked Choice Voting
- "One of the minor party candidates" with 4%
- "Refused" with 1%; "Someone else" with 0%; De La Fuente (A) with no voters
- "A minor party candidate" with 3%
- "Refused" with 1%; "Other" with 0%; Fuente (A) with no voters
- Reassigning the second and third preferences of non-Biden/Trump voters
- "Refused" with 1%; Fuente (A) "Other" with no voters
- Topline after Ranked-Choice Voting is used
- "Someone else" with 0%
- "Someone else" with 8%; "Prefer not to say" and would not vote with 2%
- "Someone else" and would not vote with 3%
- "One of the minor party candidates" with 4%
- "It depends on who the Democratic candidate is" with 15%; "Undecided at this time" with 15%
- "Consider voting for Trump" with 15%; Undecided with 5%
- "It depends on who the Democratic candidate is" with 15%; "Undecided at this time" with 16%
- "It depends on who the Democratic candidate is" with 14%; "Undecided at this time" with 14%
- Partisan clients
- AFSCME endorsed Biden prior to this poll's sampling period
- The pollster exclusively supports Democratic candidates
References
- Kelly, Ben (August 13, 2018). "US elections key dates: When are the 2018 midterms and the 2020 presidential campaign?". The Independent. Retrieved January 3, 2019.
- "Distribution of Electoral Votes". National Archives and Records Administration. Retrieved January 3, 2019.
- "Bureau of Corporations, Elections & Commissions, Elections and Voting, Results, 2014 Tabulations". State.me.us. Retrieved August 25, 2017.
- Thistle, Scott (September 6, 2019). "Gov. Mills allows ranked-choice voting in Maine's presidential elections". Press Herald. Retrieved September 6, 2019.
- "Maine presidential election results 2020: Live results and polls". www.nbcnews.com. Retrieved November 19, 2020.
- "Maine Voter Surveys: How Different Groups Voted". The New York Times. November 3, 2020. ISSN 0362-4331. Retrieved November 9, 2020.
- "Maine Republican Delegation 2020". The Green Papers. Retrieved March 20, 2020.
- "Bureau of Corporations, Elections & Commissions, Elections and Voting, Tabulations June 12, 2018". maine.gov. Maine Secretary of State. Retrieved March 25, 2020.
- "Maine Election Results 2020". PBS NewsHour. Retrieved March 26, 2020.
- "March 3, 2020 Presidential Primary Election: Tabulation of Votes". State of Maine Department of the Secretary of State, Bureau of Corporations, Elections & Commissions. Retrieved October 14, 2020.
- "Maine Election Results 2020". PBS NewsHour. Retrieved March 11, 2020.
- Shepherd, Michael. "Libertarian presidential candidate sues Maine in bid to loosen ballot access rules". Bangor Daily News. Retrieved August 2, 2020.
- "2020 POTUS Race ratings" (PDF). The Cook Political Report. Retrieved May 21, 2019.
- "POTUS Ratings | Inside Elections". insideelections.com. Retrieved May 21, 2019.
- "Larry J. Sabato's Crystal Ball » 2020 President". crystalball.centerforpolitics.org. Retrieved May 21, 2019.
- "2020 Election Forecast". Politico. November 19, 2019.
- "Battle for White House". RCP. April 19, 2019.
- 2020 Bitecofer Model Electoral College Predictions, Niskanen Center, March 24, 2020, retrieved: April 19, 2020.
- David Chalian; Terence Burlij. "Road to 270: CNN's debut Electoral College map for 2020". CNN. Retrieved June 16, 2020.
- "Forecasting the US elections". The Economist. Retrieved July 7, 2020.
- "2020 Election Battleground Tracker". CBS News. July 12, 2020. Retrieved July 13, 2020.
- "2020 Presidential Election Interactive Map". 270 to Win.
- "ABC News Race Ratings". CBS News. July 24, 2020. Retrieved July 24, 2020.
- "2020 Electoral Map Ratings: Trump Slides, Biden Advantage Expands Over 270 Votes". NPR.org. Retrieved August 3, 2020.
- "Biden dominates the electoral map, but here's how the race could tighten". NBC News. Retrieved August 6, 2020.
- "2020 Election Forecast". FiveThirtyEight. Retrieved August 14, 2020.
- "2020 POTUS Race ratings" (PDF). The Cook Political Report. Retrieved May 21, 2019.
- "POTUS Ratings | Inside Elections". insideelections.com. Retrieved May 21, 2019.
- "Larry J. Sabato's Crystal Ball » 2020 President". crystalball.centerforpolitics.org. Retrieved May 21, 2019.
- "2020 Election Forecast". Politico. November 19, 2019.
- "Battle for White House". RCP. April 19, 2019.
- David Chalian; Terence Burlij. "Road to 270: CNN's debut Electoral College map for 2020". CNN. Retrieved June 16, 2020.
- "Forecasting the US elections". The Economist. Retrieved July 7, 2020.
- "2020 Election Battleground Tracker". CBS News. July 12, 2020. Retrieved July 13, 2020.
- "2020 Presidential Election Interactive Map". 270 to Win.
- "ABC News Race Ratings". CBS News. July 24, 2020. Retrieved July 24, 2020.
- "2020 Electoral Map Ratings: Trump Slides, Biden Advantage Expands Over 270 Votes". NPR.org. Retrieved August 3, 2020.
- "Biden dominates the electoral map, but here's how the race could tighten". NBC News. Retrieved August 6, 2020.
- "2020 Election Forecast". FiveThirtyEight. Retrieved August 14, 2020.
- "JHK Forecasts Presidential Election Forecast". JHKForecasts. Retrieved November 3, 2020.
- "2020 Electoral Maps from Princeton Election Consortium". Princeton Electoral Consortium. Retrieved September 17, 2020.
- "2020 POTUS Race ratings" (PDF). The Cook Political Report. Retrieved May 21, 2019.
- "POTUS Ratings | Inside Elections". insideelections.com. Retrieved May 21, 2019.
- "Larry J. Sabato's Crystal Ball » 2020 President". crystalball.centerforpolitics.org. Retrieved November 2, 2020.
- "2020 Election Forecast". Politico. November 19, 2019.
- "Battle for White House". RCP. April 19, 2019.
- David Chalian; Terence Burlij. "Road to 270: CNN's debut Electoral College map for 2020". CNN. Retrieved June 16, 2020.
- "Forecasting the US elections". The Economist. Retrieved July 7, 2020.
- "2020 Election Battleground Tracker". CBS News. July 12, 2020. Retrieved July 13, 2020.
- "2020 Presidential Election Interactive Map". 270 to Win.
- "ABC News Race Ratings". CBS News. July 24, 2020. Retrieved July 24, 2020.
- "2020 Electoral Map Ratings: Trump Slides, Biden Advantage Expands Over 270 Votes". NPR.org. Retrieved August 3, 2020.
- "Biden dominates the electoral map, but here's how the race could tighten". NBC News. Retrieved August 6, 2020.
- "2020 Election Forecast". FiveThirtyEight. Retrieved August 14, 2020.
- "JHK Forecasts Presidential Election Forecast". JHKForecasts. Retrieved November 3, 2020.
- "U.S. President by Congressional District". Maine Department of the Secretary of State. Retrieved December 9, 2020.
- "Official Results". Maine Secretary of State. Retrieved November 25, 2020.
Further reading
- Summary: State Laws on Presidential Electors (PDF), Washington DC: National Association of Secretaries of State, August 2020,
Maine
External links
- Elections & Voting division of the Maine Secretary of State
- Government Documents Round Table of the American Library Association, "Maine", Voting & Elections Toolkits
- "Maine: Election Tools, Deadlines, Dates, Rules, and Links", Vote.org, Oakland, CA
- "League of Women Voters of Maine". (State affiliate of the U.S. League of Women Voters)