Pinal County, Arizona
Pinal County is located in the central part of the U.S. state of Arizona. According to U.S. Census Bureau estimates in 2019, the population of the county was 462,789,[1] making it Arizona's third-most populous county. The county seat is Florence. The county was founded in 1875.
Pinal County | |
|---|---|
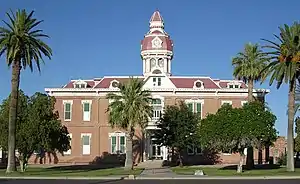 Second Pinal County Courthouse in Florence | |
 Seal | |
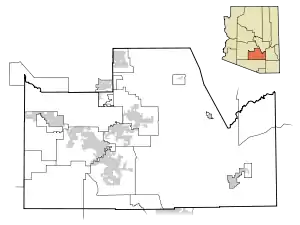
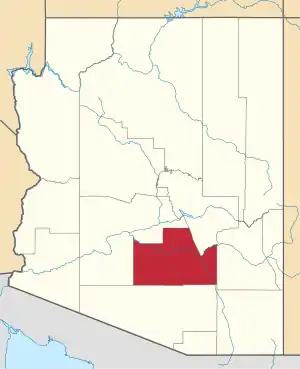 Location within the U.S. state of Arizona | |
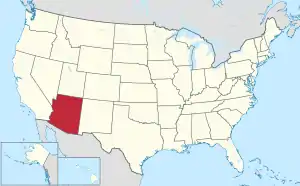 Arizona's location within the U.S. | |
| Coordinates: 32°59′13″N 111°19′38″W | |
| Country | |
| State | |
| Founded | February 1, 1875 |
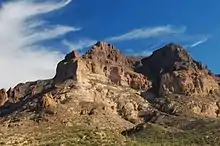
| Named for | Pinal Peak |
| Seat | Florence |
| Largest city | San Tan Valley Casa Grande (incorporated) |
| Area | |
| • Total | 5,374 sq mi (13,920 km2) |
| • Land | 5,366 sq mi (13,900 km2) |
| • Water | 8.6 sq mi (22 km2) 0.2%% |
| Population (2010) | |
| • Total | 375,770 |
| • Estimate (2019) | 462,789 |
| • Density | 70/sq mi (27/km2) |
| Time zone | UTC−7 (Mountain) |
| Congressional districts | 1st, 3rd, 4th |
| Website | www |
Pinal County contains parts of the Tohono Oʼodham Nation, the Gila River Indian Community and the San Carlos Apache Indian Reservation, as well as the entirety of the Ak-Chin Indian Community.
Pinal County is included in the Phoenix–Mesa–Scottsdale, Arizona Metropolitan Statistical Area. Suburban growth southward from greater Phoenix has begun to spread into the northern parts of the county; similarly, growth northward from Tucson is spreading into the southern portions of the county. The Pinal County cities of Maricopa and Casa Grande, as well as many unincorporated areas, have shown accelerated growth patterns in recent years; such suburban development is likely to continue for the foreseeable future.
History
Pinal County was carved out of neighboring Maricopa County and Pima County on February 1, 1875, during the Eighth Legislature. In the August 18, 1899, issue of The Arizona Magazine, the name "Pinal" is said to come from the pine-clad Pinal Mountains.[2] Pinal County was the second-fastest-growing county in the U.S. between 2000 and 2010.[3]
In 2010 CNN Money named Pinal County as the 2nd fastest growing county in the USA.[4]
Geography

According to the U.S. Census Bureau, the county has a total area of 5,374 square miles (13,920 km2), of which 5,366 square miles (13,900 km2) is land and 8.6 square miles (22 km2) (0.2%) is water.[5]
Mountain ranges
Adjacent counties
- Maricopa County – west, north
- Gila County – north
- Graham County – east
- Pima County – south
Major highways
National protected areas
Demographics
| Historical population | |||
|---|---|---|---|
| Census | Pop. | %± | |
| 1880 | 3,044 | — | |
| 1890 | 4,251 | 39.7% | |
| 1900 | 7,779 | 83.0% | |
| 1910 | 9,045 | 16.3% | |
| 1920 | 16,130 | 78.3% | |
| 1930 | 22,081 | 36.9% | |
| 1940 | 28,841 | 30.6% | |
| 1950 | 43,191 | 49.8% | |
| 1960 | 62,673 | 45.1% | |
| 1970 | 67,916 | 8.4% | |
| 1980 | 90,918 | 33.9% | |
| 1990 | 116,379 | 28.0% | |
| 2000 | 179,727 | 54.4% | |
| 2010 | 375,770 | 109.1% | |
| 2019 (est.) | 462,789 | [6] | 23.2% |
| U.S. Decennial Census[7] 1790–1960[8] 1900–1990[9] 1990–2000[10] 2010–2018[11] | |||
2000 census
As of the 2000 census, there were 179,727 people, 61,364 households, and 45,225 families living in the county. The population density was 34 people per square mile (13/km2). There were 81,154 housing units at an average density of 15/sq mi (6/km2). The racial makeup of the county was 70.42% White, 2.76% Black or African American, 7.81% Native American, 0.60% Asian, 0.08% Pacific Islander, 15.66% from other races, and 2.67% from two or more races. 29.86% of the population were Hispanic or Latino of any race. 21.86% reported speaking Spanish at home, while 1.44% speak O'odham and 0.02% speak Apache.[12]
Of the 61,364 households 29.80% had children under the age of 18 living with them, 56.90% were married couples living together, 11.50% had a female householder with no husband present, and 26.30% were non-families. 21.10% of households were one person and 9.20% were one person aged 65 or older. The average household size was 2.68 and the average family size was 3.09.
The age distribution was 25.10% under the age of 18, 8.70% from 18 to 24, 27.30% from 25 to 44, 22.70% from 45 to 64, and 16.20% 65 or older. The median age was 37 years. For every 100 females, there were 114.20 males. For every 100 females age 18 and over, there were 117.00 males.
The median household income was $35,856 and the median family income was $39,548. Males had a median income of $31,544 versus $23,726 for females. The per capita income for the county was $16,025. About 12.10% of families and 16.90% of the population were below the poverty threshold, including 25.50% of those under age 18 and 8.70% of those age 65 or over.
2010 census
As of the 2010 census, there were 375,770 people, 125,590 households, and 92,157 families living in the county.[13] The population density was 70.0 inhabitants per square mile (27.0/km2). There were 159,222 housing units at an average density of 29.7 per square mile (11.5/km2).[14] The racial makeup of the county was 72.4% white, 5.6% American Indian, 4.6% black or African American, 1.7% Asian, 0.4% Pacific islander, 11.5% from other races, and 3.8% from two or more races. Those of Hispanic or Latino origin made up 28.5% of the population.[13] In terms of ancestry, 16.9% were German, 10.6% were Irish, 9.5% were English, and 2.8% were American.[15]
Of the 125,590 households, 37.0% had children under the age of 18 living with them, 55.8% were married couples living together, 11.7% had a female householder with no husband present, 26.6% were non-families, and 20.5% of households were made up of individuals. The average household size was 2.78 and the average family size was 3.21. The median age was 35.3 years.[13]
The median household income was $51,310 and the median family income was $56,299. Males had a median income of $45,082 versus $34,785 for females. The per capita income for the county was $21,716. About 10.1% of families and 13.5% of the population were below the poverty line, including 18.3% of those under age 18 and 7.6% of those age 65 or over.[16]
Politics
During the 20th century, Pinal was very much a bellwether county in U.S. presidential elections, having supported the winning candidate in every election between Arizona's statehood in 1912 and 2004 except for that of 1968, when Hubert Humphrey won the county by 3.2 percentage points but lost to Richard M. Nixon. As a result of the urban sprawl from Phoenix spreading into the county, a major political reversal has taken place between it and neighboring Maricopa County since the turn of the millennium. Pinal voters now trend more Republican than traditionally conservative Maricopa County, and it has become a safely Republican county. Donald Trump carried the county by the second-largest margin for a Republican since statehood.
| Year | Republican | Democratic | Others |
|---|---|---|---|
| 2020 | 57.7% 107,077 | 40.5% 75,106 | 1.8% 3,342 |
| 2016 | 56.2% 72,819 | 37.0% 47,892 | 6.8% 8,835 |
| 2012 | 57.1% 62,079 | 40.8% 44,306 | 2.1% 2,297 |
| 2008 | 56.4% 59,421 | 42.0% 44,254 | 1.6% 1,723 |
| 2004 | 57.3% 37,006 | 42.2% 27,252 | 0.6% 364 |
| 2000 | 48.7% 20,122 | 47.6% 19,650 | 3.7% 1,518 |
| 1996 | 35.3% 13,034 | 53.1% 19,579 | 11.6% 4,282 |
| 1992 | 31.8% 11,669 | 42.1% 15,468 | 26.1% 9,602 |
| 1988 | 51.3% 14,966 | 47.5% 13,850 | 1.3% 364 |
| 1984 | 57.5% 16,464 | 41.7% 11,923 | 0.8% 232 |
| 1980 | 52.4% 12,195 | 39.6% 9,207 | 8.0% 1,856 |
| 1976 | 45.4% 9,354 | 51.4% 10,595 | 3.2% 655 |
| 1972 | 60.3% 10,584 | 36.5% 6,404 | 3.3% 571 |
| 1968 | 42.4% 6,883 | 45.6% 7,409 | 12.0% 1,954 |
| 1964 | 41.2% 6,956 | 58.7% 9,911 | 0.0% 5 |
| 1960 | 47.1% 6,441 | 52.9% 7,232 | 0.1% 11 |
| 1956 | 53.2% 5,762 | 46.7% 5,063 | 0.2% 17 |
| 1952 | 52.4% 4,985 | 47.6% 4,522 | |
| 1948 | 37.9% 2,232 | 60.7% 3,572 | 1.4% 83 |
| 1944 | 38.5% 1,909 | 61.0% 3,026 | 0.4% 22 |
| 1940 | 31.1% 1,996 | 68.6% 4,411 | 0.3% 22 |
| 1936 | 25.0% 1,216 | 71.9% 3,498 | 3.2% 154 |
| 1932 | 23.9% 1,000 | 75.0% 3,137 | 1.1% 47 |
| 1928 | 53.4% 1,631 | 46.5% 1,419 | 0.1% 4 |
| 1924 | 40.9% 1,075 | 37.6% 988 | 21.6% 568 |
| 1920 | 54.2% 1,493 | 45.9% 1,264 | |
| 1916 | 39.2% 855 | 56.5% 1,232 | 4.2% 92 |
| 1912 | 9.9% 80 | 43.7% 352 | 46.3% 373 |
Government
Salaries for county elected officials are set by the Arizona Revised Statutes. All county elected officials except the Sheriff (Mark Lamb as of 2017) and the County Attorney make a salary of $63,800, along with county benefits and compulsory participation in the Arizona State Elected Official Retirement Plan.[19]
Economy
The Corrections Corporation of America operated the privately owned Saguaro Correctional Center.[20] located in Eloy in Pinal County,[21] It is paid by the state of Hawaii to house the majority of Hawaii's male prison inmate population.[20]
Communities
Cities
- Apache Junction (partially in Maricopa County)
- Casa Grande
- Coolidge
- Eloy
- Maricopa
Towns
- Florence (county seat)
- Kearny
- Mammoth
- Marana (mostly in Pima County)
- Queen Creek (partially in Maricopa County)
- Superior
- Winkelman (partially in Gila County)
Ghost towns
Census-designated places
- Ak-Chin Village
- Arizona City
- Blackwater
- Cactus Forest
- Campo Bonito
- Casa Blanca
- Chuichu
- Dudleyville
- Gold Canyon
- Goodyear Village
- Kohatk
- Lower Santan Village
- Oracle
- Picacho
- Queen Valley
- Red Rock
- Sacate Village
- Sacaton
- Sacaton Flats Village
- Saddlebrooke
- San Manuel
- Santa Cruz
- San Tan Valley
- Stanfield
- Stotonic Village
- Sweet Water Village
- Tat Momoli
- Top-of-the-World (partially in Gila County)
- Upper Santan Village
- Vaiva Vo
- Wet Camp Village
Other unincorporated communities
County population ranking
The population ranking of the following table is based on the 2010 census of Pinal County.[22][23]
† county seat
| Rank | City/Town/etc. | Population (2010 Census) | Municipal type | Incorporated |
|---|---|---|---|---|
| 1 | San Tan Valley | 81,321 | CDP | |
| 2 | Casa Grande | 48,751 | City | 1879 (founded) |
| 3 | Maricopa | 43,482 | City | 2003 |
| 4 | Apache Junction (partially in Maricopa County) | 35,840 | City | 1978 |
| 5 | Marana (mostly in Pima County) | 34,961 | Town | 1977 |
| 6 | Queen Creek (partially in Maricopa County) | 26,361 | Town | 1990 |
| 7 | † Florence | 25,536 | Town | 1900[24] |
| 8 | Eloy | 16,631 | City | 1949 |
| 9 | Coolidge | 11,825 | City | 1945 |
| 10 | Arizona City | 10,475 | CDP | |
| 11 | Gold Canyon | 10,159 | CDP | |
| 12 | Saddlebrooke | 9,614 | CDP | |
| 13 | Oracle | 3,686 | CDP | |
| 14 | San Manuel | 3,551 | CDP | |
| 15 | Superior | 2,837 | Town | 1976 |
| 16 | Sacaton | 2,672 | CDP | |
| 17 | Red Rock | 2,169 | CDP | |
| 18 | Kearny | 1,950 | Town | 1959 |
| 19 | Mammoth | 1,426 | Town | 1958 |
| 20 | Casa Blanca | 1,388 | CDP | |
| 21 | Dudleyville | 959 | CDP | |
| 22 | Ak-Chin Village | 862 | CDP | |
| 23 | Queen Valley | 788 | CDP | |
| 24 | Stanfield | 740 | CDP | |
| 25 | Blackwater | 725 | CDP | |
| 26 | Stotonic Village | 659 | CDP | |
| 27 | Cactus Forest | 594 | CDP | |
| 28 | Sacaton Flats Village | 541 | CDP | |
| 29 | Upper Santan Village | 495 | CDP | |
| 30 | Goodyear Village | 457 | CDP | |
| 31 | Lower Santan Village | 374 | CDP | |
| 32 | Winkelman (partially in Gila County) | 353 | Town | |
| 33 | Chuichu | 269 | CDP | |
| 34 | Top-of-the-World (partially in Gila County) | 231 | CDP | |
| 35 | Wet Camp Village | 229 | CDP | |
| 36 | Sacate Village | 169 | CDP | |
| 37 | Vaiva Vo | 128 | CDP | |
| 38 | Sweet Water Village | 83 | CDP | |
| 39 | Campo Bonito | 74 | CDP | |
| 40 | Santa Cruz | 37 | CDP | |
| 41 | Kohatk | 27 | CDP | |
| 42 | Tat Momoli | 10 | CDP |
References
- "U.S. Census website". United States Census Bureau. Retrieved 2019-01-31.
- Granger, Byrd Howell (1983). Arizona's Names (X Marks the Place). Tucson, AZ: The Falconer Publishing Company. p. 483. ISBN 0918080185.
- "PopulationDistributionandChange:2000to2010" (PDF). UnitedStatesCensusBureau. March 2011. p. 9. Retrieved March 26, 2011.
- "Fastest Growing U.S. Counties". CNN Money. June 21, 2010. Retrieved March 30, 2014.
- "2010 Census Gazetteer Files". United States Census Bureau. August 23, 2012. Retrieved August 23, 2015.
- "Population and Housing Unit Estimates". Retrieved May 10, 2019.
- "U.S. Decennial Census". United States Census Bureau. Retrieved May 18, 2014.
- "Historical Census Browser". University of Virginia Library. Retrieved May 18, 2014.
- "Population of Counties by Decennial Census: 1900 to 1990". United States Census Bureau. Retrieved May 18, 2014.
- "Census 2000 PHC-T-4. Ranking Tables for Counties: 1990 and 2000" (PDF). United States Census Bureau. Retrieved May 18, 2014.
- "State & County QuickFacts". United States Census Bureau. Archived from the original on December 4, 2015. Retrieved May 18, 2014.
- "Language Map Data Center". Mla.org. July 17, 2007. Retrieved August 17, 2012.
- "DP-1 Profile of General Population and Housing Characteristics: 2010 Demographic Profile Data". United States Census Bureau. Archived from the original on 2020-02-13. Retrieved 2016-01-20.
- "Population, Housing Units, Area, and Density: 2010 - County". United States Census Bureau. Archived from the original on 2020-02-13. Retrieved 2016-01-20.
- "DP02 SELECTED SOCIAL CHARACTERISTICS IN THE UNITED STATES – 2006-2010 American Community Survey 5-Year Estimates". United States Census Bureau. Archived from the original on 2020-02-13. Retrieved 2016-01-20.
- "DP03 SELECTED ECONOMIC CHARACTERISTICS – 2006-2010 American Community Survey 5-Year Estimates". United States Census Bureau. Archived from the original on 2020-02-13. Retrieved 2016-01-20.
- Leip, David. "Dave Leip's Atlas of U.S. Presidential Elections". uselectionatlas.org. Retrieved 2018-06-12.
- Scammon, Richard M. (compiler); America at the Polls: A Handbook of Presidential Election Statistics 1920-1964; pp. 42-44 ISBN 0405077114
- "Arizona Revised Statutes". Azleg.gov. Retrieved 2012-08-17.
- Brady, Kat. "Using private prisons costs more than it seems." (editorial) Honolulu Star Advertiser. June 18, 2010. Retrieved on September 29, 2010.
- "Saguaro Correctional Center Archived 2010-09-25 at the Wayback Machine." Corrections Corporation of America. Retrieved on September 30, 2010.
- https://www.census.gov/2010census/
- https://www.census.gov/geo/maps-data/maps/block/2010/
- http://www.leagueaz.org/lgd/index.cfm?area=main&cid=25
External links
| Wikimedia Commons has media related to Pinal County, Arizona. |
 Geographic data related to Pinal County, Arizona at OpenStreetMap
- Official website
- Pinal County Official Employment Site
- Casa Grande Valley Newspapers Inc.
- Pinal County Chamber
Places adjacent to Pinal County, Arizona | ||||||||||
|---|---|---|---|---|---|---|---|---|---|---|
| ||||||||||
| Authority control |
|---|