Maricopa County, Arizona
Maricopa County is located in the south-central part of the U.S. state of Arizona. The U.S. Census Bureau estimated its population was 4,485,414 as of 2019, making it the state's most populous county, and the fourth-most populous in the United States, containing about 62% of Arizona's population. The county seat is Phoenix,[2] the state capital and fifth-most populous city in the United States.
Maricopa County | |
|---|---|
| County of Maricopa[1] | |
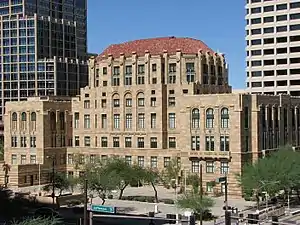 The Maricopa County Courthouse and Old Phoenix City Hall, also known as the County-City Administration Building, in 2013 | |
 Flag  Seal | |
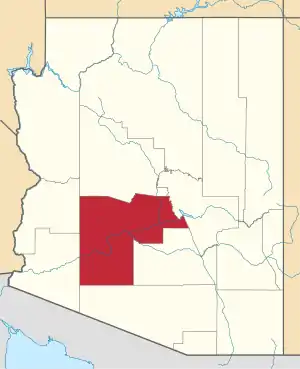 Location within the U.S. state of Arizona | |
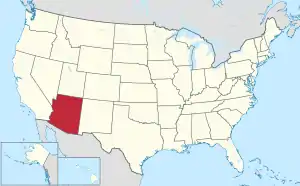 Arizona's location within the U.S. | |
| Coordinates: 33°30′50″N 112°28′33″W | |
| Country | |
| State | |
| Founded | February 14, 1871 |
| Named for | Maricopa people |
| Seat | Phoenix |
| Largest city | Phoenix |
| Area | |
| • Total | 9,224 sq mi (23,890 km2) |
| • Land | 9,200 sq mi (24,000 km2) |
| • Water | 24 sq mi (60 km2) 0.3% |
| Population (2010) | |
| • Total | 3,817,117 |
| • Estimate (2019) | 4,485,414 |
| • Density | 410/sq mi (160/km2) |
| Time zone | UTC−7 (Mountain) |
| Congressional districts | 1st, 3rd, 4th, 5th, 6th, 7th, 8th, 9th |
| Website | www |
Maricopa County is the central county of the Phoenix-Mesa-Chandler, AZ Metropolitan Statistical Area. The Office of Management and Budget renamed the metropolitan area in September 2018. Previously, it was the Phoenix-Mesa-Glendale metropolitan area, and in 2000, that was changed to Phoenix-Mesa-Scottsdale.
Maricopa County was named after the Maricopa Native Americans.[3] There are five Native American Reservations located in the county.[4] The largest are the Salt River Pima-Maricopa Indian Community (east of Scottsdale) and the Gila River Indian Community (south of Chandler).
Geography
According to the U.S. Census Bureau, the county has a total area of 9,224 square miles (23,890 km2), of which 9,200 square miles (24,000 km2) is land and 24 square miles (62 km2) (0.3%) is water.[5] Maricopa County is one of the largest counties in the United States by area, with a land area greater than that of four other US states. From west to east, it stretches 132 miles (212 km) and 103 miles (166 km) from north to south.[6] It is by far Arizona's most populous county, encompassing well over half of the state's residents. It is the largest county in the United States to have a capital city.
Adjacent counties
- La Paz County – west
- Yuma County – west
- Pima County – south
- Pinal County – southeast
- Gila County – east
- Yavapai County – north
National protected areas
- Sonoran Desert National Monument (part)
- Tonto National Forest (part)
Demographics
| Historical population | |||
|---|---|---|---|
| Census | Pop. | %± | |
| 1880 | 5,689 | — | |
| 1890 | 10,986 | 93.1% | |
| 1900 | 20,457 | 86.2% | |
| 1910 | 34,488 | 68.6% | |
| 1920 | 89,576 | 159.7% | |
| 1930 | 150,970 | 68.5% | |
| 1940 | 186,193 | 23.3% | |
| 1950 | 331,770 | 78.2% | |
| 1960 | 663,510 | 100.0% | |
| 1970 | 971,228 | 46.4% | |
| 1980 | 1,509,175 | 55.4% | |
| 1990 | 2,122,101 | 40.6% | |
| 2000 | 3,072,149 | 44.8% | |
| 2010 | 3,817,117 | 24.2% | |
| 2019 (est.) | 4,485,414 | [9] | 17.5% |
| U.S. Decennial Census[10] 1790–1960[11] 1900–1990[12] 1990–2000[13] 2010–2018[14] | |||
2000 census
As of the census of 2000, there were 3,072,149 people, 1,132,886 households, and 763,565 families living in the county. The population density was 334 people per square mile (129/km2). There were 1,250,231 housing units at an average density of 136/sq mi (52/km2). The racial makeup of the county was 77.4% White, 3.7% African American, 1.9% Native American, 2.2% Asian, 0.1% Pacific Islander, 11.9% from other races, and 2.9% from two or more races. 29.5% of the population were Hispanic or Latino of any race. 19.1% reported speaking Spanish at home.[15]
There were 1,132,886 households, out of which 33.0% had children under the age of 18 living with them, 51.6% were married couples living together, 10.7% had a female householder with no husband present, and 32.6% were non-families. 24.5% of all households were made up of individuals, and 7.9% had someone living alone who was 65 years of age or older. The average household size was 2.67 and the average family size was 3.21.
The population was spread out, with 27.0% under the age of 18, 10.2% from 18 to 24, 31.4% from 25 to 44, 19.80% from 45 to 64, and 11.7% who were 65 years of age or older. The median age was 33 years. For every 100 females, there were 100.10 males. For every 100 females age 18 and over, there were 98.10 males.
The median income for a household in the county was $45,358, and the median income for a family was $51,827. Males had a median income of $36,858 versus $28,703 for females. The per capita income for the county was $22,251. About 8.0% of families and 11.7% of the population were below the poverty line, including 15.4% of those under age 18 and 7.4% of those age 65 or over.
2010 census
As of the 2010 census, there were 3,817,117 people, 1,411,583 households, and 932,814 families living in the county.[16] The population density was 414.9 inhabitants per square mile (160.2/km2). There were 1,639,279 housing units at an average density of 178.2 per square mile (68.8/km2).[17] The racial makeup of the county was 73.0% white (58.7% non-Hispanic white), 5.0% black or African American, 3.5% Asian, 2.1% American Indian, 0.2% Pacific islander, 12.8% from other races, and 3.5% from two or more races. Those of Hispanic or Latino origin made up 29.6% of the population.[16] The largest ancestry groups were:[18]
Of the 1,411,583 households, 35.1% had children under the age of 18 living with them, 47.8% were married couples living together, 12.4% had a female householder with no husband present, 33.9% were non-families, and 25.9% of all households were made up of individuals. The average household size was 2.67 and the average family size was 3.25. The median age was 34.6 years.[16]
The median income for a household in the county was $55,054 and the median income for a family was $65,438. Males had a median income of $45,799 versus $37,601 for females. The per capita income for the county was $27,816. About 10.0% of families and 13.9% of the population were below the poverty line, including 19.8% of those under age 18 and 7.0% of those age 65 or over.[19]
According to data provided by the United States Census Bureau in October 2015 and collected from 2009 to 2013, 73.72% of the population aged five years and over spoke only English at home, while 20.32% spoke Spanish, 0.56% spoke Chinese, 0.47% Vietnamese, 0.41% Tagalog, 0.37% Arabic, 0.36% German, 0.30% French, 0.25% Navajo, 0.21% Korean, 0.20% Hindi, 0.15% Italian, 0.14% Persian, 0.13% Russian, 0.13% Serbo-Croatian, 0.12% Telugu, 0.12% Polish, 0.11% Syriac, 0.11% Japanese, 0.11% spoke Romanian, and 0.10% spoke other Native North American languages at home.[20]
Religion
In 2010 statistics, the largest religious group in Maricopa County was the Diocese of Phoenix, with 519,950 Catholics worshipping at 99 parishes, followed by 242,732 LDS Mormons with 503 congregations, 213,640 non-denominational adherents with 309 congregations, 93,252 AG Pentecostals with 120 congregations, 73,207 SBC Baptists with 149 congregations, 35,804 Christian churches and churches of Christ Christians with 29 congregations, 30,014 ELCA Lutherans with 47 congregations, 28,634 UMC Methodists with 55 congregations, 18,408 LCMS Lutherans with 34 congregations, and 15,001 PC-USA Presbyterians with 42 congregations. Altogether, 39.1% of the population was claimed as members by religious congregations, although members of historically African-American denominations were underrepresented due to incomplete information.[21] In 2014, the county had 1,177 religious organizations, the fifth most out of all US counties.[22]
Government, policing, and politics
Government
The governing body of Maricopa County is its Board of Supervisors. The Maricopa County Board of Supervisors consists of five members chosen by popular vote within their own districts. Currently, the Board consists of four Republicans and one Democrat. Each member serves a four-year term, with no term limits.
Maricopa County sheriff
The Maricopa County Sheriff's Office provides court protection, administers the county jail, and patrols the unincorporated areas of the county plus incorporated towns by contract.
Politics
Prior to 1960, Maricopa County voted for the winner in every election. However, for much of the time after World War II, Maricopa County was one of the more conservative urban counties in the United States. While the city of Phoenix has leaned Democratic in recent years, most of the rest of the county was strongly Republican. Until 2020, every Republican presidential candidate since 1952 had carried Maricopa County. This includes the 1964 presidential run of native son Barry Goldwater, who would not have carried his own state had it not been for a 21,000-vote margin in Maricopa County. Until 2020, it was the largest county in the country to vote Republican. Since 1964, Democrats have held the margin within single digits only four times–in 1992, 1996, 2016, and 2020. In 2020, Joe Biden became the first Democrat in 72 years to win the county, which in turn, resulted in Arizona flipping to the Democratic column for the first time since 1996.[23] Furthermore, Biden became the first presidential candidate to win more than one million votes in the county. This makes Maricopa County the third county in American history to cast more than one million votes for a presidential candidate.
Despite its consistent Republican allegiance since 1952, its fast-growing Hispanic population and influx of conservatives retirees and Mormons, which were traditionally conservative voting blocs but were increasingly skeptical of President Donald Trump, signaled that it was a crucial bellwether in the 2020 election.[24]
| Voter Registration as of October 2020[25] | |||||
|---|---|---|---|---|---|
| Party | Number of voters | Percentage | |||
| Republican | 915,227 | 35.27% | |||
| Other/Independents | 840,677 | 32.39% | |||
| Democratic | 814,343 | 31.38% | |||
| Libertarian Party | 25,025 | 0.96% | |||
| Total | 2,595,272 | 100% | |||
| Year | Republican | Democratic | Others |
|---|---|---|---|
| 2020 | 47.9% 995,665 | 50.1% 1,040,774 | 1.9% 39,647 |
| 2016 | 47.7% 747,361 | 44.8% 702,907 | 7.5% 117,566 |
| 2012 | 54.3% 749,885 | 43.6% 602,288 | 2.1% 28,786 |
| 2008 | 54.4% 746,448 | 43.9% 602,166 | 1.7% 22,756 |
| 2004 | 56.9% 679,455 | 42.3% 504,849 | 0.9% 10,657 |
| 2000 | 53.2% 479,967 | 42.9% 386,683 | 3.9% 35,049 |
| 1996 | 47.2% 386,015 | 44.5% 363,991 | 8.2% 67,426 |
| 1992 | 41.1% 360,049 | 32.6% 285,457 | 26.4% 231,326 |
| 1988 | 64.9% 442,337 | 33.9% 230,952 | 1.2% 8,229 |
| 1984 | 72.0% 411,902 | 27.1% 154,833 | 1.0% 5,538 |
| 1980 | 65.0% 316,287 | 24.6% 119,752 | 10.4% 50,795 |
| 1976 | 61.7% 258,262 | 34.5% 144,613 | 3.8% 15,966 |
| 1972 | 69.3% 244,593 | 27.0% 95,135 | 3.8% 13,272 |
| 1968 | 59.1% 162,262 | 31.4% 86,204 | 9.5% 26,185 |
| 1964 | 53.9% 143,114 | 46.0% 122,042 | 0.1% 170 |
| 1960 | 59.4% 127,090 | 40.6% 86,834 | 0.1% 135 |
| 1956 | 63.0% 92,140 | 36.9% 54,010 | 0.1% 191 |
| 1952 | 60.6% 77,249 | 39.4% 50,285 | |
| 1948 | 46.3% 36,585 | 51.3% 40,498 | 2.4% 1,909 |
| 1944 | 43.4% 24,853 | 56.2% 32,197 | 0.4% 208 |
| 1940 | 38.9% 22,610 | 60.4% 35,055 | 0.7% 414 |
| 1936 | 28.7% 13,671 | 67.3% 32,031 | 4.0% 1,908 |
| 1932 | 34.1% 15,086 | 64.6% 28,601 | 1.3% 593 |
| 1928 | 62.3% 20,089 | 37.6% 12,146 | 0.1% 34 |
| 1924 | 44.7% 10,611 | 38.6% 9,177 | 16.7% 3,970 |
| 1920 | 56.2% 11,336 | 43.8% 8,825 | |
| 1916 | 39.3% 5,747 | 52.1% 7,634 | 8.6% 1,259 |
| 1912 | 11.3% 642 | 46.0% 2,606 | 42.7% 2,421 |
Despite its political leanings at the time, Maricopa County voted against Proposition 107 in the 2006 election. This referendum, designed to ban gay marriage and restrict domestic partner benefits, was rejected by a 51.6–48.4% margin within the county, and statewide by a similar margin. Two years later, however, a majority of county residents voted to pass a successful state constitutional amendment banning same-sex marriage. The amendment was later invalidated by the Supreme Court's 2015 ruling in Obergefell v. Hodges, which declared that same-sex marriage is a fundamental right in the United States.
Unlike cities and towns in Arizona, counties are politically and legally subordinate to the state and do not have charters of their own. The county Board of Supervisors acts under powers delegated by state law, mainly related to minor ordinances and revenue collection. With few exceptions, these powers are narrowly construed. The state legislature devotes considerable time to local matters, with legislative approval required for many routine local issues. The chairperson of the board presides for a one-year term, selected by the board members during a public hearing.
The County Sheriff, County Attorney, County Assessor, County Treasurer, Superintendent of Schools, County Recorder, Constables, Justices of the Peace, and Clerk of the Superior Court are elected by the people. Retention of Superior Court Judges is also determined by popular vote.
The county's dominant political figure for over two decades (from 1993 to 2017) was Sheriff Joe Arpaio, who called himself "America's Toughest Sheriff" and gained national notoriety for his flamboyant and often controversial practices and policies.[27]
Maricopa County is home to 62 percent of the state's population, thus dominating Arizona's politics. For example, in the 2018 Senate election, Democrat Kyrsten Sinema carried the county en route to becoming the first Democrat to win a Senate seat in Arizona since 1988.[28] She won the county by over 60,000 votes, more than enough for the victory; she won statewide by 55,900 votes.[29] All but one of the state's nine congressional districts include part of the county, and five of the districts have their population center located there. Most of the state's prominent elected officials live in the county. Further underlining Maricopa County's political dominance, Biden's margin of 45,109 votes was more than enough to carry the state; he only won Arizona by 10,457 votes.
United States Congress
| District | Name | Party | First elected [lower-alpha 1] | Area(s) represented | |
|---|---|---|---|---|---|
| United States Senate | |||||
| Class I Senator | Kyrsten Sinema | Democratic | 2018 | At Large | |
| Class III Senator | Mark Kelly | Democrat | 2020 | ||
| United States House of Representatives | |||||
| 1 | Tom O'Halleran | Democratic | 2016 | Casa Grande, Flagstaff, Sedona | |
| 2 | Ann Kirkpatrick | Democratic | 2019 | Benson, Sierra Vista, Tucson | |
| 3 | Raul Grijalva | Democratic | 2002 | Buckeye, Gila Bend, Nogales | |
| 4 | Paul Gosar | Republican | 2010 | Lake Havasu City, Prescott, Yuma | |
| 5 | Andy Biggs | Republican | 2016 | Gilbert, Mesa, Queen Creek | |
| 6 | David Schweikert | Republican | 2010 | Fountain Hills, Phoenix, Scottsdale | |
| 7 | Ruben Gallego | Democratic | 2014 | Glendale, Phoenix | |
| 8 | Debbie Lesko | Republican | 2018 | Glendale, Peoria, Surprise | |
| 9 | Greg Stanton | Democratic | 2018 | Chandler, Mesa, Tempe | |
- Due to redistricting in 2002 and again in 2012, many of the Representatives listed were first elected to a district other than the one they currently represent.
Board of Supervisors
Elected county officials
| Party | Office | Name | First elected | Reference | |
|---|---|---|---|---|---|
| Republican | Assessor | Eddie Cook | 2020† | [30] | |
| Republican | Clerk of the Superior Court | Jeff Fine | 2018† | [31] | |
| Republican | County Attorney | Allister Adel | 2020† | [32] | |
| Republican | County Recorder | Stephen Richer | 2020 | [33] | |
| Republican | County School Superintendent | Steve Watson | 2016 | [33] | |
| Democratic | Sheriff | Paul Penzone | 2016 | [33] | |
| Republican | Treasurer | Royce Flora | 2016 | [33] | |
†Member was originally appointed to the office.
Education
- Maricopa County Library District operates the county libraries in Maricopa County.
- The Maricopa County School Superintendent is charged with the general conduct and supervision of the public school system in Maricopa County. The Superintendent is one of six county-wide elected officials, elected by the voters of Maricopa County every four years. Since the inception of the office, there have been thirteen Maricopa County School Superintendents. The incumbent, Steve Watson, took office January 1, 2017.
Transportation
Major highways
Air
The major primary commercial airport of the county is Sky Harbor International Airport (PHX).
Other airports located in the county include:
- Phoenix-Mesa Gateway Airport in Mesa (AZA)
- Scottsdale Municipal Airport in Scottsdale (SCF)
- Deer Valley Airport in Deer Valley Village in Phoenix (DVT)
- Chandler Municipal Airport in Chandler (CHD)
- Phoenix Goodyear Airport in Goodyear (GYR)
- Glendale Municipal Airport in Glendale (GEU)
- Buckeye Municipal Airport in Buckeye (BXK)
- Falcon Field (Arizona) in Mesa (MSC)
- Gila Bend Municipal Airport in Gila Bend (E63)
- Wickenburg Municipal Airport in Wickenburg (E25)
Rail
In terms of freight rail, the Union Pacific Railroad and the Burlington Northern Santa Fe Railroad serve the county.
In terms of passenger rail, greater Phoenix is served by a light rail system. The county has no other passenger rail transport as Amtrak's Sunset Limited, which served Phoenix until June 2, 1996, has its closest stop in Maricopa in neighboring Pinal County. The train connects Maricopa to Tucson, Los Angeles, and New Orleans three times a week. However it does not stop in Phoenix itself.
Communities
Cities
- Avondale
- Buckeye
- Chandler
- El Mirage
- Glendale
- Goodyear
- Litchfield Park
- Mesa
- Peoria (partly in Yavapai County)
- Phoenix (county seat)
- Scottsdale
- Surprise
- Tempe
- Tolleson
Towns
- Carefree
- Cave Creek
- Fountain Hills
- Gila Bend
- Gilbert
- Guadalupe
- Paradise Valley
- Queen Creek (partly in Pinal County)
- Wickenburg (partly in Yavapai County)
- Youngtown
Ghost towns
- Agua Caliente
- Alma
- Angel Camp
- Marinette
- Nothing
- Vulture City
Census-designated places
Unincorporated communities
Native American communities
County population ranking
The population ranking of the following table is based on the 2010 census of Maricopa County.[34][35]
† county seat
| Rank | City/Town/etc. | Population (2010 Census) | Population (2017 Estimate) | Municipal type | Incorporated |
|---|---|---|---|---|---|
| 1 | Phoenix † | 1,445,632 | 1,626,078 | City | 1881 |
| 2 | Mesa | 439,041 | 496,401 | City | 1878 (founded) |
| 3 | Chandler | 236,123 | 253,458 | City | 1920 |
| 4 | Scottsdale | 217,385 | 249,950 | City | 1951 |
| 5 | Glendale | 226,721 | 246,709 | City | 1910 |
| 6 | Gilbert | 208,453 | 242,354 | Town | 1920 |
| 7 | Tempe | 161,719 | 185,038 | City | 1894 |
| 8 | Peoria (partially in Yavapai County) | 154,065 | 168,181 | City | 1954 |
| 9 | Surprise | 117,517 | 134,085 | City | 1960 |
| 10 | Avondale | 76,238 | 84,025 | City | 1946 |
| 11 | Goodyear | 65,275 | 79,858 | City | 1946 |
| 12 | Buckeye | 50,876 | 68,453 | City | 1929 |
| 13 | Queen Creek (partially in Pinal County) | 26,361 | 39,184 | Town | 1990 |
| 14 | Sun City | 37,499 | -- | CDP | |
| 15 | El Mirage | 31,797 | 35,216 | City | 1951 |
| 16 | Sun City West | 24,535 | -- | CDP | |
| 17 | Fountain Hills | 22,489 | 24,583 | Town | 1989 |
| 18 | Anthem | 21,700 | -- | CDP | |
| 19 | New River | 14,952 | -- | CDP | |
| 20 | Paradise Valley | 12,820 | 14,293 | Town | 1961 |
| 21 | Sun Lakes | 13,975 | -- | CDP | |
| 22 | Wickenburg | 6,363 | 7,409 | Town | 1909 |
| 23 | Tolleson | 6,545 | 7,205 | City | 1929 |
| 24 | Youngtown | 6,156 | 6,760 | Town | 1960 |
| 25 | Guadalupe | 5,523 | 6,525 | Town | 1975 |
| 26 | Litchfield Park | 5,476 | 6,009 | City | 1987 |
| 27 | Cave Creek | 5,015 | 5,622 | Town | 1986 |
| 28 | Citrus Park | 4,028 | -- | CDP | |
| 29 | Carefree | 3,363 | 3,783 | Town | 1984 |
| 30 | Gila Bend | 1,922 | 2,069 | Town | 1962 |
| 31 | Rio Verde | 1,811 | -- | CDP | |
| 32 | Komatke | 821 | -- | CDP | |
| 33 | Aguila | 798 | -- | CDP | |
| 34 | Wittmann | 763 | -- | CDP | |
| 35 | Maricopa Colony | 709 | -- | CDP | |
| 36 | Gila Crossing | 621 | -- | CDP | |
| 37 | St. Johns | 476 | -- | CDP | |
| 38 | Morristown | 227 | -- | CDP | |
| 39 | Arlington | 194 | -- | CDP | |
| 40 | Theba | 158 | -- | CDP | |
| 41 | Kaka | 141 | -- | CDP | |
| 42 | Wintersburg | 136 | -- | CDP | |
| 43 | Tonopah | 60 | -- | CDP |
Climate
| ||||||||||||||||||||||||||||||||||||||||||||||||||||||||||||||||||||||||||||||||||||||||||||||||||||||||||||||||||||||||||||
See also
References
- http://search.maricopa.gov/search?entqr=0&ud=1&sort=date%3AD%3AL%3Ad1&output=xml_no_dtd&oe=UTF-8&ie=UTF-8&client=default_frontend&proxystylesheet=default_frontend&site=default_collection&q=%22county%20of%20maricopa%22
- "Find a County". National Association of Counties. Retrieved June 7, 2011.
- Gannett, Henry (1905). The Origin of Certain Place Names in the United States. U.S. Government Printing Office. p. 199.
- Indian Reservations in the Continental United States, Bureau of Indian Affairs on National Park Service website. Retrieved January 18, 2009.
- "2010 Census Gazetteer Files". United States Census Bureau. August 23, 2012. Retrieved August 23, 2015.
- "Quick Facts about Maricopa County". Maricopa County, Ariz. Retrieved June 21, 2018.
- "INCOME IN THE PAST 12 MONTHS (IN 2016 INFLATION-ADJUSTED DOLLARS)". American Fact Finder. US Census Bureau. Archived from the original on February 14, 2020. Retrieved March 21, 2018.
- "POVERTY STATUS IN THE PAST 12 MONTHS". American Fact Finder. US Census Bureau. Archived from the original on February 14, 2020. Retrieved March 21, 2018.
- "Population and Housing Unit Estimates". Retrieved March 28, 2020.
- "U.S. Decennial Census". United States Census Bureau. Retrieved May 18, 2014.
- "Historical Census Browser". University of Virginia Library. Retrieved May 18, 2014.
- "Population of Counties by Decennial Census: 1900 to 1990". United States Census Bureau. Retrieved May 18, 2014.
- "Census 2000 PHC-T-4. Ranking Tables for Counties: 1990 and 2000" (PDF). United States Census Bureau. Retrieved May 18, 2014.
- "State & County QuickFacts". United States Census Bureau. Archived from the original on June 30, 2011. Retrieved May 18, 2014.
- "Language Map Data Center". apps.mla.org.
- "DP-1 Profile of General Population and Housing Characteristics: 2010 Demographic Profile Data". United States Census Bureau. Archived from the original on February 13, 2020. Retrieved January 20, 2016.
- "Population, Housing Units, Area, and Density: 2010 – County". United States Census Bureau. Archived from the original on February 13, 2020. Retrieved January 20, 2016.
- "DP02 Selected Social Characteristics in the United States – 2006–2010 American Community Survey 5-Year Estimates". United States Census Bureau. Archived from the original on February 13, 2020. Retrieved January 20, 2016.
- "DP03 Selected Economic Characteristics – 2006–2010 American Community Survey 5-Year Estimates". United States Census Bureau. Archived from the original on February 13, 2020. Retrieved January 20, 2016.
- "Table 2. Detailed Languages Spoken at Home and Ability to Speak English for the Population 5 Years and Over for Maricopa County, AZ: 2009-2013". United States Census Bureau. Retrieved February 27, 2018.
- "County Membership Report Maricopa County (Arizona)". The Association of Religion Data Archives. 2010. Retrieved January 1, 2020.
- "Social Capital Variables Spreadsheet for 2014". PennState College of Agricultural Sciences, Northeast Regional Center for Rural Development. December 8, 2017. Retrieved December 30, 2019.
- Merica, Dan (November 13, 2020). "Biden carries Arizona, flipping a longtime Republican stronghold". CNN. Retrieved November 13, 2020.
The Democratic victory -- declared days after CNN projected Biden's win in the presidential race -- was anchored by Maricopa County, home to Phoenix and nearly 60% of all people in the state. Maricopa is the fastest-growing county in the country, transforming over the last two decades into a sprawling mass of metropolitan hubs, sun-scorched planned communities and bustling strip malls.
- Wasserman, David (October 6, 2020). "Opinion | The 10 Bellwether Counties That Show How Trump Is in Serious Trouble". The New York Times. ISSN 0362-4331. Retrieved January 18, 2021.
- "Voter Registration Statistics" (PDF). Arizona Secretary of State Elections Bureau. Retrieved October 28, 2020.
- Leip, David. "Dave Leip's Atlas of U.S. Presidential Elections". uselectionatlas.org. Retrieved June 12, 2018.
- Joseph M. Arpaio Archived June 12, 2010, at the Wayback Machine, Maricopa County Sheriff's Office, 2005. Retrieved December 12, 2007.
- Romero, Simon (November 13, 2018). "How Kyrsten Sinema Won Her Senate Seat and Pulled Off a Historic Arizona Triumph". The New York Times. ISSN 0362-4331. Retrieved August 1, 2019.
- "2018 Arizona Senate election results". CNN.
- "https://www.mcassessor.maricopa.gov/
- "Clerk of the Superior Court of Maricopa County". www.clerkofcourt.maricopa.gov. Retrieved March 23, 2018.
- http://recorder.maricopa.gov/electionarchives/2010/11-02-2010%20Final%20Summary%20Report.pdf
- http://recorder.maricopa.gov/electionarchives/2012/11-06-2012%20Final%20Summary%20Report.pdf
- Bureau, US Census. "Decennial Census by Decades". The United States Census Bureau.
- https://www.census.gov/geo/maps-data/maps/block/2010/
- "NASA Earth Observations Data Set Index". NASA. Retrieved January 30, 2016.
Further reading
- Maricopa County Sheriff's Office, Maricopa County Sheriff's Office History and Pictorial. Paducah, KY: Turner Publishing. Co., 2005.
External links
| Wikimedia Commons has media related to Maricopa County, Arizona. |
- Official website
 Geographic data related to Maricopa County, Arizona at OpenStreetMap
- Maricopa County Chamber of Commerce
Places adjacent to Maricopa County, Arizona | ||||||||||
|---|---|---|---|---|---|---|---|---|---|---|
| ||||||||||
Municipalities and communities of Maricopa County, Arizona, United States | ||
|---|---|---|
| Cities | | |
| Towns | ||
| CDPs | ||
| Populated places |
| |
| Indian reservations | ||
| Ghost towns/ former populated places | ||
| Footnotes | ‡This populated place also has portions in an adjacent county or counties | |
| ||
| Authority control |
|---|