San Juan de Urabá
San Juan de Urabá is a town and municipality in the Colombian department of Antioquia.
San Juan de Urabá | |
|---|---|
Municipality and town | |
 | |
.svg.png.webp) Flag  Seal | |
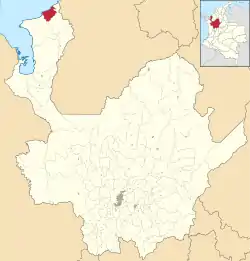 Location of the municipality and town of San Juan de Urabá in the Antioquia Department of Colombia | |
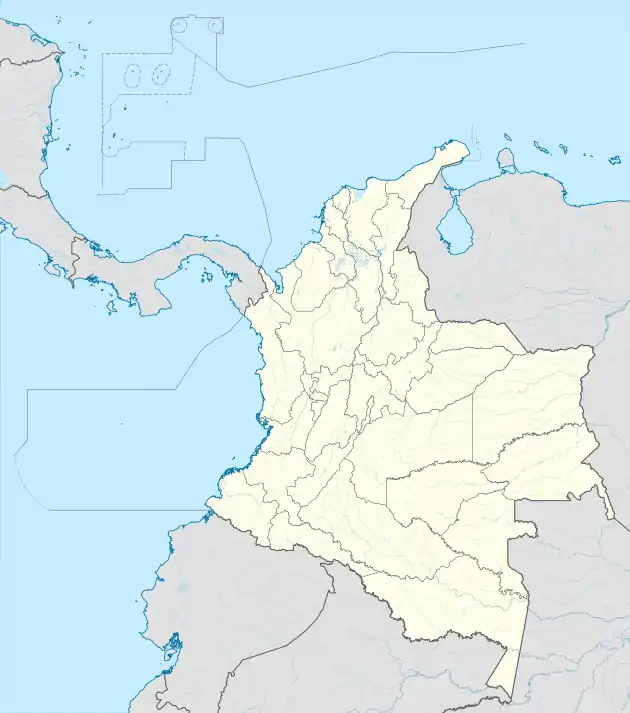 San Juan de Urabá Location in Colombia | |
| Coordinates: 8°46′0″N 76°32′0″W | |
| Country | |
| Department | |
| Subregion | Urabá |
| Population (Census 2018[1]) | |
| • Total | 19,992 |
| Time zone | UTC-5 (Colombia Standard Time) |
Climate
San Juan de Urabá has a tropical monsoon climate (Am) with moderate to little rainfall from December to March and heavy rainfall from April to November.
| Climate data for San Juan de Urabá | |||||||||||||
|---|---|---|---|---|---|---|---|---|---|---|---|---|---|
| Month | Jan | Feb | Mar | Apr | May | Jun | Jul | Aug | Sep | Oct | Nov | Dec | Year |
| Average high °C (°F) | 30.0 (86.0) |
30.0 (86.0) |
30.1 (86.2) |
31.3 (88.3) |
30.1 (86.2) |
30.3 (86.5) |
30.1 (86.2) |
30.0 (86.0) |
30.0 (86.0) |
30.1 (86.2) |
30.1 (86.2) |
30.4 (86.7) |
30.2 (86.4) |
| Daily mean °C (°F) | 26.6 (79.9) |
26.8 (80.2) |
27.1 (80.8) |
26.9 (80.4) |
26.6 (79.9) |
26.7 (80.1) |
26.5 (79.7) |
26.4 (79.5) |
26.4 (79.5) |
26.5 (79.7) |
26.6 (79.9) |
26.7 (80.1) |
26.7 (80.0) |
| Average low °C (°F) | 23.2 (73.8) |
23.7 (74.7) |
24.2 (75.6) |
23.6 (74.5) |
23.2 (73.8) |
23.1 (73.6) |
23.0 (73.4) |
22.9 (73.2) |
22.8 (73.0) |
22.9 (73.2) |
23.1 (73.6) |
23.0 (73.4) |
23.2 (73.8) |
| Average rainfall mm (inches) | 32.3 (1.27) |
34.2 (1.35) |
63.2 (2.49) |
161.4 (6.35) |
267.8 (10.54) |
242.3 (9.54) |
212.1 (8.35) |
281.7 (11.09) |
239.1 (9.41) |
239.5 (9.43) |
261.8 (10.31) |
128.8 (5.07) |
2,164.2 (85.2) |
| Average rainy days | 3 | 2 | 3 | 6 | 10 | 9 | 9 | 10 | 9 | 10 | 9 | 5 | 85 |
| Source 1: IDEAM[2] | |||||||||||||
| Source 2: Climate-Data.org[3] | |||||||||||||
References
- "Censo Nacional de Población y Vivienda 2018" (in Spanish). Retrieved 20 April 2020.
- "Data". www.ideam.gov.co. Retrieved 2020-08-25.
- "Climate: San Juan de Urabá". Climate-Data.org. Retrieved August 25, 2020.
Capital: Medellín | |||||||||||||||||||
| Regions and municipalities |
| ||||||||||||||||||
| Related topics | |||||||||||||||||||
This article is issued from Wikipedia. The text is licensed under Creative Commons - Attribution - Sharealike. Additional terms may apply for the media files.