Tropical cyclones in 2014
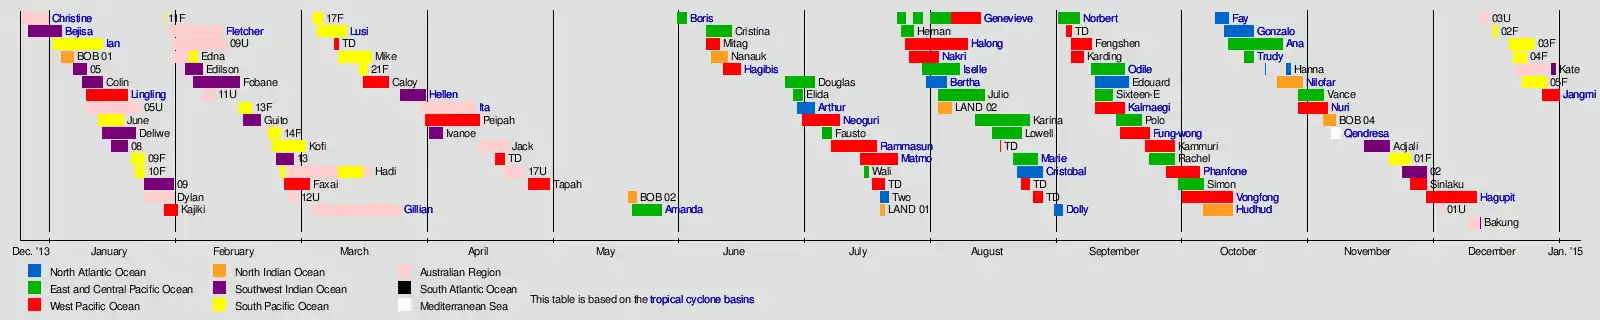
During 2014, tropical cyclones formed within seven different tropical cyclone basins, located within various parts of the Atlantic, Pacific and Indian Oceans. During the year, a total of 117 tropical cyclones had formed this year to date. 79 tropical cyclones had been named by either a Regional Specialized Meteorological Center (RSMC) or a Tropical Cyclone Warning Center (TCWC). The most active basin in 2014 was the Western Pacific, which documented 23 named systems, while the Eastern Pacific, despite only amounting to 22 named systems, was its basin's most active since 1992. Conversely, both the North Atlantic hurricane and North Indian Ocean cyclone seasons experienced the fewest cyclones reaching tropical storm intensity in recorded history, numbering 9 and 3, respectively. Activity across the southern hemisphere's three basins—South-West Indian, Australian, and South Pacific—was spread evenly, with each region recording seven named storms apiece.
| Tropical cyclones in 2014 | |
|---|---|
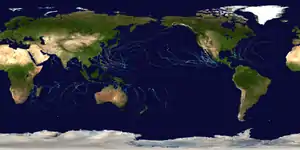 Year summary map | |
| Year boundaries | |
| First system | Ian |
| Formed | January 2, 2014 |
| Last system | Jangmi |
| Dissipated | January 1, 2015 |
| Strongest system | |
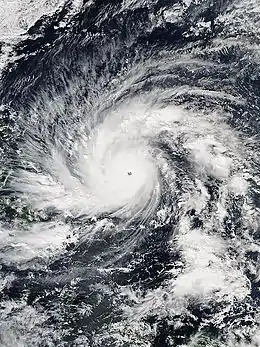
| Name | Vongfong |
| Lowest pressure | 900 mbar/hPa; 26.58 inHg |
| Longest lasting system | |
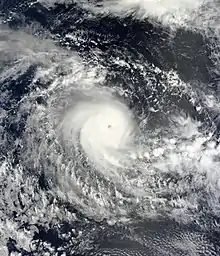
| Name | Gillian |
| Duration | 21 days |
| Year statistics | |
| Total systems | 117 |
| Named systems | 79 |
| Total fatalities | 870 total |
| Total damage | $19.68 billion (2014 USD) |
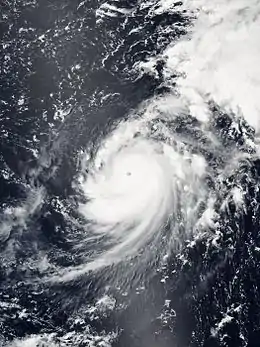
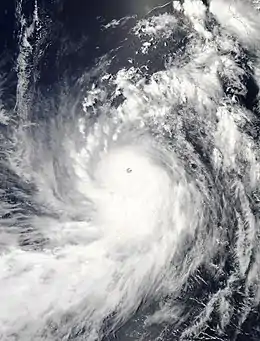
The strongest of these tropical cyclones was Typhoon Vongfong, which strengthened to a minimum barometric pressure of 900 mbar (hPa; 26.58 inHg) before striking the east coast of Japan. The costliest and deadliest tropical cyclone in 2014 was Typhoon Rammasun, which struck China in July, causing US$8.08 billion in damage. Rammasun killed 222 people; 106 in Philippines, 88 in China and 28 in Vietnam.
Global atmospheric and hydrological conditions
During January 2014, after surveying various climate models, the World Meteorological Organization warned that there was an enhanced possibility of a weak El Niño event happening during 2014.[1] Over the next few months the climate of the Pacific Ocean started to exhibit features that suggested the impending onset of an El Niño event.[2] Over the ocean, these features included: a rapid fall of the sea level in western Micronesia, as well as a large area of enhanced sea surface temperatures that were present at low latitudes near the International Date Line.[3] In the atmosphere these features included persistent westerly winds at equatorial latitudes, which were displaced eastwards towards the Marshall Islands.[3] A large area of atmospheric convection was present at a low latitude near the International Dateline, in association with the development of an unusual amount of early season tropical cyclones near the Marshall Islands.[3] As a result of some of these conditions, an El Niño Watch was issued by the United States Climate Prediction Center (NOAA's CPC) and the International Research Institute for Climate and Society within their March 2014 diagnostic discussion.[nb 1][5][6]
Over the next few months, the atmosphere failed to respond in order to reinforce the developing El Niño, with the monsoon trough remaining weak and tropical cyclone activity slowing, while no episodes of strong westerly winds at a low latitude occurred.[2] Some of the oceanic indicators of El Niño also failed to develop further, with a cooling of sea and sub surface temperatures over the tropical Pacific occurring.[2][7] However, by the end of 2014, several of the El Niño indexes that were used to judge the state of the ENSO state, indicated that weak El Nino conditions had developed over the Pacific Ocean.[8] As a result, a few of the international meteorological agencies, including the Japan Meteorological Agency and the Hong Kong Observatory reported that an El Niño event had developed during 2014, while others such as the Fiji Meteorological Service considered 2014 to be a near miss.[7][8][9] At this time it was thought that the ENSO state would continue to hover at the borderline El Nino conditions, before easing back into neutral ENSO conditions.[10]
Summary
Systems
A total of 114 systems formed globally in 2014 with 71 of them causing significant damage, deaths, and/or setting records for their basin.
January
The month of January was very active with 18 systems, starting with Ian bringing damages in Fiji and Tonga. Adding on, Lingling was the first disturbance in the West Pacific, affecting Philippines. Colin became the strongest tropical cyclone in the month of January this 2014, but it stayed well from land. 14 more disturbances formed on different basins, 6 are named by their respective meteorological agencies.
| Storm name | Dates active | Max wind km/h (mph) |
Pressure (hPa) |
Areas affected | Damage (USD) |
Deaths | Refs |
|---|---|---|---|---|---|---|---|
| Ian | January 2–15 | 205 (125) | 930 | Fiji, Tonga | $48 million | 1 | [11][12] |
| BOB 01 | January 4–7 | 40 (25) | 1004 | India, Sri Lanka | None | None | [13] |
| 05 | January 7–10 | 55 (35) | 997 | Madagascar | None | None | [14][15] |
| Colin | January 9–14 | 205 (125) | 915 | None | None | None | |
| Lingling (Agaton) | January 10–20 | 65 (40) | 1002 | Philippines | $12.6 million | 70 | [16] |
| 05U | January 10–23 | Northern Territory, Western Australia | None | None | |||
| June | January 13–19 | 75 (45) | 990 | Solomon Islands, New Caledonia, New Zealand | Minor | 1 | [17] |
| Deliwe | January 14–22 | 85 (50) | 990 | Madagascar, Mozambique | Unknown | 2 | [18] |
| 08 | January 16–20 | 35 (25) | 1004 | Madagascar | None | None | |
| 09F | January 21–24 | Not Specified | 1004 | Cook Islands, Niue, Tonga | None | None | |
| 10F | January 22–24 | Not Specified | 1004 | Solomon Islands, Vanuatu | None | None | |
| 09 | January 24–31 | 45 (30) | 1002 | Mozambique | None | None | |
| Dylan | January 24–31 | 110 (70) | 974 | Queensland | Minor | None | |
| Kajiki (Basyang) | January 29–February 1 | 65 (40) | 1000 | Philippines | $202 thousand | 6 | [19] |
| 11F | January 29 | Not Specified | 1000 | Fiji | None | None | |
| Fletcher | January 30–February 12 | 65 (40) | 992 | Western Australia, Northern Territory, Queensland | None | None | |
| Edna | January 31–February 6 | 95 (60) | 985 | New Caledonia, New Zealand, Queensland | None | None | |
| 09U | January 31–February 13 | 100 (65) | 982 | Western Australia, Northern Territory | None | None |
February
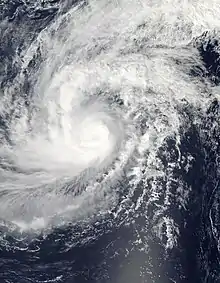
In the month of February, 11 systems formed, of which 6 were named. Typhoon Faxai became the strongest tropical cyclone of the month, affecting the Caroline Islands and the Mariana Islands. Edilson brought considerable damages and heavy rainfall to Mauritius and Réunion, and Guito did the same to Mozambique and Madagascar.
| Storm name | Dates active | Max wind km/h (mph) |
Pressure (hPa) |
Areas affected | Damage (USD) |
Deaths | Refs |
|---|---|---|---|---|---|---|---|
| Edilson | February 3–7 | 105 (65) | 978 | Mauritius, Réunion | None | None | |
| Fobane | February 5–16 | 110 (70) | 975 | None | None | None | |
| 11U | February 7–10 | Not Specified | 994 | Northern Territory | None | None | |
| 13F | February 16–19 | Not Specified | 1003 | Vanuatu, Fiji | None | None | |
| Guito | February 17–21 | 110 (70) | 980 | Mozambique, Madagascar | None | None | |
| 14F | February 23–26 | Not Specified | 1002 | Vanuatu, Fiji | None | None | |
| Kofi | February 24–March 4 | 100 (65) | 980 | Fiji, Tonga | None | None | |
| 13 | February 25–March 1 | 75 (45) | 993 | None | None | None | |
| Hadi | February 26–March 20 | 75 (45) | 992 | Solomon Islands, Vanuatu, Queensland | None | None | |
| Faxai | February 27–March 5 | 120 (75) | 975 | Caroline Islands, Mariana Islands | Minimal | 1 | |
| 12U | February 28–March 2 | Not Specified | Not Specified | None | None | None |
March
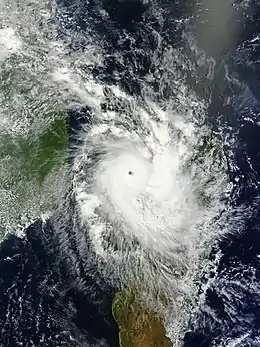
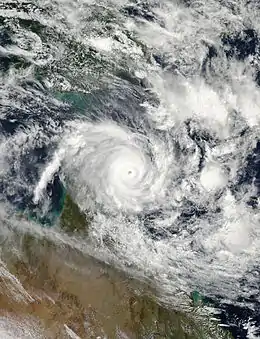
In the month of March, 8 systems formed, of which 5 were named. Cyclone Hellen was one of the most powerful tropical cyclones in the Mozambique Channel on record, as well as the most intense of the 2013–14 South-West Indian Ocean cyclone season: however, it made landfall on Madagascar with winds of 110 km/h (70 mph). In the Australian basin, Cyclone Gillian was the second most powerful cyclone of the 2013–14 Australian region cyclone season and the strongest in the basin in the last four years. 17F, Lusi, Mike, and 21F formed in the South Pacific basin while Caloy formed in the West Pacific basin near the Philippines.
| Storm name | Dates active | Max wind km/h (mph) |
Pressure (hPa) |
Areas affected | Damage (USD) |
Deaths | Refs |
|---|---|---|---|---|---|---|---|
| Gillian | March 6–27 | 220 (140) | 927 | Queensland, Northern Territory, East Timor, Indonesia, Christmas Island | Minimal | None | |
| 17F | March 6–8 | Not Specified | 1005 | Vanuatu | None | None | |
| Lusi | March 7–14 | 150 (90) | 960 | Vanuatu, Fiji, New Zealand | $3 million | 10 | |
| TD | March 11–12 | Not specified | 1008 | Sulawesi | None | None | |
| Mike | March 12–20 | 65 (40) | 990 | Cook Islands | Minimal | None | |
| 21F | March 17–19 | 45 (30) | 998 | Cook Islands | None | None | |
| Caloy | March 17–24 | Not specified | 1004 | Philippines | None | None | |
| Hellen | March 26–April 5 | 230 (145) | 915 | Mozambique, Comoro Islands, Madagascar | Unknown | 8 |
April
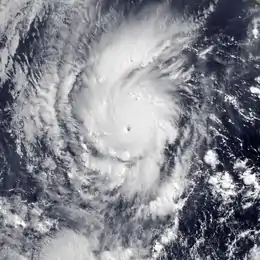
In the month of April, 7 systems formed, the second-least active month of this year; however, 5 storms were named. Severe Tropical Cyclone Ita was the strongest tropical cyclone in the Australian region by minimum central pressure since George in 2007, and since Monica in 2006 by wind speed. In the Australian basin, including Ita, 2 more systems formed: Jack and a weak 17U. Ivanoe formed in the South-West Indian Ocean basin, while Peipah (Domeng), a weak tropical depression, and Tapah existed in the West Pacific basin.
| Storm name | Dates active | Max wind km/h (mph) |
Pressure (hPa) |
Areas affected | Damage (USD) |
Deaths | Refs |
|---|---|---|---|---|---|---|---|
| Ita | April 1–14 | 220 (140) | 922 | Solomon Islands, Papua New Guinea, Queensland, New Zealand | $1.15 billion | 22 | |
| Peipah (Domeng) | April 2–15 | 65 (40) | 998 | Caroline Islands | None | None | |
| Ivanoe | April 3–6 | 85 (50) | 987 | None | None | None | |
| Jack | April 15–22 | 140 (85) | 966 | Cocos Islands | None | None | |
| TD | April 19–21 | Not specified | 1004 | Caroline Islands, Philippines | None | None | |
| 17U | April 21–26 | Not Specified | 1006 | None | None | None | |
| Tapah | April 27–May 2 | 95 (60) | 985 | None | None | None |
May
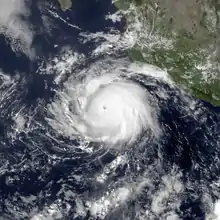
May was an extremely inactive month worldwide despite of the current El Niño event, with two tropical cyclones forming. One of them is BOB 02, which is a depression that brought relief to Odisha, which had been suffering from a heat wave that claimed 22 lives. Coastal areas previously reporting temperatures near 40 °C (104 °F) fell below 30 °C (86 °F) during the system's passage.[20] The other is Amanda, which is the strongest Eastern Pacific tropical cyclone ever recorded in the month of May,[21] and it is also the strongest cyclone of the month with a wind speed of 135 knots (155 mph) and a pressure of 932 hectopascals (27.5 inHg).
| Storm name | Dates active | Max wind km/h (mph) |
Pressure (hPa) |
Areas affected | Damage (USD) |
Deaths | Refs |
|---|---|---|---|---|---|---|---|
| BOB 02 | May 21–23 | 45 (30) | 1000 | India, Myanmar | Minimal | None | |
| Amanda | May 22–29 | 250 (155) | 932 | Southwestern Mexico, Western Mexico | Minimal | 3 |
June
| Storm name | Dates active | Max wind km/h (mph) |
Pressure (hPa) |
Areas affected | Damage (USD) |
Deaths | Refs |
|---|---|---|---|---|---|---|---|
| Boris | June 2–4 | 75 (45) | 998 | Southwestern Mexico, Guatemala | $54.1 million | 6 | |
| Cristina | June 9–15 | 240 (150) | 935 | Southwestern Mexico, Western Mexico | Minimal | None | |
| Mitag (Ester) | June 9–12 | 75 (45) | 994 | Philippines, Taiwan, Japan | None | None | |
| Nanauk | June 10–14 | 85 (50) | 986 | Pakistan, Oman | None | None | |
| Hagibis | June 13–17 | 75 (45) | 996 | Philippines, China, Taiwan, Japan | $198 million | None | |
| Douglas | June 28–July 5 | 85 (50) | 999 | None | None | None | |
| Elida | June 30–July 2 | 85 (50) | 1002 | Western Mexico | None | None |
July
| Storm name | Dates active | Max wind km/h (mph) |
Pressure (hPa) |
Areas affected | Damage (USD) |
Deaths | Refs |
|---|---|---|---|---|---|---|---|
| Arthur | July 1–5 | 155 (100) | 973 | The Bahamas, East Coast of the United States, Atlantic Canada | ≥ $39.5 million | 2 | |
| Neoguri | July 2–11 | 185 (115) | 930 | Caroline Islands, Guam, Japan | $632 million | 3 | |
| Fausto | July 7–9 | 75 (45) | 1004 | None | None | None | |
| Rammasun (Glenda) | July 9–20 | 165 (105) | 935 | Caroline Islands, Guam, Philippines, China, Vietnam | $8.03 billion | 222 | |
| Matmo | |||||||
| Wali | |||||||
| TD | |||||||
| Two | |||||||
| LAND 01 | |||||||
| Genevieve | |||||||
| Hernan | |||||||
| Halong | |||||||
| Nakri | |||||||
| Iselle |
August
| Storm name | Dates active | Max wind km/h (mph) |
Pressure (hPa) |
Areas affected | Damage (USD) |
Deaths | Refs |
|---|---|---|---|---|---|---|---|
| Bertha | |||||||
| Julio | |||||||
| LAND 02 | |||||||
| Karina | |||||||
| Lowell | |||||||
| Julio | |||||||
| Marie | |||||||
| Cristobal | |||||||
| TD | |||||||
| TD |
September

| Storm name | Dates active | Max wind km/h (mph) |
Pressure (hPa) |
Areas affected | Damage (USD) |
Deaths | Refs |
|---|---|---|---|---|---|---|---|
| Dolly | September 1–3 | 85 (50) | 1000 | Mexico (Tamaulipas), Texas | |||
| Norbert | September 2–7 | 205 (125) | 950 | Western Mexico, Baja California Peninsula, Southwestern United States | $28.3 million | 5 | |
| TD | |||||||
| Fengshen | |||||||
| 14W (Karding) | |||||||
| Odile | |||||||
| Edouard | |||||||
| Sixteen-E | |||||||
| Kalmaegi (Luis) | |||||||
| Polo | |||||||
| Fung-wong (Mario) | |||||||
| Kammuri | |||||||
| Rachel | |||||||
| Phanfone (Neneng) | |||||||
October
| Storm name | Dates active | Max wind km/h (mph) |
Pressure (hPa) |
Areas affected | Damage (USD) |
Deaths | Refs |
|---|---|---|---|---|---|---|---|
| Simon | |||||||
| Vongfong (Ompong) | |||||||
| Hudhud | |||||||
| Fay | |||||||
| Gonzalo | |||||||
| Ana | |||||||
| Trudy | |||||||
| Hanna | |||||||
| Nilofar | |||||||
| Vance | |||||||
| Nuri (Paeng) |
November
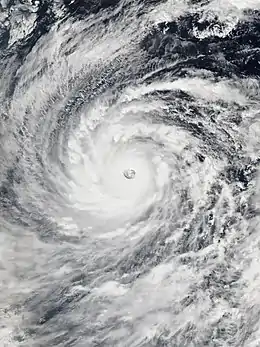
A total of 7 storms formed within the month of November, of which 4 were named. Typhoon Hagupit was the strongest storm of the month and the second-most intense storm of the year, impacting the Philippines a few weeks after Sinlaku affected the Philippines as a tropical depression. Cyclone Qendresa was a rare system that caused damages and 3 deaths in Italy.
| Storm name | Dates active | Max wind km/h (mph) |
Pressure (hPa) |
Areas affected | Damage (USD) |
Deaths | Refs |
|---|---|---|---|---|---|---|---|
| BOB 04 | November 5–8 | 55 (35) | 1000 | None | None | None | |
| Qendresa | November 5–11 | 110 (70) | 978 | Libya, Tunisia, Italy, Malta, Greece | $250 million | 3 | [22] |
| Adjali | November 15–21 | 110 (70) | 987 | None | None | None | |
| 01F | November 21–26 | Not specified | 1003 | Tokelau, Tuvalu, Wallis and Futuna, Samoan Islands | Minimal | None | |
| 02 | November 24–30 | 55 (35) | 997 | Diego Garcia, Mauritius, Rodrigues | None | None | |
| Sinlaku (Queenie) | November 26–30 | 85 (50) | 990 | Palau, Philippines, Vietnam, Laos, Cambodia | $4.26 million | 4 | |
| Hagupit (Ruby) | November 30–December 12 | 215 (130) | 905 | Caroline Islands, Palau, Philippines, Vietnam | $114 million | 18 |
December
| Storm name | Dates active | Max wind km/h (mph) |
Pressure (hPa) |
Areas affected | Damage (USD) |
Deaths | Refs |
|---|---|---|---|---|---|---|---|
| 01U | December 3–4 | 55 (35) | 1000 | None | None | None | |
| Bakung | December 10–13 | 95 (60) | 991 | Indonesia | None | None | |
| 03U | December 13–15 | Not specified | Not specified | None | None | None | |
| 02F | December 16–17 | Not specified | 1007 | None | None | None | |
| 03F | December 20–26 | 55 (35) | 998 | Cook Islands | None | None | |
| 04F | December 21–24 | Not specified | 1000 | French Polynesia | None | None | |
| Kate | December 21–31 | 165 (105) | 950 | Cocos Islands | Minimal | None | |
| 05F | December 23–29 | Not specified | 1000 | Samoan Islands | None | None | |
| Jangmi (Seniang) | December 28–January 1 | 75 (45) | 996 | Philippines, Borneo | $28.4 million | 66 |
Global effects
- The sum of the number of systems and fatalities in each basin will not equal the number shown as the total. This is because when systems move between basins, it creates a discrepancy in the actual number of systems and fatalities.
Notes
- An El Nino watch is issued by the Climate Prediction Center when conditions are favourable for the development of an El Niño within the next six months.[4]
1 Only systems that formed either on or after January 1, 2014 are counted in the seasonal totals.
2 Only systems that formed either before or on December 31, 2014 are counted in the seasonal totals.
3 The wind speeds for this tropical cyclone/basin are based on the IMD Scale which uses 3-minute sustained winds.
4 The wind speeds for this tropical cyclone/basin are based on the Saffir Simpson Scale which uses 1-minute sustained winds.
5The wind speeds for this tropical cyclone are based on Météo-France which uses gust winds.
References
- El Niño/La Niña Update: January 2014 (PDF) (Report). World Meteorological Organization. 30 January 2014. Archived (PDF) from the original on 10 January 2016.
- "Pacific ENSO Update: 3rd Quarter 2014" (PDF). 20 (3). United States Pacific El Niño-Southern Oscillation (ENSO) Applications Climate Center. 26 August 2014. Archived (PDF) from the original on 31 December 2015. Cite journal requires
|journal=(help) - "Pacific ENSO Update: Special Edition" (PDF). 20 (SB1). United States Pacific El Niño-Southern Oscillation (ENSO) Applications Climate Center. 26 August 2014. Archived (PDF) from the original on 31 December 2015. Cite journal requires
|journal=(help) - ENSO Alert System (Report). United States Climate Prediction Center. 6 March 2014. Archived from the original on 22 March 2016.
- El Niño/Southern Oscillation (ENSO) diagnostic discussion: March 2014 (PDF) (Report). United States Climate Prediction Center. 6 March 2014. Archived (PDF) from the original on 1 April 2014.
- Becker, Emily (7 May 2014). "ENSO Blog: 8 May ENSO Diagnostic Discussion". Climate.gov. United States National Oceanic and Atmospheric Administration. Archived from the original on 10 January 2016.
- Climate Services Division (18 August 2015). Fiji Annual Climate Summary 2014 (PDF) (Report). Fiji Meteorological Service. Archived (PDF) from the original on 26 August 2015. Retrieved 25 August 2015.
- "Pacific ENSO Update: 1st Quarter 2015" (PDF). 21 (1). United States Pacific El Niño-Southern Oscillation (ENSO) Applications Climate Center. 3 March 2015. Archived (PDF) from the original on 19 March 2016. Cite journal requires
|journal=(help) - "First El Niño in five years declared by Japan's weather bureau". Archived from the original on 13 March 2016. Retrieved 10 January 2016.
- "Pacific ENSO Update: 2nd Quarter 2015" (PDF). 21 (2). United States Pacific El Niño-Southern Oscillation (ENSO) Applications Climate Center. 29 May 2015. Archived (PDF) from the original on 19 March 2016. Cite journal requires
|journal=(help) - January 2014 Global Catastrophe Recap (PDF) (Report). AON Benfield. 2014. Retrieved December 23, 2014.
- "Tonga reports widespread damage and one death from Cyclone Ian". Agence France-Presse. Retrieved 8 October 2020.
- India Meteorological Department. "A Preliminary Report on Depression over Bay of Bengal (4–7 January, 2014)" (PDF). India Meteorological Department. Archived from the original (PDF) on 10 May 2014. Retrieved 10 May 2014.
- United Nations Office for the Coordination of Human Affairs (January 8, 2014). Tropical Depression Path (as of 8th January 2014) (PDF) (Report). ReliefWeb. Retrieved 10 January 2014.
- United States National Oceanic and Atmospheric Administration's Climate Prediction Center (January 8, 2014). Africa Hazards Outlook January 9 – January 15, 2014 (Report). ReliefWeb. Retrieved 10 January 2014.
- "NDRRMC Updates Sitrep No. 33 re: Effects of Tropical Depression "Agaton"" (PDF). National Disaster Risk Reduction and Management Council. February 1, 2014. Archived from the original (PDF) on November 30, 2014. Retrieved November 30, 2014.
- NC 1ère (January 21, 2014). "June a fait une première victime". NC 1ère. Retrieved January 21, 2014.
- "Le cyclone Deliwe dévaste l'Ouest de Madagascar" (in French). L'Express de Madagascar. January 18, 2014. Archived from the original on 2014-01-25. Retrieved January 19, 2014.
- "Final Report: Re: Effects of Tropical Storm Basyang (IN: Kajiki)" (PDF). National Disaster Risk Reduction and Management Council. February 6, 2014. Archived from the original (PDF) on August 1, 2016. Retrieved August 1, 2016.
- "Heavy Rains Lash Odisha; Flood Alert in 6 Districts". Bhubaneswar, India: The New Indian Express. May 26, 2014. Archived from the original on May 29, 2014. Retrieved May 29, 2014.
- Stacy R. Stewart (June 24, 2014). "Tropical Cyclone Report: Hurricane Amanda" (PDF). National Hurricane Center. National Oceanic and Atmospheric Administration. Retrieved December 26, 2016.
- "November 2014 Global Catastrophe Recap" (PDF). Aon Benfield. 3 December 2014. p. 5. Retrieved 2 December 2017.
External links
| Tropical cyclone year articles (2010–2019) |
|---|
| 2010, 2011, 2012, 2013, 2014, 2015, 2016, 2017, 2018, 2019 |
Regional Specialized Meteorological Centers
- US National Hurricane Center – North Atlantic, Eastern Pacific
- Central Pacific Hurricane Center – Central Pacific
- Japan Meteorological Agency – NW Pacific
- India Meteorological Department – Bay of Bengal and the Arabian Sea
- Météo-France – La Reunion – South Indian Ocean from 30°E to 90°E
- Fiji Meteorological Service – South Pacific west of 160°E, north of 25° S
Tropical Cyclone Warning Centers
- Meteorology, Climatology, and Geophysical Agency of Indonesia – South Indian Ocean from 90°E to 141°E, generally north of 10°S
- Australian Bureau of Meteorology (TCWC's Perth, Darwin & Brisbane) – South Indian Ocean & South Pacific Ocean from 90°E to 160°E, generally south of 10°S
- Papua New Guinea National Weather Service – South Pacific Ocean from 141°E to 160°E, generally north of 10°S
- Meteorological Service of New Zealand Limited – South Pacific west of 160°E, south of 25°S
![]() This article incorporates public domain material from websites or documents of the National Weather Service.
This article incorporates public domain material from websites or documents of the National Weather Service.