2016 United States presidential election in New Mexico
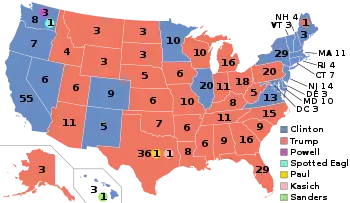
The 2016 United States presidential election in New Mexico was held on Tuesday, November 8, 2016, as part of the 2016 United States presidential election in which all 50 states plus the District of Columbia participated. New Mexico voters chose electors to represent them in the Electoral College via a popular vote, pitting the Republican Party's nominee, businessman Donald Trump, and running mate Indiana Governor Mike Pence against Democratic Party nominee, former Secretary of State Hillary Clinton, and her running mate Virginia Senator Tim Kaine. New Mexico has five electoral votes in the Electoral College.[2]
| |||||||||||||||||||||||||||||||||
| Turnout | 62.36%[1] | ||||||||||||||||||||||||||||||||
|---|---|---|---|---|---|---|---|---|---|---|---|---|---|---|---|---|---|---|---|---|---|---|---|---|---|---|---|---|---|---|---|---|---|
| |||||||||||||||||||||||||||||||||
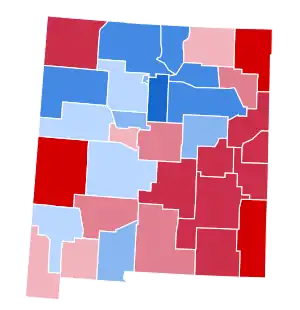 County Results
| |||||||||||||||||||||||||||||||||
| |||||||||||||||||||||||||||||||||

.jpg.webp)


| Elections in New Mexico |
|---|
 |
Clinton won the state of New Mexico with a plurality, by a margin of 8.2 percentage points. The state had long been considered leaning Democratic, or a state Clinton would win, due to its large population of Hispanic/Latino and Native American voters. This is the third time since 1912, when New Mexico attained statehood, that the state voted for a candidate who did not win the Electoral College, after 1976 and 2000. However, in this election and in 2000, New Mexico voted for the candidate who received the most votes. Former New Mexico Governor Gary Johnson achieved 9% in his home state, his best performance of any state and the Libertarian Party's best performance in any single state since Ed Clark received 11.66% of the vote in Alaska in 1980.[3] Johnson's result was also the best result for a third party or independent candidate in New Mexico since Ross Perot's campaign in 1992.
Primary elections
Democratic primary
Four candidates appeared on the Democratic Party (United States) presidential primary ballot:
| New Mexico Democratic primary, June 7, 2016 | |||||
|---|---|---|---|---|---|
| Candidate | Popular vote | Estimated delegates | |||
| Count | Percentage | Pledged | Unpledged | Total | |
| Hillary Clinton | 111,334 | 51.53% | 18 | 9 | 27 |
| Bernie Sanders | 104,741 | 48.47% | 16 | 0 | 16 |
| Uncommitted | N/A | 0 | 0 | 0 | |
| Total | 216,075 | 100% | 34 | 9 | 43 |
| Source: The Green Papers, New Mexico State Board of Elections, New Mexico Democratic Delegates Allocation | |||||
Republican primary
Twelve candidates appeared on the Republican presidential primary ballot:
- Jeb Bush (withdrawn)
- Ben Carson (withdrawn)
- Chris Christie (withdrawn)
- Ted Cruz (withdrawn)
- Carly Fiorina (withdrawn)
- Jim Gilmore (withdrawn)
- Mike Huckabee (withdrawn)
- John Kasich (withdrawn)
- Rand Paul (withdrawn)
- Marco Rubio (withdrawn)
- Rick Santorum (withdrawn)
- Donald Trump
Donald Trump, the only candidate with an active campaign, won every delegate from New Mexico.
| New Mexico Republican primary, June 7, 2016 | |||||
|---|---|---|---|---|---|
| Candidate | Votes | Percentage | Actual delegate count | ||
| Bound | Unbound | Total | |||
| Donald Trump | 73,908 | 70.64% | 24 | 0 | 24 |
| Ted Cruz (withdrawn) | 13,925 | 13.31% | 0 | 0 | 0 |
| John Kasich (withdrawn) | 7,925 | 7.57% | 0 | 0 | 0 |
| Ben Carson (withdrawn) | 3,830 | 3.66% | 0 | 0 | 0 |
| Jeb Bush (withdrawn) | 3,531 | 3.37% | 0 | 0 | 0 |
| Carly Fiorina (withdrawn) | 1,508 | 1.44% | 0 | 0 | 0 |
| Unprojected delegates: | 0 | 0 | 0 | ||
| Total: | 104,627 | 100.00% | 24 | 0 | 24 |
| Source: The Green Papers | |||||
Polling
Albuquerque Journal October 2, 2016[4]
- Clinton 35%
- Trump 31%
- Johnson 24%
- Stein 2%
Albuquerque Journal November 5, 2016[5]
- Clinton 45%
- Trump 40%
- Johnson 11%
- Stein 3%
Clinton won every pre-election poll conducted. Her margin of victory varied from 2 points to 13 points. The last poll showed Clinton ahead of Trump 46% to 44%, while the average of the last three had Clinton leading Trump 45% to 40%, with many undecided voters who probably considered Gary Johnson, the state's former governor.[6] Johnson even reached 24% in one poll conducted by the Albuquerque Journal.
General election
Predictions
| Source | Ranking | As of |
|---|---|---|
| Los Angeles Times[7] | Safe D | November 6, 2016 |
| CNN[8] | Safe D | November 4, 2016 |
| Cook Political Report[9] | Likely D | November 7, 2016 |
| Electoral-vote.com[10] | Lean D | November 8, 2016 |
| Sabato's Crystal Ball[11] | Likely D | November 7, 2016 |
| Fox News[12] | Lean D | November 7, 2016 |
Results
| Party | Candidate | Votes | % | |
|---|---|---|---|---|
| Democratic | Hillary Clinton and Tim Kaine | 385,234 | 48.26% | |
| Republican | Donald Trump and Mike Pence | 319,667 | 40.04% | |
| Libertarian | Gary Johnson and William Weld | 74,541 | 9.34% | |
| Green | Jill Stein and Ajamu Baraka | 9,879 | 1.24% | |
| Independent | Evan McMullin and Nathan Johnson | 5,825 | 0.73% | |
| Constitution | Darrell Castle and Scott Bradley | 1,514 | 0.19% | |
| Socialism and Liberation | Gloria La Riva and Dennis Banks | 1,184 | 0.14% | |
| Independent | Rocky De La Fuente and Michael Steinberg | 475 | 0.06% | |
| Total votes | 798,319 | 100.00% | ||
Results by county
Official results from New Mexico Secretary of State.[14]
| County | Candidate | Total | ||||||||
|---|---|---|---|---|---|---|---|---|---|---|
| Clinton | Trump | Johnson | Stein | McMullin | Castle | La Riva | De La Fuente | |||
| Bernalillo | percent | 52.22% | 34.48% | 10.81% | 1.32% | 0.79% | 0.17% | 0.16% | 0.05% | 100.00% |
| votes | 143,417 | 94,698 | 29,682 | 3,614 | 2,181 | 474 | 445 | 151 | 274,662 | |
| Catron | percent | 20.84% | 71.45% | 5.42% | 1.12% | 0.54% | 0.59% | 0.00% | 0.05% | 100.00% |
| votes | 427 | 1,464 | 111 | 23 | 11 | 12 | 0 | 1 | 2,049 | |
| Chaves | percent | 27.30% | 63.50% | 7.94% | 0.42% | 0.50% | 0.16% | 0.11% | 0.07% | 100.00% |
| votes | 5,534 | 12,872 | 1,609 | 86 | 102 | 32 | 22 | 14 | 20,271 | |
| Cibola | percent | 46.40% | 39.63% | 12.03% | 0.91% | 0.53% | 0.20% | 0.25% | 0.06% | 100.00% |
| votes | 3,741 | 3,195 | 970 | 73 | 43 | 16 | 20 | 5 | 8,063 | |
| Colfax | percent | 39.93% | 48.48% | 9.88% | 0.69% | 0.58% | 0.23% | 0.09% | 0.11% | 100.00% |
| votes | 2,129 | 2,585 | 527 | 37 | 31 | 12 | 5 | 6 | 5,332 | |
| Curry | percent | 23.34% | 67.58% | 7.28% | 0.55% | 0.84% | 0.29% | 0.07% | 0.04% | 100.00% |
| votes | 3,121 | 9,035 | 973 | 74 | 112 | 39 | 10 | 6 | 13,370 | |
| De Baca | percent | 21.21% | 68.13% | 9.78% | 0.66% | 0.22% | 0.00% | 0.00% | 0.00% | 100.00% |
| votes | 193 | 620 | 89 | 6 | 2 | 0 | 0 | 0 | 910 | |
| Doña Ana | percent | 53.71% | 35.92% | 7.74% | 1.35% | 0.80% | 0.22% | 0.16% | 0.09% | 100.00% |
| votes | 37,947 | 25,374 | 5,471 | 953 | 566 | 157 | 115 | 65 | 70,648 | |
| Eddy | percent | 25.59% | 66.85% | 6.48% | 0.43% | 0.42% | 0.14% | 0.06% | 0.03% | 100.00% |
| votes | 5,033 | 13,147 | 1,275 | 84 | 83 | 27 | 12 | 6 | 19,667 | |
| Grant | percent | 48.99% | 41.28% | 7.02% | 1.70% | 0.62% | 0.20% | 0.15% | 0.05% | 100.00% |
| votes | 6,276 | 5,288 | 899 | 218 | 80 | 25 | 19 | 6 | 12,811 | |
| Guadalupe | percent | 53.09% | 32.57% | 13.03% | 0.99% | 0.27% | 0.05% | 0.00% | 0.00% | 100.00% |
| votes | 970 | 595 | 238 | 18 | 5 | 1 | 0 | 0 | 1,827 | |
| Harding | percent | 29.60% | 59.01% | 10.44% | 0.57% | 0.00% | 0.38% | 0.00% | 0.00% | 100.00% |
| votes | 156 | 311 | 55 | 3 | 0 | 2 | 0 | 0 | 527 | |
| Hidalgo | percent | 41.88% | 48.61% | 7.32% | 0.32% | 1.44% | 0.11% | 0.16% | 0.16% | 100.00% |
| votes | 784 | 910 | 137 | 6 | 27 | 2 | 3 | 3 | 1,872 | |
| Lea | percent | 22.19% | 70.55% | 6.20% | 0.32% | 0.45% | 0.15% | 0.10% | 0.06% | 100.00% |
| votes | 3,930 | 12,495 | 1,098 | 56 | 80 | 26 | 17 | 10 | 17,712 | |
| Lincoln | percent | 26.19% | 66.23% | 6.29% | 0.66% | 0.40% | 0.10% | 0.10% | 0.02% | 100.00% |
| votes | 2,331 | 5,896 | 560 | 59 | 36 | 9 | 9 | 2 | 8,902 | |
| Los Alamos | percent | 51.10% | 30.86% | 13.89% | 1.10% | 2.67% | 0.27% | 0.06% | 0.05% | 100.00% |
| votes | 5,562 | 3,359 | 1,512 | 120 | 291 | 29 | 7 | 5 | 10,885 | |
| Luna | percent | 43.80% | 47.68% | 6.59% | 0.90% | 0.69% | 0.18% | 0.07% | 0.10% | 100.00% |
| votes | 3,195 | 3,478 | 481 | 66 | 50 | 13 | 5 | 7 | 7,295 | |
| McKinley | percent | 62.55% | 23.52% | 11.11% | 1.31% | 0.80% | 0.27% | 0.35% | 0.09% | 100.00% |
| votes | 13,576 | 5,104 | 2,412 | 284 | 173 | 58 | 76 | 20 | 21,703 | |
| Mora | percent | 62.93% | 27.24% | 7.95% | 1.43% | 0.20% | 0.16% | 0.04% | 0.04% | 100.00% |
| votes | 1,536 | 665 | 194 | 35 | 5 | 4 | 1 | 1 | 2,441 | |
| Otero | percent | 30.53% | 59.26% | 8.04% | 0.84% | 0.81% | 0.33% | 0.11% | 0.07% | 100.00% |
| votes | 6,124 | 11,886 | 1,613 | 169 | 162 | 67 | 23 | 15 | 20,059 | |
| Quay | percent | 28.47% | 61.93% | 8.37% | 0.42% | 0.48% | 0.22% | 0.06% | 0.06% | 100.00% |
| votes | 1,017 | 2,212 | 299 | 15 | 17 | 8 | 2 | 2 | 3,572 | |
| Rio Arriba | percent | 64.47% | 24.19% | 9.58% | 1.26% | 0.19% | 0.11% | 0.11% | 0.09% | 100.00% |
| votes | 9,592 | 3,599 | 1,425 | 188 | 28 | 17 | 16 | 13 | 14,878 | |
| Roosevelt | percent | 24.44% | 65.28% | 8.10% | 0.81% | 0.97% | 0.18% | 0.13% | 0.08% | 100.00% |
| votes | 1,454 | 3,884 | 482 | 48 | 58 | 11 | 8 | 5 | 5,950 | |
| San Juan | percent | 27.90% | 60.61% | 9.11% | 0.76% | 1.09% | 0.27% | 0.21% | 0.05% | 100.00% |
| votes | 12,865 | 27,946 | 4,200 | 352 | 503 | 125 | 97 | 22 | 46,110 | |
| San Miguel | percent | 67.76% | 21.51% | 8.51% | 1.49% | 0.33% | 0.23% | 0.09% | 0.07% | 100.00% |
| votes | 7,285 | 2,313 | 915 | 160 | 35 | 25 | 10 | 8 | 10,751 | |
| Sandoval | percent | 44.91% | 41.99% | 10.79% | 1.02% | 0.90% | 0.21% | 0.12% | 0.06% | 100.00% |
| votes | 27,707 | 25,905 | 6,657 | 627 | 553 | 129 | 76 | 36 | 61,690 | |
| Santa Fe | percent | 71.10% | 20.06% | 6.11% | 2.03% | 0.41% | 0.10% | 0.13% | 0.04% | 100.00% |
| votes | 50,793 | 14,332 | 4,362 | 1,452 | 295 | 75 | 95 | 30 | 71,434 | |
| Sierra | percent | 31.11% | 58.10% | 8.53% | 1.51% | 0.39% | 0.23% | 0.12% | 0.02% | 100.00% |
| votes | 1,612 | 3,010 | 442 | 78 | 20 | 12 | 6 | 1 | 5,181 | |
| Socorro | percent | 48.24% | 38.09% | 11.68% | 0.87% | 0.57% | 0.22% | 0.29% | 0.04% | 100.00% |
| votes | 3,313 | 2,616 | 802 | 60 | 39 | 15 | 20 | 3 | 6,868 | |
| Taos | percent | 69.91% | 17.87% | 7.73% | 4.04% | 0.20% | 0.04% | 0.18% | 0.03% | 100.00% |
| votes | 10,668 | 2,727 | 1,179 | 617 | 31 | 6 | 27 | 5 | 15,260 | |
| Torrance | percent | 28.23% | 58.73% | 10.94% | 1.04% | 0.57% | 0.25% | 0.14% | 0.09% | 100.00% |
| votes | 1,785 | 3,714 | 692 | 66 | 36 | 16 | 9 | 6 | 6,324 | |
| Union | percent | 18.80% | 71.45% | 7.87% | 0.76% | 0.53% | 0.41% | 0.06% | 0.12% | 100.00% |
| votes | 320 | 1,216 | 134 | 13 | 9 | 7 | 1 | 2 | 1,702 | |
| Valencia | percent | 39.29% | 47.89% | 11.04% | 0.79% | 0.58% | 0.23% | 0.10% | 0.07% | 100.00% |
| votes | 10,841 | 13,215 | 3,046 | 219 | 161 | 63 | 28 | 19 | 27,592 | |
| Total | percent | 48.26% | 40.04% | 9.34% | 1.24% | 0.73% | 0.19% | 0.15% | 0.06% | 100.00% |
| votes | 385,234 | 319,666 | 74,541 | 9,879 | 5,825 | 1,514 | 1,184 | 475 | 798,318 | |
Counties that flipped from Democratic to Republican
By congressional district
Clinton won 2 of 3 congressional districts.[16]
| District | Trump | Clinton | Representative |
|---|---|---|---|
| 1st | 35% | 52% | Michelle Lujan Grisham |
| 2nd | 50% | 40% | Steve Pearce |
| 3rd | 37% | 52% | Ben Ray Luján |
See also
References
- "Official Results - General Election - November 8, 2016". New Mexico Secretary of State. Retrieved 4 November 2020.
- "Distribution of Electoral Votes". National Archives and Records Administration. Retrieved December 18, 2020.
- "2016 Presidential Election Statistics". Dave Leip’s Atlas of U.S. Presidential Elections. Retrieved 2018-03-05.
- Coleman, Michael (October 2, 2016). "Clinton, Trump in tight race in New Mexico". Albuquerque Journal.
- Coleman, Michael (November 5, 2016). "Journal Poll: Clinton still ahead in NM". Albuquerque Journal.
- https://www.realclearpolitics.com/epolls/2016/president/nm/new_mexico_trump_vs_clinton-5894.html#polls
- "Our final map has Clinton winning with 352 electoral votes. Compare your picks with ours". Los Angeles Times. 2016-11-06. Retrieved 2016-11-13.
- Chalian, David (November 4, 2016). "Road to 270: CNN's new election map". CNN. Retrieved March 3, 2019.
- "2016 Electoral Scorecard". The Cook Political Report. November 7, 2016. Retrieved March 3, 2019.
- "2016 Electoral Map Prediction". Electoral-vote.com. November 8, 2016. Retrieved March 3, 2019.
- Sabato, Larry J. (November 7, 2016). "2016 President". University of Virginia Center for Politics. Retrieved March 3, 2019.
- "Electoral Scorecard: Map shifts again in Trump's favor, as Clinton holds edge". Fox News. 2016-11-07. Retrieved 2016-11-13.
- "Election Night Results". Retrieved 2016-12-07.
- Official Results General Election - November 8, 2016 Last Updated: 11/25/2016 11:16:11 AM., New Mexico Secretary of State
- Bump, Philip. "The counties that flipped parties to swing the 2016 election". Washington Post. ISSN 0190-8286. Retrieved 2020-09-01.
- "Introducing the 2017 Cook Political Report Partisan Voter Index". The Cook Political Report.