Guadalupe County, New Mexico
Guadalupe County (Spanish: Condado de Guadalupe) is a county in the U.S. state of New Mexico. As of the 2010 census, the population was 4,687,[1] making it the fifth-least populous county in New Mexico. Its county seat is Santa Rosa.[2]
Guadalupe County | |
|---|---|
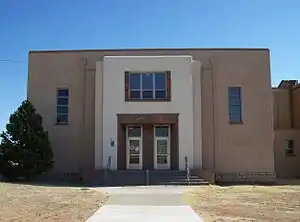 Guadalupe County Courthouse in Santa Rosa | |
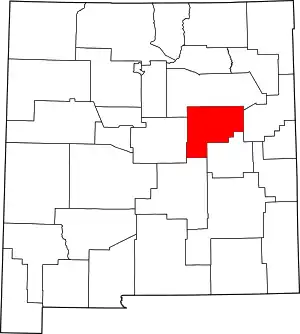 Location within the U.S. state of New Mexico | |
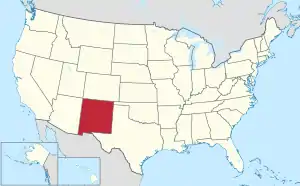 New Mexico's location within the U.S. | |
| Coordinates: 34°52′N 104°47′W | |
| Country | |
| State | |
| Founded | February 26, 1891 |
| Seat | Santa Rosa |
| Largest city | Santa Rosa |
| Area | |
| • Total | 3,032 sq mi (7,850 km2) |
| • Land | 3,030 sq mi (7,800 km2) |
| • Water | 1.1 sq mi (3 km2) 0.04%% |
| Population | |
| • Estimate (2019) | 4,300 |
| • Density | 1.5/sq mi (0.6/km2) |
| Time zone | UTC−7 (Mountain) |
| • Summer (DST) | UTC−6 (MDT) |
| Congressional district | 2nd |
History
Guadalupe County was named after Nuestra Señora de Guadalupe (Our Lady of Guadalupe) or after the Mesita de Guadalupe (Guadalupe Plain). The county was created from the southern portion of San Miguel County February 26, 1891 by an act of the New Mexico Territorial Legislature. The original county seat was Puerto De Luna, but was moved north to Santa Rosa in 1903. That same year, after the popular Spanish–American War of 1898, the county's name was changed to Leonard Wood County after the Presidential physician, Major-General in the Rough Riders, and winner of the Medal of Honor. The name was later changed back to Guadalupe County.[3] The County contains whole, or parts of, several previous Spanish land grants to include the Aqua Negra, the Jose Perea, the Anton Chico, and the Preston Beck land grants.[4]
Geography
According to the U.S. Census Bureau, the county has a total area of 3,032 square miles (7,850 km2), of which 3,030 square miles (7,800 km2) is land and 1.1 square miles (2.8 km2) (0.04%) is water.[5]
Adjacent counties
- San Miguel County – north
- Quay County – east
- De Baca County – south
- Lincoln County – southwest
- Torrance County – west
Demographics
| Historical population | |||
|---|---|---|---|
| Census | Pop. | %± | |
| 1910 | 10,927 | — | |
| 1920 | 8,015 | −26.6% | |
| 1930 | 7,027 | −12.3% | |
| 1940 | 8,646 | 23.0% | |
| 1950 | 6,772 | −21.7% | |
| 1960 | 5,610 | −17.2% | |
| 1970 | 4,969 | −11.4% | |
| 1980 | 4,496 | −9.5% | |
| 1990 | 4,156 | −7.6% | |
| 2000 | 4,680 | 12.6% | |
| 2010 | 4,687 | 0.1% | |
| 2019 (est.) | 4,300 | [6] | −8.3% |
| U.S. Decennial Census[7] 1790-1960[8] 1900-1990[9] 1990-2000[10] 2010-2016[1] | |||
2000 census
As of the 2000 census,[11] there were 4,680 people, 1,655 households, and 1,145 families living in the county. The population density was 2 people per square mile (1/km2). There were 2,160 housing units at an average density of 1 per square mile (0/km2). The racial makeup of the county was 54.06% White, 1.32% Black or African American, 1.13% Native American, 0.53% Asian, 0.04% Pacific Islander, 39.06% from other races, and 3.85% from two or more races. 81.22% of the population were Hispanic or Latino of any race.
There were 1,655 households, out of which 33.80% had children under the age of 18 living with them, 49.50% were married couples living together, 14.30% had a female householder with no husband present, and 30.80% were non-families. 27.90% of all households were made up of individuals, and 11.50% had someone living alone who was 65 years of age or older. The average household size was 2.51 and the average family size was 3.05.
In the county, the population was spread out, with 24.40% under the age of 18, 9.20% from 18 to 24, 30.70% from 25 to 44, 21.90% from 45 to 64, and 13.80% who were 65 years of age or older. The median age was 38 years. For every 100 females there were 121.50 males. For every 100 females age 18 and over, there were 126.30 males.
The median income for a household in the county was $24,783, and the median income for a family was $28,279. Males had a median income of $22,463 versus $18,500 for females. The per capita income for the county was $11,241. About 18.10% of families and 21.60% of the population were below the poverty line, including 24.10% of those under age 18 and 19.40% of those age 65 or over.
2010 census
As of the 2010 census, there were 4,687 people, 1,766 households, and 1,114 families living in the county.[12] The population density was 1.5 inhabitants per square mile (0.58/km2). There were 2,393 housing units at an average density of 0.8 per square mile (0.31/km2).[13] The racial makeup of the county was 70.4% white, 1.9% American Indian, 1.7% black or African American, 1.3% Asian, 21.4% from other races, and 3.3% from two or more races. Those of Hispanic or Latino origin made up 79.6% of the population.[12] In terms of ancestry, 8.3% were German, and 2.4% were American.[14]
Of the 1,766 households, 30.6% had children under the age of 18 living with them, 40.9% were married couples living together, 15.2% had a female householder with no husband present, 36.9% were non-families, and 32.4% of all households were made up of individuals. The average household size was 2.33 and the average family size was 2.93. The median age was 40.1 years.[12]
The median income for a household in the county was $28,488 and the median income for a family was $37,535. Males had a median income of $36,494 versus $23,984 for females. The per capita income for the county was $13,710. About 21.7% of families and 28.2% of the population were below the poverty line, including 46.7% of those under age 18 and 27.4% of those age 65 or over.[15]
Politics
Guadalupe County leans Democratic, and has voted for that party's presidential nominee in every election since 1988.
| Year | Republican | Democratic | Third parties |
|---|---|---|---|
| 2016 | 32.6% 595 | 53.1% 970 | 14.3% 262 |
| 2012 | 26.1% 557 | 69.7% 1,488 | 4.2% 90 |
| 2008 | 28.2% 620 | 70.9% 1,557 | 0.9% 19 |
| 2004 | 40.3% 914 | 59.1% 1,340 | 0.6% 13 |
| 2000 | 33.2% 548 | 65.2% 1,076 | 1.6% 27 |
| 1996 | 25.1% 436 | 69.6% 1,208 | 5.3% 92 |
| 1992 | 32.9% 691 | 58.3% 1,225 | 8.9% 186 |
| 1988 | 40.6% 861 | 58.7% 1,243 | 0.7% 15 |
| 1984 | 50.4% 990 | 48.1% 946 | 1.5% 30 |
| 1980 | 49.7% 1,065 | 45.7% 980 | 4.7% 100 |
| 1976 | 42.7% 1,047 | 56.2% 1,379 | 1.1% 27 |
| 1972 | 51.4% 1,297 | 47.6% 1,202 | 1.0% 26 |
| 1968 | 51.4% 1,176 | 44.9% 1,027 | 3.7% 84 |
| 1964 | 39.0% 1,058 | 60.8% 1,649 | 0.2% 6 |
| 1960 | 43.8% 1,242 | 56.1% 1,589 | 0.1% 3 |
| 1956 | 56.2% 1,529 | 43.7% 1,191 | 0.1% 3 |
| 1952 | 53.9% 1,575 | 46.1% 1,347 | |
| 1948 | 50.2% 1,565 | 49.8% 1,550 | |
| 1944 | 51.7% 1,649 | 48.3% 1,539 | |
| 1940 | 46.5% 1,807 | 53.5% 2,082 | |
| 1936 | 44.8% 1,775 | 55.1% 2,187 | 0.1% 4 |
| 1932 | 45.8% 1,621 | 53.9% 1,909 | 0.3% 12 |
| 1928 | 61.1% 1,718 | 38.9% 1,093 | |
| 1924 | 51.8% 1,329 | 41.2% 1,056 | 7.0% 179 |
| 1920 | 56.3% 1,599 | 43.1% 1,224 | 0.6% 17 |
| 1916 | 46.9% 1,067 | 51.5% 1,172 | 1.6% 36 |
| 1912 | 39.2% 651 | 45.8% 761 | 15.1% 250 |
References
- "State & County QuickFacts". United States Census Bureau. Archived from the original on June 6, 2011. Retrieved September 29, 2013.
- "Find a County". National Association of Counties. Archived from the original on May 31, 2011. Retrieved June 7, 2011.
- Bowden, J. J. "Guadalupe County". Office of the State Historian. Archived from the original on March 20, 2012. Retrieved December 16, 2011.
- "Guadalupe Co. History". The New Mexico GenWeb Project. Retrieved December 16, 2011.
- "2010 Census Gazetteer Files". United States Census Bureau. August 22, 2012. Archived from the original on January 1, 2015. Retrieved January 2, 2015.
- "Population and Housing Unit Estimates". Retrieved December 24, 2019.
- "U.S. Decennial Census". United States Census Bureau. Retrieved January 2, 2015.
- "Historical Census Browser". University of Virginia Library. Retrieved January 2, 2015.
- "Population of Counties by Decennial Census: 1900 to 1990". United States Census Bureau. Retrieved January 2, 2015.
- "Census 2000 PHC-T-4. Ranking Tables for Counties: 1990 and 2000" (PDF). United States Census Bureau. Retrieved January 2, 2015.
- "U.S. Census website". United States Census Bureau. Retrieved January 31, 2008.
- "DP-1 Profile of General Population and Housing Characteristics: 2010 Demographic Profile Data". United States Census Bureau. Archived from the original on February 13, 2020. Retrieved January 24, 2016.
- "Population, Housing Units, Area, and Density: 2010 - County". United States Census Bureau. Archived from the original on February 13, 2020. Retrieved January 24, 2016.
- "DP02 SELECTED SOCIAL CHARACTERISTICS IN THE UNITED STATES – 2006-2010 American Community Survey 5-Year Estimates". United States Census Bureau. Archived from the original on February 13, 2020. Retrieved January 24, 2016.
- "DP03 SELECTED ECONOMIC CHARACTERISTICS – 2006-2010 American Community Survey 5-Year Estimates". United States Census Bureau. Archived from the original on February 13, 2020. Retrieved January 24, 2016.
- Leip, David. "Dave Leip's Atlas of U.S. Presidential Elections". uselectionatlas.org. Retrieved April 1, 2018.
External links
- Profile from the National Association of Counties
Places adjacent to Guadalupe County, New Mexico | ||||||||||
|---|---|---|---|---|---|---|---|---|---|---|
| ||||||||||
Municipalities and communities of Guadalupe County, New Mexico, United States | ||
|---|---|---|
| City | Map of New Mexico highlighting Guadalupe County | |
| Town | ||
| CDPs | ||
| Other unincorporated community | ||
| ||
Santa Fe (capital) | ||
| Topics |
| |
| Society | ||
| Regions |
| |
| Cities | ||
| Counties | ||

| Authority control |
|---|