Otero County, New Mexico
Otero County is a county located in the U.S. state of New Mexico. As of the 2010 census, the population was 63,797.[1] Its county seat is Alamogordo.[2] Its southern boundary is the Texas state line. It is named for Miguel Antonio Otero, the territorial governor when the county was created.[3]
Otero County | |
|---|---|
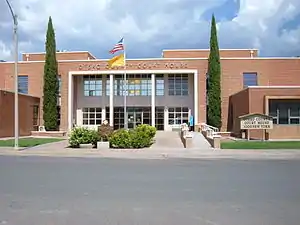 Otero County courthouse in Alamogordo | |
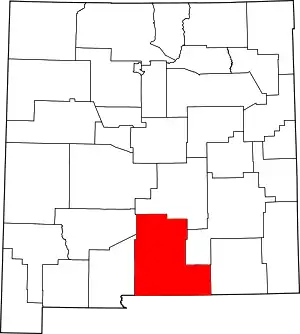 Location within the U.S. state of New Mexico | |
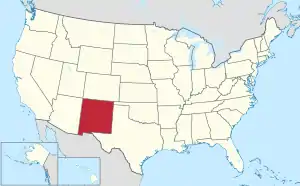 New Mexico's location within the U.S. | |
| Coordinates: 32°37′N 105°44′W | |
| Country | |
| State | |
| Founded | January 30, 1899 |
| Named for | Miguel Antonio Otero |
| Seat | Alamogordo |
| Largest city | Alamogordo |
| Area | |
| • Total | 6,628 sq mi (17,170 km2) |
| • Land | 6,613 sq mi (17,130 km2) |
| • Water | 14 sq mi (40 km2) 0.2%% |
| Population | |
| • Estimate (2019) | 67,490 |
| • Density | 9.6/sq mi (3.7/km2) |
| Time zone | UTC−7 (Mountain) |
| • Summer (DST) | UTC−6 (MDT) |
| Congressional district | 2nd |
| Website | co |
Otero County includes the Alamogordo Micropolitan Statistical Area.[4]
History
The county declared a state of emergency in April 2019 when the federal inspection stations on U.S. Route 70 and U.S. Route 54 were left unstaffed by the U.S. Customs and Border Protection as part of the temporary closure of all six checkpoints in the El Paso Sector, which covers West Texas and New Mexico. The county was concerned about the possibility of illegal narcotics flowing north unchecked since the checkpoint agents had been shifted to the border to help process migrant asylum-seekers.[5] The inspection stations reopened August 5, 2019.
Geography
According to the U.S. Census Bureau, the county has a total area of 6,628 square miles (17,170 km2), of which 6,613 square miles (17,130 km2) is land and 14 square miles (36 km2) (0.2%) is water.[6] It is the third-largest county in New Mexico by area.
Adjacent counties
- Doña Ana County – west
- Sierra County – northwest
- Lincoln County – north
- Chaves County – east
- Eddy County – east
- Culberson County, Texas – southeast
- Hudspeth County, Texas – south
- El Paso County, Texas – southwest
National protected areas
- Lincoln National Forest (part)
- White Sands National Park (part)
Demographics
| Historical population | |||
|---|---|---|---|
| Census | Pop. | %± | |
| 1910 | 7,069 | — | |
| 1920 | 7,902 | 11.8% | |
| 1930 | 9,779 | 23.8% | |
| 1940 | 10,522 | 7.6% | |
| 1950 | 14,909 | 41.7% | |
| 1960 | 36,976 | 148.0% | |
| 1970 | 41,097 | 11.1% | |
| 1980 | 44,665 | 8.7% | |
| 1990 | 51,928 | 16.3% | |
| 2000 | 62,298 | 20.0% | |
| 2010 | 63,797 | 2.4% | |
| 2019 (est.) | 67,490 | [7] | 5.8% |
| U.S. Decennial Census[8] 1790-1960[9] 1900-1990[10] 1990-2000[11] 2010-2016[1] | |||
2000 census
As of the 2000 census,[12] there were 62,298 people, 22,984 households, and 16,801 families living in the county. The population density was 9 people per square mile (4/km2). There were 29,272 housing units at an average density of 4 per square mile (2/km2). The racial makeup of the county was 73.71% White, 3.92% Black or African American, 5.80% Native American, 1.17% Asian, 0.13% Pacific Islander, 11.67% from other races, and 3.60% from two or more races. 32.16% of the population were Hispanic or Latino of any race.
There were 22,984 households, out of which 37.10% had children under the age of 18 living with them, 57.50% were married couples living together, 11.80% had a female householder with no husband present, and 26.90% were non-families. 23.30% of all households were made up of individuals, and 8.10% had someone living alone who was 65 years of age or older. The average household size was 2.66 and the average family size was 3.14.
In the county, the population was spread out, with 29.50% under the age of 18, 9.30% from 18 to 24, 28.60% from 25 to 44, 21.00% from 45 to 64, and 11.70% who were 65 years of age or older. The median age was 34 years. For every 100 females there were 99.00 males. For every 100 females age 18 and over, there were 96.80 males.
The median income for a household in the county was $30,861, and the median income for a family was $34,781. Males had a median income of $27,657 versus $18,470 for females. The per capita income for the county was $14,345. About 15.60% of families and 19.30% of the population were below the poverty line, including 27.90% of those under age 18 and 12.80% of those age 65 or over.
2010 census
As of the 2010 census, there were 63,797 people, 24,464 households, and 16,641 families living in the county.[13] The population density was 9.6 inhabitants per square mile (3.7/km2). There were 30,992 housing units at an average density of 4.7 per square mile (1.8/km2).[14] The racial makeup of the county was 72.7% white, 6.7% American Indian, 3.5% black or African American, 1.2% Asian, 0.2% Pacific islander, 11.5% from other races, and 4.2% from two or more races. Those of Hispanic or Latino origin made up 34.5% of the population.[13] In terms of ancestry, 13.4% were German, 8.1% were English, 8.0% were Irish, and 4.4% were American.[15]
Of the 24,464 households, 33.3% had children under the age of 18 living with them, 50.2% were married couples living together, 12.7% had a female householder with no husband present, 32.0% were non-families, and 27.1% of all households were made up of individuals. The average household size was 2.51 and the average family size was 3.05. The median age was 36.5 years.[13]
The median income for a household in the county was $39,615 and the median income for a family was $46,210. Males had a median income of $32,939 versus $25,965 for females. The per capita income for the county was $19,255. About 15.2% of families and 20.0% of the population were below the poverty line, including 28.0% of those under age 18 and 13.5% of those age 65 or over.[16]
Other places
Politics and government
Governance of the county is under a three-member county commission.[17]
In early 2021 Commissioner Couy Griffin,[18] a former street preacher[19] with a record of extreme political statements, banned from entering the sizable Mescalero Apache Reservation in his own jurisdiction,[20] participated in the storming of the United States Capitol on January 6th. Griffin was charged with two federal crimes for his involvement.[21] On January 19th the other two commissioners called for his resignation.[20] They joined New Mexico Attorney General Hector Balderas, who had also called on Griffin to resign for neglecting his duties, for using his office for personal gain, and for his role in the attack.[21]
| Year | Republican | Democratic | Third parties |
|---|---|---|---|
| 2016 | 59.3% 11,887 | 30.5% 6,124 | 10.2% 2,049 |
| 2012 | 62.2% 12,451 | 34.1% 6,829 | 3.7% 732 |
| 2008 | 58.8% 12,806 | 39.6% 8,610 | 1.6% 350 |
| 2004 | 67.7% 14,066 | 31.0% 6,433 | 1.3% 265 |
| 2000 | 63.3% 10,258 | 33.7% 5,465 | 3.0% 481 |
| 1996 | 55.5% 9,065 | 36.4% 5,938 | 8.2% 1,334 |
| 1992 | 46.2% 7,481 | 33.2% 5,377 | 20.6% 3,345 |
| 1988 | 64.5% 9,984 | 34.1% 5,284 | 1.4% 210 |
| 1984 | 69.2% 9,751 | 29.6% 4,167 | 1.2% 169 |
| 1980 | 60.3% 7,210 | 34.4% 4,111 | 5.4% 644 |
| 1976 | 52.1% 5,914 | 47.0% 5,333 | 0.9% 105 |
| 1972 | 65.9% 7,033 | 27.9% 2,981 | 6.2% 656 |
| 1968 | 43.8% 4,475 | 38.9% 3,978 | 17.3% 1,771 |
| 1964 | 36.6% 3,498 | 63.1% 6,035 | 0.3% 27 |
| 1960 | 47.8% 4,507 | 52.2% 4,916 | 0.0% 3 |
| 1956 | 60.5% 3,919 | 39.5% 2,558 | 0.1% 6 |
| 1952 | 53.2% 2,456 | 46.8% 2,162 | 0.0% 2 |
| 1948 | 36.3% 1,354 | 63.3% 2,361 | 0.5% 18 |
| 1944 | 43.6% 1,467 | 56.3% 1,892 | 0.1% 3 |
| 1940 | 47.1% 1,596 | 52.8% 1,788 | 0.2% 5 |
| 1936 | 39.7% 1,333 | 59.3% 1,989 | 1.0% 33 |
| 1932 | 31.0% 969 | 66.9% 2,091 | 2.1% 67 |
| 1928 | 51.9% 1,250 | 47.7% 1,148 | 0.4% 10 |
| 1924 | 41.2% 832 | 43.8% 886 | 15.0% 303 |
| 1920 | 51.4% 1,229 | 45.8% 1,095 | 2.9% 69 |
| 1916 | 37.0% 561 | 54.4% 824 | 8.6% 130 |
| 1912 | 21.9% 220 | 41.8% 420 | 36.4% 366 |
References
- "State & County QuickFacts". United States Census Bureau. Archived from the original on June 6, 2011. Retrieved September 30, 2013.
- "Find a County". National Association of Counties. Retrieved June 7, 2011.
- Thompson, Mark. "Miguel Otero: Father, Son, and Grandson". New Mexico Office of the State Historian. Retrieved September 13, 2018.
- "Alamogordo, NM Micropolitan Statistical Area" (PDF). US Census Bureau. December 2006. Retrieved September 9, 2009.
- Burnett, John (April 26, 2019). "New Mexico County Declares Local Emergency Over Abandoned Border Patrol Checkpoints". NPR News. Retrieved April 27, 2019.
- "2010 Census Gazetteer Files". United States Census Bureau. August 22, 2012. Archived from the original on January 1, 2015. Retrieved January 2, 2015.
- "Population and Housing Unit Estimates". Retrieved December 23, 2019.
- "U.S. Decennial Census". United States Census Bureau. Retrieved January 2, 2015.
- "Historical Census Browser". University of Virginia Library. Retrieved January 2, 2015.
- "Population of Counties by Decennial Census: 1900 to 1990". United States Census Bureau. Retrieved January 2, 2015.
- "Census 2000 PHC-T-4. Ranking Tables for Counties: 1990 and 2000" (PDF). United States Census Bureau. Retrieved January 2, 2015.
- "U.S. Census website". United States Census Bureau. Retrieved January 31, 2008.
- "DP-1 Profile of General Population and Housing Characteristics: 2010 Demographic Profile Data". United States Census Bureau. Archived from the original on February 13, 2020. Retrieved January 24, 2016.
- "Population, Housing Units, Area, and Density: 2010 - County". United States Census Bureau. Archived from the original on February 13, 2020. Retrieved January 24, 2016.
- "DP02 SELECTED SOCIAL CHARACTERISTICS IN THE UNITED STATES – 2006-2010 American Community Survey 5-Year Estimates". United States Census Bureau. Archived from the original on February 13, 2020. Retrieved January 24, 2016.
- "DP03 SELECTED ECONOMIC CHARACTERISTICS – 2006-2010 American Community Survey 5-Year Estimates". United States Census Bureau. Archived from the original on February 13, 2020. Retrieved January 24, 2016.
- "Government" Otero County website
- "Couy Griffin". County of Otero New Mexico. Retrieved January 29, 2021.
- Simonich, Milan (May 21, 2020). "He's king of the cowboys and self-promotion". Santa Fe New Mexican. Retrieved January 29, 2021.
- "2 Otero County Commissioners call for resignation of Couy Griffin". KQRE. Retrieved January 29, 2021.
- "FBI: Cowboys for Trump founder taken into custody in connection to Capitol riots". KOB. January 17, 2021. Retrieved January 29, 2021.
- Leip, David. "Dave Leip's Atlas of U.S. Presidential Elections". uselectionatlas.org. Retrieved April 1, 2018.
Further reading
- Sites Southwest LLC & Bohannan Huston Inc. (October 2005). Otero County Comprehensive Plan (PDF) (Report). County of Otero. Archived from the original (PDF) on July 24, 2011. Retrieved August 31, 2009.
Places adjacent to Otero County, New Mexico | ||||||||||
|---|---|---|---|---|---|---|---|---|---|---|
| ||||||||||
Municipalities and communities of Otero County, New Mexico, United States | ||
|---|---|---|
| City | Map of New Mexico highlighting Otero County | |
| Villages | ||
| CDPs | ||
| Other unincorporated communities | ||
| Indian reservation | ||
| Footnotes | ‡This populated place also has portions in an adjacent county or counties | |
| ||
Santa Fe (capital) | ||
| Topics |
| |
| Society | ||
| Regions |
| |
| Cities | ||
| Counties | ||
| Authority control |
|---|