1976 United States presidential election in Florida
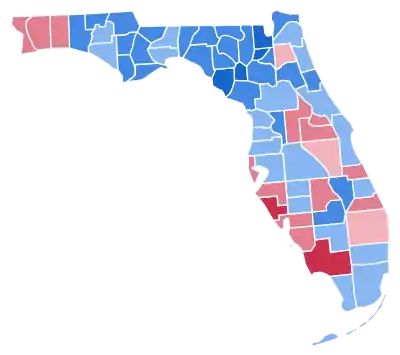
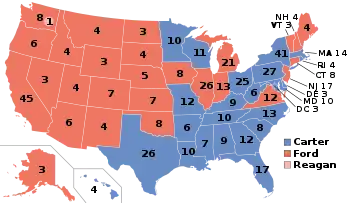
In the 1976 United States presidential election, Florida was won by the Democratic candidate, former Governor of Georgia Jimmy Carter, over the Republican candidate, incumbent President Gerald Ford. Carter won by a margin of 5.29%, giving him 17 electoral votes. Carter did particularly well in the South, with Arkansas and his home state of Georgia giving him particularly large margins.[1] Florida, together with other growing Southern states such as Virginia (which he narrowly lost) and Texas, however, were more competitive, as Ford did well in many growing counties in the South, in many cases largely inhabited by transplants. In Florida, Ford did well in coastal southwestern Florida, most of which had turned Republican as early as the late 1940s and had stuck with Goldwater in 1964. He also carried the large, then-typically Republican counties of Orange, Palm Beach, and Pinellas, although by narrow margins in the latter two cases. Carter carried the home counties of Miami (Dade), Tampa (Hillsborough), and Jacksonville (Duval) by healthy margins, and dominated rural Florida. He also became the first Democrat to win Broward County since 1944.
| ||||||||||||||||||||||||||
| Turnout | ||||||||||||||||||||||||||
|---|---|---|---|---|---|---|---|---|---|---|---|---|---|---|---|---|---|---|---|---|---|---|---|---|---|---|
| ||||||||||||||||||||||||||
 County Results
| ||||||||||||||||||||||||||
| ||||||||||||||||||||||||||
.jpg.webp)

| Elections in Florida |
|---|
 |
|
|
One region which Carter was unable to reclaim for the Democrats was the far western part of the Panhandle; he became the second Democrat (after Johnson in 1964) to win the White House without Okaloosa County since its founding in 1915; the second (after Johnson) since 1856 to win without Santa Rosa County; and the second ever (after Johnson) to win without Escambia County.[2]
A bellwether state today, Florida has voted for the winner in every election since 1928, except for three elections (1960, 1992, and 2020). As of the 2020 presidential election, this is the last election in which Polk County, Brevard County, Marion County, Bay County, Holmes County, Washington County, DeSoto County, Hardee County, Nassau County, St. Johns County, and Walton County voted for a Democratic presidential candidate. [3] As of the 2020 presidential election, this is the last time Florida voted more Democratic than the national average. It was also the last election in which Duval County voted for the Democratic candidate until Joe Biden won it in 2020.
Results
| Presidential candidate | Party | Home state | Popular vote | Electoral vote |
Running mate | |||
|---|---|---|---|---|---|---|---|---|
| Count | Percentage | Vice-presidential candidate | Home state | Electoral vote | ||||
| Jimmy Carter | Democratic | Georgia | 1,636,000 | 51.93% | 17 | Walter Mondale | Minnesota | 17 |
| Gerald Ford | Republican | Michigan | 1,469,531 | 46.64% | 0 | Bob Dole | Kansas | 0 |
| Eugene McCarthy | Independent | Minnesota | 23,643 | 0.75% | 0 | Sharon Stone Kilpatrick | Virginia | 0 |
| Thomas J. Anderson | American | Tennessee | 21,325 | 0.68% | 0 | Rufus Shackelford | Florida | 0 |
| Roger MacBride | Libertarian | Virginia | 103 | 0.00% | 0 | David Bergland | California | 0 |
| Julius Levin | Socialist Labor | New Jersey | 19 | 0.00% | 0 | Constance Blomen | Massachusetts | 0 |
| Frank Zeidler | Socialist | Wisconsin | 8 | 0.00% | 0 | J. Quinn Brisben | Illinois | 0 |
| Ernest Miller | Write-in | — | 2 | 0.00% | 0 | — | — | 0 |
| Total | 3,150,631 | 100% | 17 | 17 | ||||
| Needed to win | 270 | 270 | ||||||
Results by county
| James Earl Carter Democratic |
Gerald Rudolph Ford Republican |
Various candidates Other parties |
Margin | Total votes cast | |||||
|---|---|---|---|---|---|---|---|---|---|
| County | # | % | # | % | # | % | # | % | # |
| Alachua | 27,895 | 62.58% | 15,546 | 34.87% | 1,137 | 2.55% | 12,349 | 27.70% | 44,578 |
| Baker | 2,985 | 71.16% | 1,058 | 25.22% | 152 | 3.62% | 1,927 | 45.94% | 4,195 |
| Bay | 14,858 | 50.39% | 14,208 | 48.19% | 418 | 1.42% | 650 | 2.20% | 29,484 |
| Bradford | 3,868 | 68.86% | 1,680 | 29.91% | 69 | 1.23% | 2,188 | 38.95% | 5,617 |
| Brevard | 46,421 | 50.26% | 44,470 | 48.15% | 1,473 | 1.59% | 1,951 | 2.11% | 92,364 |
| Broward | 176,491 | 51.55% | 161,411 | 47.15% | 4,441 | 1.30% | 15,080 | 4.40% | 342,343 |
| Calhoun | 2,487 | 67.42% | 1,153 | 31.26% | 49 | 1.33% | 1,334 | 36.16% | 3,689 |
| Charlotte | 10,300 | 44.14% | 12,703 | 54.44% | 330 | 1.41% | -2,403 | -10.30% | 23,333 |
| Citrus | 9,438 | 53.30% | 7,973 | 45.03% | 296 | 1.67% | 1,465 | 8.27% | 17,707 |
| Clay | 8,410 | 49.04% | 8,468 | 49.38% | 270 | 1.57% | -58 | -0.34% | 17,148 |
| Collier | 8,764 | 36.96% | 14,643 | 61.76% | 303 | 1.28% | -5,879 | -24.80% | 23,710 |
| Columbia | 6,683 | 62.08% | 3,947 | 36.66% | 136 | 1.26% | 2,736 | 25.41% | 10,766 |
| Dade | 303,047 | 58.06% | 211,148 | 40.45% | 7,747 | 1.48% | 91,899 | 17.61% | 521,942 |
| Desoto | 2,715 | 56.30% | 2,000 | 41.48% | 107 | 2.22% | 715 | 14.83% | 4,822 |
| Dixie | 2,169 | 78.82% | 558 | 20.28% | 25 | 0.91% | 1,611 | 58.54% | 2,752 |
| Duval | 105,912 | 58.01% | 74,997 | 41.08% | 1,652 | 0.90% | 30,915 | 16.93% | 182,561 |
| Escambia | 38,279 | 47.42% | 41,471 | 51.38% | 965 | 1.20% | -3,192 | -3.95% | 80,715 |
| Flagler | 2,086 | 61.84% | 1,262 | 37.41% | 25 | 0.74% | 824 | 24.43% | 3,373 |
| Franklin | 1,859 | 62.53% | 1,054 | 35.45% | 60 | 2.02% | 805 | 27.08% | 2,973 |
| Gadsden | 6,798 | 65.17% | 3,531 | 33.85% | 102 | 0.98% | 3,267 | 31.32% | 10,431 |
| Gilchrist | 1,807 | 76.76% | 528 | 22.43% | 19 | 0.81% | 1,279 | 54.33% | 2,354 |
| Glades | 1,311 | 66.72% | 624 | 31.76% | 30 | 1.53% | 687 | 34.96% | 1,965 |
| Gulf | 2,641 | 61.69% | 1,584 | 37.00% | 56 | 1.31% | 1,057 | 24.69% | 4,281 |
| Hamilton | 2,053 | 69.57% | 794 | 26.91% | 104 | 3.52% | 1,259 | 42.66% | 2,951 |
| Hardee | 2,670 | 52.28% | 2,189 | 42.86% | 248 | 4.86% | 481 | 9.42% | 5,107 |
| Hendry | 2,337 | 54.94% | 1,843 | 43.32% | 74 | 1.74% | 494 | 11.61% | 4,254 |
| Hernando | 7,717 | 56.20% | 5,793 | 42.19% | 222 | 1.62% | 1,924 | 14.01% | 13,732 |
| Highlands | 7,218 | 45.88% | 8,317 | 52.86% | 198 | 1.26% | -1,099 | -6.99% | 15,733 |
| Hillsborough | 94,589 | 54.01% | 78,504 | 44.82% | 2,052 | 1.17% | 16,085 | 9.18% | 175,145 |
| Holmes | 3,256 | 62.86% | 1,850 | 35.71% | 74 | 1.43% | 1,406 | 27.14% | 5,180 |
| Indian River | 8,512 | 45.63% | 9,818 | 52.63% | 324 | 1.74% | -1,306 | -7.00% | 18,654 |
| Jackson | 7,687 | 60.76% | 4,795 | 37.90% | 170 | 1.34% | 2,892 | 22.86% | 12,652 |
| Jefferson | 2,310 | 61.62% | 1,361 | 36.30% | 78 | 2.08% | 949 | 25.31% | 3,749 |
| Lafayette | 1,126 | 67.63% | 523 | 31.41% | 16 | 0.96% | 603 | 36.22% | 1,665 |
| Lake | 14,369 | 41.31% | 19,976 | 57.42% | 442 | 1.27% | -5,607 | -16.12% | 34,787 |
| Lee | 30,567 | 43.80% | 38,038 | 54.50% | 1,184 | 1.70% | -7,471 | -10.71% | 69,789 |
| Leon | 28,729 | 53.76% | 23,739 | 44.42% | 975 | 1.82% | 4,990 | 9.34% | 53,443 |
| Levy | 4,025 | 65.28% | 1,965 | 31.87% | 176 | 2.85% | 2,060 | 33.41% | 6,166 |
| Liberty | 1,137 | 64.02% | 620 | 34.91% | 19 | 1.07% | 517 | 29.11% | 1,776 |
| Madison | 3,218 | 63.85% | 1,761 | 34.94% | 61 | 1.21% | 1,457 | 28.91% | 5,040 |
| Manatee | 24,342 | 44.78% | 29,300 | 53.90% | 718 | 1.32% | -4,958 | -9.12% | 54,360 |
| Marion | 16,963 | 50.37% | 16,163 | 47.99% | 553 | 1.64% | 800 | 2.38% | 33,679 |
| Martin | 8,785 | 42.33% | 11,682 | 56.28% | 289 | 1.39% | -2,897 | -13.96% | 20,756 |
| Monroe | 11,079 | 56.08% | 8,232 | 41.67% | 446 | 2.26% | 2,847 | 14.41% | 19,757 |
| Nassau | 5,896 | 64.51% | 3,136 | 34.31% | 108 | 1.18% | 2,760 | 30.20% | 9,140 |
| Okaloosa | 14,210 | 42.68% | 18,598 | 55.86% | 487 | 1.46% | -4,388 | -13.18% | 33,295 |
| Okeechobee | 3,184 | 65.99% | 1,598 | 33.12% | 43 | 0.89% | 1,586 | 32.87% | 4,825 |
| Orange | 58,442 | 44.80% | 70,451 | 54.01% | 1,544 | 1.18% | -12,009 | -9.21% | 130,437 |
| Osceola | 6,893 | 48.63% | 7,062 | 49.82% | 220 | 1.55% | -169 | -1.19% | 14,175 |
| Palm Beach | 96,705 | 48.68% | 98,236 | 49.45% | 3,716 | 1.87% | -1,531 | -0.77% | 198,657 |
| Pasco | 33,710 | 53.72% | 28,306 | 45.11% | 731 | 1.16% | 5,404 | 8.61% | 62,747 |
| Pinellas | 141,879 | 48.00% | 150,003 | 50.75% | 3,687 | 1.25% | -8,124 | -2.75% | 295,569 |
| Polk | 47,286 | 51.01% | 44,238 | 47.72% | 1,182 | 1.27% | 3,048 | 3.29% | 92,706 |
| Putnam | 9,597 | 64.81% | 5,040 | 34.03% | 172 | 1.16% | 4,557 | 30.77% | 14,809 |
| St. Johns | 7,412 | 51.58% | 6,660 | 46.34% | 299 | 2.08% | 752 | 5.23% | 14,371 |
| St. Lucie | 12,386 | 51.16% | 11,502 | 47.51% | 321 | 1.33% | 884 | 3.65% | 24,209 |
| Santa Rosa | 8,020 | 46.06% | 9,122 | 52.39% | 270 | 1.55% | -1,102 | -6.33% | 17,412 |
| Sarasota | 26,293 | 36.78% | 44,157 | 61.78% | 1,028 | 1.44% | -17,864 | -24.99% | 71,478 |
| Seminole | 19,609 | 41.89% | 26,655 | 56.94% | 549 | 1.17% | -7,046 | -15.05% | 46,813 |
| Sumter | 4,721 | 66.59% | 2,212 | 31.20% | 157 | 2.21% | 2,509 | 35.39% | 7,090 |
| Suwannee | 4,718 | 63.74% | 2,405 | 32.49% | 279 | 3.77% | 2,313 | 31.25% | 7,402 |
| Taylor | 3,370 | 62.34% | 1,983 | 36.68% | 53 | 0.98% | 1,387 | 25.66% | 5,406 |
| Union | 1,480 | 72.55% | 544 | 26.67% | 16 | 0.78% | 936 | 45.88% | 2,040 |
| Volusia | 49,161 | 55.72% | 37,523 | 42.53% | 1,541 | 1.75% | 11,638 | 13.19% | 88,225 |
| Wakulla | 2,353 | 57.78% | 1,580 | 38.80% | 139 | 3.41% | 773 | 18.98% | 4,072 |
| Walton | 5,196 | 62.76% | 2,927 | 35.35% | 156 | 1.88% | 2,269 | 27.41% | 8,279 |
| Washington | 3,566 | 59.47% | 2,313 | 38.58% | 117 | 1.95% | 1,253 | 20.90% | 5,996 |
| Totals | 1,636,000 | 51.93% | 1,469,531 | 46.64% | 45,100 | 1.43% | 166,469 | 5.28% | 3,150,631 |
References
- Dave Leip's U.S. Election Atlas; 1976 Presidential General Election Results – Florida
- "County winners, 1836-2016". Google Docs. Retrieved 2021-01-22.
- Sullivan, Robert David; ‘How the Red and Blue Map Evolved Over the Past Century’; America Magazine in The National Catholic Review; June 29, 2016
| |
|