1976 United States presidential election in Kansas
The 1976 United States presidential election in Kansas took place on November 2, 1976, as part of the 1976 United States presidential election. Kansas voters chose seven representatives, or electors, to the Electoral College, who voted for president and vice president.
| ||||||||||||||||||||||||||
| ||||||||||||||||||||||||||
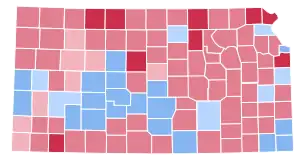
 County Results
| ||||||||||||||||||||||||||
| ||||||||||||||||||||||||||
| Elections in Kansas |
|---|
 |
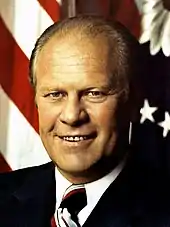
Kansas was won by incumbent President Gerald Ford (R–Michigan). with 52.49% of the popular vote, against Jimmy Carter (D–Georgia), with 44.94% of the popular vote.[1] None of the third-party candidates amounted to a significant portion of the vote, but Eugene McCarthy (I–Minnesota) won 1.38% of the popular vote in Kansas, finishing third in the state.
Ford's running mate was Bob Dole, Kansas' junior U.S. Senator since 1969. Dole, a native of Russell, was previously the U.S. Representative from Kansas's 1st congressional district from 1963-68 after representing the defunct 6th district for one term.
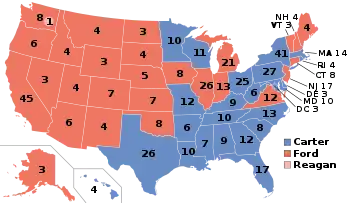
Despite losing in Kansas, Carter went on to win the national election and became the 39th president of the United States. As of the 2020 presidential election, this is the last election in which the following counties have voted for a Democratic presidential candidate: Anderson, Butler, Cloud, Edwards, Finney, Ford, Gray, Greeley, Hamilton, Hodgeman, Kingman, Ness, Pawnee, Reno, Rice, Rush, Stafford, Sumner, and Wichita.[2]
| Party | Candidate | Votes | % | |
|---|---|---|---|---|
| Republican | Gerald Ford (inc.) | 502,752 | 52.49% | |
| Democratic | Jimmy Carter | 430,421 | 44.94% | |
| Independent | Eugene McCarthy | 13,185 | 1.38% | |
| American | Thomas Anderson | 4,724 | 0.49% | |
| Libertarian | Roger MacBride | 3,242 | 0.34% | |
| Conservative | Lester Maddox | 2,118 | 0.22% | |
| Prohibition | Benjamin Bubar | 1,403 | 0.15% | |
| Total votes | 957,845 | 100% | ||
Results by county
| County | Gerald Rudolph Ford Republican |
James Earl Carter Democratic |
Eugene Joseph McCarthy Independent[3] |
Thomas Jefferson Anderson American[3] |
Various candidates Other parties[3] |
Margin | Total votes cast | ||||||
|---|---|---|---|---|---|---|---|---|---|---|---|---|---|
| # | % | # | % | # | % | # | % | # | % | # | % | ||
| Allen | 3,269 | 53.23% | 2,746 | 44.72% | 67 | 1.09% | 25 | 0.41% | 34 | 0.55% | 523 | 8.52% | 6,141 |
| Anderson | 1,872 | 48.70% | 1,886 | 49.06% | 51 | 1.33% | 17 | 0.44% | 18 | 0.47% | -14 | -0.36% | 3,844 |
| Atchison | 4,030 | 48.30% | 4,108 | 49.23% | 142 | 1.70% | 35 | 0.42% | 29 | 0.35% | -78 | -0.93% | 8,344 |
| Barber | 1,568 | 50.43% | 1,494 | 48.05% | 27 | 0.87% | 8 | 0.26% | 12 | 0.39% | 74 | 2.38% | 3,109 |
| Barton | 7,311 | 55.63% | 5,497 | 41.83% | 174 | 1.32% | 84 | 0.64% | 76 | 0.58% | 1,814 | 13.80% | 13,142 |
| Bourbon | 3,589 | 51.80% | 3,237 | 46.72% | 44 | 0.64% | 28 | 0.40% | 31 | 0.45% | 352 | 5.08% | 6,929 |
| Brown | 3,407 | 64.96% | 1,745 | 33.27% | 51 | 0.97% | 17 | 0.32% | 25 | 0.48% | 1,662 | 31.69% | 5,245 |
| Butler | 8,390 | 48.45% | 8,540 | 49.32% | 173 | 1.00% | 107 | 0.62% | 106 | 0.61% | -150 | -0.87% | 17,316 |
| Chase | 922 | 57.59% | 643 | 40.16% | 18 | 1.12% | 10 | 0.62% | 8 | 0.50% | 279 | 17.43% | 1,601 |
| Chautauqua | 1,159 | 55.77% | 866 | 41.67% | 27 | 1.30% | 17 | 0.82% | 9 | 0.43% | 293 | 14.10% | 2,078 |
| Cherokee | 3,957 | 42.93% | 5,154 | 55.91% | 55 | 0.60% | 18 | 0.20% | 34 | 0.37% | -1,197 | -12.99% | 9,218 |
| Cheyenne | 1,008 | 55.84% | 758 | 41.99% | 19 | 1.05% | 10 | 0.55% | 10 | 0.55% | 250 | 13.85% | 1,805 |
| Clark | 761 | 51.80% | 680 | 46.29% | 13 | 0.88% | 9 | 0.61% | 6 | 0.41% | 81 | 5.51% | 1,469 |
| Clay | 3,085 | 63.85% | 1,610 | 33.32% | 57 | 1.18% | 20 | 0.41% | 60 | 1.24% | 1,475 | 30.53% | 4,832 |
| Cloud | 2,954 | 48.74% | 2,976 | 49.10% | 55 | 0.91% | 18 | 0.30% | 58 | 0.96% | -22 | -0.36% | 6,061 |
| Coffey | 2,145 | 56.70% | 1,549 | 40.95% | 48 | 1.27% | 23 | 0.61% | 18 | 0.48% | 596 | 15.75% | 3,783 |
| Comanche | 719 | 52.71% | 630 | 46.19% | 8 | 0.59% | 1 | 0.07% | 6 | 0.44% | 89 | 6.52% | 1,364 |
| Cowley | 7,513 | 50.32% | 7,095 | 47.52% | 152 | 1.02% | 76 | 0.51% | 95 | 0.64% | 418 | 2.80% | 14,931 |
| Crawford | 7,225 | 43.78% | 9,021 | 54.66% | 133 | 0.81% | 37 | 0.22% | 88 | 0.53% | -1,796 | -10.88% | 16,504 |
| Decatur | 1,232 | 52.74% | 1,011 | 43.28% | 36 | 1.54% | 32 | 1.37% | 25 | 1.07% | 221 | 9.46% | 2,336 |
| Dickinson | 4,759 | 55.23% | 3,672 | 42.61% | 103 | 1.20% | 38 | 0.44% | 45 | 0.52% | 1,087 | 12.61% | 8,617 |
| Doniphan | 2,469 | 62.21% | 1,428 | 35.98% | 29 | 0.73% | 12 | 0.30% | 31 | 0.78% | 1,041 | 26.23% | 3,969 |
| Douglas | 14,277 | 51.28% | 11,922 | 42.82% | 1,358 | 4.88% | 115 | 0.41% | 170 | 0.61% | 2,355 | 8.46% | 27,842 |
| Edwards | 1,001 | 42.47% | 1,304 | 55.32% | 26 | 1.25% | 9 | 0.43% | 17 | 0.81% | -303 | -12.86% | 2,357 |
| Elk | 1,087 | 54.84% | 865 | 43.64% | 12 | 0.61% | 6 | 0.30% | 12 | 0.61% | 222 | 11.20% | 1,982 |
| Ellis | 4,719 | 41.98% | 6,280 | 55.87% | 157 | 1.40% | 38 | 0.34% | 46 | 0.41% | -1,561 | -13.89% | 11,240 |
| Ellsworth | 1,618 | 49.85% | 1,573 | 48.46% | 28 | 0.86% | 14 | 0.43% | 13 | 0.40% | 45 | 1.39% | 3,246 |
| Finney | 3,711 | 48.40% | 3,813 | 49.73% | 68 | 0.89% | 37 | 0.48% | 38 | 0.50% | -102 | -1.33% | 7,667 |
| Ford | 4,679 | 47.61% | 4,934 | 50.21% | 114 | 1.16% | 29 | 0.30% | 71 | 0.72% | -255 | -2.59% | 9,827 |
| Franklin | 4,760 | 55.49% | 3,607 | 42.05% | 120 | 1.40% | 33 | 0.38% | 58 | 0.68% | 1,153 | 13.44% | 8,578 |
| Geary | 3,230 | 52.13% | 2,843 | 45.88% | 61 | 0.98% | 15 | 0.24% | 47 | 0.76% | 387 | 6.25% | 6,196 |
| Gove | 860 | 48.95% | 848 | 48.26% | 33 | 1.88% | 4 | 0.23% | 12 | 0.68% | 12 | 0.68% | 1,757 |
| Graham | 1,112 | 53.26% | 936 | 44.83% | 22 | 1.05% | 4 | 0.19% | 14 | 0.67% | 176 | 8.43% | 2,088 |
| Grant | 1,226 | 50.62% | 1,151 | 47.52% | 21 | 0.87% | 7 | 0.29% | 17 | 0.70% | 75 | 3.10% | 2,422 |
| Gray | 837 | 42.08% | 1,111 | 55.86% | 23 | 1.16% | 5 | 0.25% | 13 | 0.65% | -274 | -13.78% | 1,989 |
| Greeley | 389 | 43.42% | 479 | 53.46% | 14 | 1.56% | 5 | 0.56% | 9 | 1.00% | -90 | -10.04% | 896 |
| Greenwood | 2,319 | 55.96% | 1,737 | 41.92% | 23 | 0.56% | 44 | 1.06% | 21 | 0.51% | 582 | 14.04% | 4,144 |
| Hamilton | 560 | 41.70% | 746 | 55.55% | 8 | 0.60% | 20 | 1.49% | 9 | 0.67% | -186 | -13.85% | 1,343 |
| Harper | 1,777 | 50.00% | 1,681 | 47.30% | 29 | 0.82% | 35 | 0.98% | 32 | 0.90% | 96 | 2.70% | 3,554 |
| Harvey | 6,624 | 51.00% | 6,003 | 46.22% | 173 | 1.33% | 92 | 0.71% | 95 | 0.73% | 621 | 4.78% | 12,987 |
| Haskell | 761 | 51.98% | 676 | 46.17% | 13 | 0.89% | 4 | 0.27% | 10 | 0.68% | 85 | 5.81% | 1,464 |
| Hodgeman | 576 | 43.80% | 697 | 53.00% | 24 | 1.83% | 7 | 0.53% | 11 | 0.84% | -121 | -9.20% | 1,315 |
| Jackson | 2,725 | 54.85% | 2,129 | 42.85% | 48 | 0.97% | 30 | 0.60% | 36 | 0.72% | 596 | 12.00% | 4,968 |
| Jefferson | 3,225 | 55.12% | 2,470 | 42.22% | 84 | 1.44% | 40 | 0.68% | 32 | 0.55% | 755 | 12.90% | 5,851 |
| Jewell | 1,592 | 57.47% | 1,111 | 40.11% | 29 | 1.05% | 11 | 0.40% | 27 | 0.97% | 481 | 17.36% | 2,770 |
| Johnson | 75,798 | 66.41% | 35,605 | 31.19% | 1,740 | 1.52% | 364 | 0.32% | 635 | 0.56% | 40,193 | 35.21% | 114,142 |
| Kearny | 674 | 48.95% | 658 | 47.79% | 22 | 1.60% | 10 | 0.73% | 13 | 0.94% | 16 | 1.16% | 1,377 |
| Kingman | 1,839 | 44.93% | 2,142 | 52.33% | 69 | 1.69% | 16 | 0.39% | 27 | 0.66% | -303 | -7.40% | 4,093 |
| Kiowa | 1,180 | 59.48% | 764 | 38.51% | 19 | 0.96% | 6 | 0.30% | 15 | 0.76% | 416 | 20.97% | 1,984 |
| Labette | 4,640 | 45.59% | 5,294 | 52.02% | 127 | 1.25% | 59 | 0.58% | 57 | 0.56% | -654 | -6.43% | 10,177 |
| Lane | 651 | 48.91% | 646 | 48.53% | 12 | 0.90% | 8 | 0.60% | 14 | 1.05% | 5 | 0.38% | 1,331 |
| Leavenworth | 8,407 | 50.11% | 8,022 | 47.81% | 212 | 1.26% | 70 | 0.42% | 67 | 0.40% | 385 | 2.29% | 16,778 |
| Lincoln | 1,225 | 54.52% | 985 | 43.84% | 23 | 1.02% | 3 | 0.13% | 11 | 0.49% | 240 | 10.68% | 2,247 |
| Linn | 1,873 | 52.00% | 1,681 | 46.67% | 23 | 0.64% | 7 | 0.19% | 18 | 0.50% | 192 | 5.33% | 3,602 |
| Logan | 957 | 56.39% | 694 | 40.90% | 15 | 0.88% | 20 | 1.18% | 11 | 0.65% | 263 | 15.50% | 1,697 |
| Lyon | 7,062 | 52.59% | 5,634 | 41.96% | 232 | 1.73% | 446 | 3.32% | 54 | 0.40% | 1,428 | 10.63% | 13,428 |
| Marion | 3,226 | 50.72% | 3,004 | 47.23% | 71 | 1.12% | 16 | 0.25% | 43 | 0.68% | 222 | 3.49% | 6,360 |
| Marshall | 6,187 | 52.17% | 5,366 | 45.24% | 158 | 1.33% | 44 | 0.37% | 105 | 0.89% | 821 | 6.92% | 11,860 |
| McPherson | 3,519 | 57.31% | 2,483 | 40.44% | 63 | 1.03% | 31 | 0.50% | 44 | 0.72% | 1,036 | 16.87% | 6,140 |
| Meade | 1,109 | 51.53% | 983 | 45.68% | 20 | 0.93% | 10 | 0.46% | 30 | 1.39% | 126 | 5.86% | 2,152 |
| Miami | 3,999 | 48.67% | 4,000 | 48.69% | 125 | 1.52% | 45 | 0.55% | 47 | 0.57% | -1 | -0.01% | 8,216 |
| Mitchell | 2,095 | 53.99% | 1,700 | 43.81% | 51 | 1.31% | 14 | 0.36% | 20 | 0.52% | 395 | 10.18% | 3,880 |
| Montgomery | 8,864 | 54.08% | 7,157 | 43.66% | 122 | 0.74% | 161 | 0.98% | 87 | 0.53% | 1,707 | 10.41% | 16,391 |
| Morris | 1,698 | 54.74% | 1,337 | 43.10% | 32 | 1.03% | 15 | 0.48% | 20 | 0.64% | 361 | 11.64% | 3,102 |
| Morton | 738 | 48.91% | 735 | 48.71% | 20 | 1.33% | 5 | 0.33% | 11 | 0.73% | 3 | 0.20% | 1,509 |
| Nemaha | 2,759 | 50.71% | 2,586 | 47.53% | 63 | 1.16% | 13 | 0.24% | 20 | 0.37% | 173 | 3.18% | 5,441 |
| Neosho | 4,038 | 50.32% | 3,842 | 47.88% | 79 | 0.98% | 38 | 0.47% | 27 | 0.34% | 196 | 2.44% | 8,024 |
| Ness | 1,016 | 46.52% | 1,106 | 50.64% | 28 | 1.28% | 13 | 0.60% | 21 | 0.96% | -90 | -4.12% | 2,184 |
| Norton | 2,201 | 60.55% | 1,337 | 36.78% | 44 | 1.21% | 26 | 0.72% | 27 | 0.74% | 864 | 23.77% | 3,635 |
| Osage | 2,945 | 50.53% | 2,755 | 47.27% | 61 | 1.04% | 31 | 0.53% | 36 | 0.62% | 190 | 3.26% | 5,828 |
| Osborne | 1,574 | 55.42% | 1,190 | 41.90% | 28 | 0.99% | 17 | 0.60% | 31 | 1.09% | 384 | 13.52% | 2,840 |
| Ottawa | 1,629 | 52.86% | 1,393 | 45.20% | 37 | 1.20% | 6 | 0.19% | 17 | 0.55% | 236 | 7.66% | 3,082 |
| Pawnee | 1,692 | 45.11% | 1,959 | 52.23% | 47 | 1.25% | 12 | 0.32% | 41 | 1.09% | -267 | -7.12% | 3,751 |
| Phillips | 2,317 | 63.05% | 1,264 | 34.39% | 48 | 1.31% | 28 | 0.76% | 18 | 0.49% | 1,053 | 28.65% | 3,675 |
| Pottawatomie | 3,483 | 59.06% | 2,316 | 39.27% | 59 | 1.00% | 17 | 0.29% | 22 | 0.37% | 1,167 | 19.79% | 5,897 |
| Pratt | 2,427 | 50.04% | 2,307 | 47.57% | 61 | 1.26% | 11 | 0.23% | 44 | 0.91% | 120 | 2.47% | 4,850 |
| Rawlins | 1,148 | 53.87% | 903 | 42.37% | 42 | 1.97% | 22 | 1.03% | 16 | 0.75% | 245 | 11.50% | 2,131 |
| Reno | 11,212 | 42.29% | 14,620 | 55.14% | 333 | 1.26% | 107 | 0.40% | 240 | 0.91% | -3,408 | -12.85% | 26,512 |
| Republic | 2,294 | 57.44% | 1,617 | 40.49% | 47 | 1.18% | 13 | 0.33% | 23 | 0.58% | 677 | 16.95% | 3,994 |
| Rice | 2,584 | 44.82% | 3,056 | 53.01% | 64 | 1.11% | 19 | 0.33% | 42 | 0.73% | -472 | -8.19% | 5,765 |
| Riley | 9,518 | 57.45% | 6,540 | 39.47% | 394 | 2.38% | 34 | 0.21% | 82 | 0.49% | 2,978 | 17.97% | 16,568 |
| Rooks | 1,664 | 53.04% | 1,412 | 45.01% | 33 | 1.05% | 11 | 0.35% | 17 | 0.54% | 252 | 8.03% | 3,137 |
| Rush | 1,170 | 45.33% | 1,359 | 52.65% | 31 | 1.20% | 6 | 0.23% | 15 | 0.58% | -189 | -7.32% | 2,581 |
| Russell | 3,165 | 67.79% | 1,453 | 31.12% | 32 | 0.69% | 9 | 0.19% | 10 | 0.21% | 1,712 | 36.67% | 4,669 |
| Saline | 11,218 | 55.79% | 8,476 | 42.15% | 271 | 1.35% | 59 | 0.29% | 83 | 0.41% | 2,742 | 13.64% | 20,107 |
| Scott | 1,195 | 54.74% | 919 | 42.10% | 39 | 1.79% | 16 | 0.73% | 14 | 0.64% | 276 | 12.64% | 2,183 |
| Sedgwick | 69,828 | 50.74% | 63,989 | 46.49% | 1,616 | 1.17% | 723 | 0.53% | 1,473 | 1.07% | 5,839 | 4.24% | 137,629 |
| Seward | 3,604 | 64.19% | 1,907 | 33.96% | 59 | 1.05% | 11 | 0.20% | 34 | 0.61% | 1,697 | 30.22% | 5,615 |
| Shawnee | 37,101 | 55.07% | 28,578 | 42.42% | 995 | 1.48% | 288 | 0.43% | 408 | 0.61% | 8,523 | 12.65% | 67,370 |
| Sheridan | 838 | 49.15% | 793 | 46.51% | 48 | 2.82% | 11 | 0.65% | 15 | 0.88% | 45 | 2.64% | 1,705 |
| Sherman | 1,671 | 50.15% | 1,573 | 47.21% | 55 | 1.65% | 17 | 0.51% | 16 | 0.48% | 98 | 2.94% | 3,332 |
| Smith | 2,009 | 58.47% | 1,333 | 38.80% | 47 | 1.37% | 24 | 0.70% | 23 | 0.67% | 676 | 19.67% | 3,436 |
| Stafford | 1,430 | 45.22% | 1,659 | 52.47% | 32 | 1.01% | 7 | 0.22% | 34 | 1.08% | -229 | -7.24% | 3,162 |
| Stanton | 510 | 49.04% | 489 | 47.02% | 14 | 1.35% | 14 | 1.35% | 13 | 1.25% | 21 | 2.02% | 1,040 |
| Stevens | 1,262 | 57.23% | 901 | 40.86% | 24 | 1.09% | 10 | 0.45% | 8 | 0.36% | 361 | 16.37% | 2,205 |
| Sumner | 4,645 | 44.92% | 5,385 | 52.08% | 138 | 1.33% | 87 | 0.84% | 85 | 0.82% | -740 | -7.16% | 10,340 |
| Thomas | 2,246 | 53.94% | 1,802 | 43.28% | 60 | 1.44% | 26 | 0.62% | 30 | 0.72% | 444 | 10.66% | 4,164 |
| Trego | 1,025 | 49.56% | 1,003 | 48.50% | 25 | 1.21% | 8 | 0.39% | 7 | 0.34% | 22 | 1.06% | 2,068 |
| Wabaunsee | 1,921 | 57.58% | 1,354 | 40.59% | 32 | 0.96% | 17 | 0.51% | 12 | 0.36% | 567 | 17.00% | 3,336 |
| Wallace | 600 | 52.77% | 486 | 42.74% | 32 | 2.81% | 8 | 0.70% | 11 | 0.97% | 114 | 10.03% | 1,137 |
| Washington | 2,543 | 60.36% | 1,564 | 37.12% | 63 | 1.50% | 10 | 0.24% | 33 | 0.78% | 979 | 23.24% | 4,213 |
| Wichita | 593 | 47.90% | 614 | 49.60% | 12 | 0.97% | 8 | 0.65% | 11 | 0.89% | -21 | -1.70% | 1,238 |
| Wilson | 2,682 | 55.67% | 2,047 | 42.49% | 46 | 0.95% | 26 | 0.54% | 17 | 0.35% | 635 | 13.18% | 4,818 |
| Woodson | 1,104 | 54.09% | 904 | 44.29% | 17 | 0.83% | 7 | 0.34% | 9 | 0.44% | 200 | 9.80% | 2,041 |
| Wyandotte | 23,141 | 36.99% | 37,478 | 59.91% | 903 | 1.44% | 318 | 0.51% | 715 | 1.14% | -14,337 | -22.92% | 62,555 |
| Totals | 502,752 | 52.49% | 430,421 | 44.94% | 13,185 | 1.38% | 4,724 | 0.49% | 6,763 | 0.71% | 72,331 | 7.55% | 957,845 |
References
- "1976 Presidential General Election Results – Kansas". Retrieved January 7, 2017.
- Sullivan, Robert David; ‘How the Red and Blue Map Evolved Over the Past Century’; America Magazine in The National Catholic Review; June 29, 2016
- Our Campaigns; KS US President Race, November 02, 1976

.jpg.webp)
