Mitcham and Morden (UK Parliament constituency)
Mitcham and Morden is a constituency[n 1] in Greater London represented in the House of Commons of the UK Parliament since 1997 by Siobhain McDonagh of the Labour Party.[n 2]
| Mitcham and Morden | |
|---|---|
| Borough constituency for the House of Commons | |
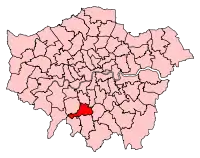 Boundary of Mitcham and Morden in Greater London | |
| County | Greater London |
| Electorate | 67,074 (December 2010)[1] |
| Major settlements | Colliers Wood, Mitcham, Morden and Merton |
| Current constituency | |
| Created | 1974 |
| Member of Parliament | Siobhain McDonagh (Labour) |
| Number of members | One |
| Created from | Mitcham Merton & Morden |
History
The constituency was created in 1974 from the former seats of Mitcham and Merton & Morden.
Between 1974 and 1982 it was represented by Bruce Douglas-Mann who was elected as a Labour MP but defected in 1982 to the Social Democratic Party (SDP). Douglas-Mann was the sole SDP defector to resign his seat; he sought immediate re-election.
In the by-election Douglas-Mann triggered in May 1982, during the Falklands War, Angela Rumbold (Con) was elected. Rumbold's gain was the last time the Conservative Party would gain (as opposed to win) at a by-election until 22 May 2008 when Edward Timpson won the Crewe and Nantwich by-election.
At the 1997 general election the seat was won by the Labour Party's Siobhain McDonagh. At the 2001, 2005 and 2010 General Elections, she was re-elected, in the latter election polling the 26th highest share of the vote for the party of the 631 seats contested.[2]
The 2015 re-election of McDonagh made the seat the 41st safest of Labour's 232 seats by percentage of majority and 14th safest in the capital.[3] The seat is one of the capital's two seats in which its majority in 2015 surpassed the Labour Party's landslide 1997 victory (the other being Ilford South).
Boundaries
1974–1983: The London Borough of Merton wards Mitcham Central, Mitcham East, Mitcham North, Mitcham South, Mitcham West, Morden, and Ravensbury.
1983–2010: Upon redrawing of most of the local government wards, the London Borough of Merton wards of Colliers Wood, Figge's Marsh, Graveney, Lavender, Longthornton, Lower Morden, Phipps Bridge, Pollards Hill, Ravensbury, and St Helier.
2010–present: As above plus Cricket Green ward, minus Phipps Bridge
Constituency profile
The seat is relatively dense suburban — predominantly the housing divides into terraced houses and low-rise apartments in southern parts of Tooting and Streatham at the northern end of the seat. In the south-west of the constituency is the most affluent part, Lower Morden. The name Mitcham and Morden is a partial misnomer — the area of the modern town centre around Morden tube station is in the Wimbledon constituency.
In the middle, the former coaching stop town of Mitcham with its ancient cricket green retains some village-like characteristics and had relatively poor transport connections during the seat's tenure until the building of the Tramlink. In the 20th century, Mitcham became surrounded by modern council housing and light industry. Housing varies between the large rented sector, privately acquired properties much of which due to the Thatcher Ministry-introduced right to buy and significant dependence in certain areas on social housing.[4]
Across the borough, around 40% of the population are ethnic minorities.[5][6]
Members of Parliament
| Election | Member[7] | Party | |
|---|---|---|---|
| February 1974 | Bruce Douglas-Mann | Labour | |
| 1981 | SDP | ||
| 1982 by-election | Angela Rumbold | Conservative | |
| 1997 | Siobhain McDonagh | Labour | |
Election results
Elections in the 2010s
| Party | Candidate | Votes | % | ±% | |
|---|---|---|---|---|---|
| Labour | Siobhain McDonagh | 27,964 | 61.1 | -7.5 | |
| Conservative | Toby Williams | 11,482 | 25.1 | +0.9 | |
| Liberal Democrats | Luke Taylor | 3,717 | 8.1 | +5.0 | |
| Brexit Party | Jeremy Maddocks | 1,202 | 2.6 | N/A | |
| Green | Pippa Maslin | 1,160 | 2.5 | +1.2 | |
| CPA | Des Coke | 260 | 0.5 | 0 | |
| Majority | 16,482 | 36.0 | -8.5 | ||
| Turnout | 45,785 | 65.3 | -4.7 | ||
| Registered electors | 68,705 | ||||
| Labour hold | Swing | -4.2 | |||
| Party | Candidate | Votes | % | ±% | |
|---|---|---|---|---|---|
| Labour | Siobhain McDonagh | 33,039 | 68.7 | +8.0 | |
| Conservative | Alicia Kearns | 11,664 | 24.2 | +1.1 | |
| Liberal Democrats | Claire Mathys | 1,494 | 3.1 | +0.1 | |
| UKIP | Richard Hilton | 1,054 | 2.2 | -7.3 | |
| Green | Laura Collins | 644 | 1.3 | -1.8 | |
| CPA | Des Coke | 223 | 0.5 | +0.0 | |
| Majority | 21,375 | 44.5 | +7.0 | ||
| Turnout | 48,118 | 70.0 | +4.1 | ||
| Registered electors | 68,705 | ||||
| Labour hold | Swing | +3.45 | |||
| Party | Candidate | Votes | % | ±% | |
|---|---|---|---|---|---|
| Labour | Siobhain McDonagh | 27,380 | 60.7 | +4.2 | |
| Conservative | Paul Holmes | 10,458 | 23.2 | −2.1 | |
| UKIP | Richard Hilton | 4,287 | 9.5 | +7.5 | |
| Green | Mason Redding | 1,422 | 3.2 | +2.3 | |
| Liberal Democrats | Diana Coman | 1,378 | 3.1 | −8.8 | |
| CPA | Des Coke | 217 | 0.5 | N/A | |
| Majority | 16,922 | 37.5 | +6.3 | ||
| Turnout | 45,142 | 65.9 | −1.1 | ||
| Registered electors | 68,474 | ||||
| Labour hold | Swing | +3.1 | |||
| Party | Candidate | Votes | % | ±% | |
|---|---|---|---|---|---|
| Labour | Siobhain McDonagh | 24,722 | 56.5 | +0.1 | |
| Conservative | Melanie Hampton | 11,056 | 25.2 | +0.3 | |
| Liberal Democrats | Diana Coman | 5,202 | 11.9 | −2.1 | |
| BNP | Tony Martin | 1,386 | 3.2 | N/A | |
| UKIP | Andrew Mills | 857 | 2.0 | N/A | |
| Green | Smarajit Roy | 381 | 0.9 | −2.6 | |
| Independent | Rathy Alagaratnam | 155 | 0.4 | -0.1 | |
| Independent | Ernest Redgrave | 38 | 0.1 | N/A | |
| Majority | 13,666 | 31.2 | -0.3 | ||
| Turnout | 43,798 | 67.0 | +6.2 | ||
| Registered electors | 65,939 | ||||
| Labour hold | Swing | −0.4 | |||
Elections in the 2000s
| Party | Candidate | Votes | % | ±% | |
|---|---|---|---|---|---|
| Labour | Siobhain McDonagh | 22,489 | 56.4 | −4.0 | |
| Conservative | Andrew Shellhorn | 9,929 | 24.9 | +0.8 | |
| Liberal Democrats | Jo A.E. Christie-Smith | 5,583 | 14.0 | +3.9 | |
| Green | Thomas Walsh | 1,395 | 3.5 | +1.1 | |
| Veritas | Adrian Roberts | 286 | 0.7 | N/A | |
| Independent | Rathy Alagaratnam | 186 | 0.5 | N/A | |
| Majority | 12,560 | 31.5 | -5.8 | ||
| Turnout | 39,868 | 61.2 | +3.4 | ||
| Registered electors | 65,148 | ||||
| Labour hold | Swing | −2.4 | |||
| Party | Candidate | Votes | % | ±% | |
|---|---|---|---|---|---|
| Labour | Siobhain McDonagh | 22,936 | 60.4 | +2.1 | |
| Conservative | Henry (Harry) Stokes | 9,151 | 24.1 | −5.6 | |
| Liberal Democrats | Nicholas Harris | 3,820 | 10.1 | +2.5 | |
| Green | Thomas Walsh | 926 | 2.4 | +1.6 | |
| BNP | John Tyndall | 642 | 1.7 | +0.6 | |
| UKIP | Adrian Roberts | 486 | 1.3 | +1.0 | |
| Majority | 13,785 | 36.3 | +7.6 | ||
| Turnout | 37,961 | 57.8 | −15.5 | ||
| Registered electors | 65,671 | ||||
| Labour hold | Swing | +3.8 | |||
Elections in the 1990s
| Party | Candidate | Votes | % | ±% | |
|---|---|---|---|---|---|
| Labour | Siobhain McDonagh | 27,984 | 58.4 | +11.9 | |
| Conservative | Angela Rumbold | 14,243 | 29.7 | −11.4 | |
| Liberal Democrats | Nicholas Harris | 3,632 | 7.6 | −1.6 | |
| Referendum | Peter J. Isaacs | 810 | 1.7 | N/A | |
| BNP | Linda Miller | 521 | 1.1 | N/A | |
| Green | Thomas Walsh | 415 | 0.9 | −0.4 | |
| Independent | Krishnapillai Vasan | 144 | 0.3 | N/A | |
| UKIP | John R. Barrett | 117 | 0.2 | N/A | |
| Anti-Corruption | Nigel T.V. Dixon | 80 | 0.2 | N/A | |
| Majority | 13,741 | 28.7 | N/A | ||
| Turnout | 47,946 | 73.3 | −7.0 | ||
| Registered electors | 65,402 | ||||
| Labour gain from Conservative | Swing | -16.0 | |||
| Party | Candidate | Votes | % | ±% | |
|---|---|---|---|---|---|
| Conservative | Angela Rumbold | 23,789 | 46.5 | −1.7 | |
| Labour | Siobhain McDonagh | 22,055 | 43.1 | +7.9 | |
| Liberal Democrats | John C. Field | 4,687 | 9.2 | −7.5 | |
| Green | Thomas J. Walsh | 655 | 1.3 | N/A | |
| Majority | 1,734 | 3.4 | −9.6 | ||
| Turnout | 51,186 | 80.3 | +4.6 | ||
| Registered electors | 63,273 | ||||
| Conservative hold | Swing | −4.8 | |||
Elections in the 1980s
| Party | Candidate | Votes | % | ±% | |
|---|---|---|---|---|---|
| Conservative | Angela Rumbold | 23,002 | 48.2 | +5.5 | |
| Labour | Siobhain McDonagh | 16,819 | 35.2 | +6.4 | |
| SDP | Bruce Douglas-Mann | 7,930 | 16.6 | −10.8 | |
| Majority | 6,183 | 13.0 | -0.9 | ||
| Turnout | 47,751 | 75.7 | +2.6 | ||
| Registered electors | 63,089 | ||||
| Conservative hold | Swing | −0.5 | |||
| Party | Candidate | Votes | % | ±% | |
|---|---|---|---|---|---|
| Conservative | Angela Rumbold | 19,827 | 42.7 | −1.2 | |
| Labour | D.G. Nicholas | 13,376 | 28.8 | −16.4 | |
| SDP | Bruce Douglas-Mann | 12,720 | 27.4 | N/A | |
| National Front | J.R. Perryman | 539 | 1.2 | −0.8 | |
| Majority | 6,451 | 13.9 | N/A | ||
| Turnout | 46,462 | 73.1 | -3.8 | ||
| Registered electors | 63,535 | ||||
| Conservative hold | Swing | ||||
| Party | Candidate | Votes | % | ±% | |
|---|---|---|---|---|---|
| Conservative | Angela Rumbold | 13,306 | 43.4 | −0.5 | |
| SDP | Bruce Douglas-Mann | 9,032 | 29.4 | N/A | |
| Labour | David Nicholas | 7,475 | 24.4 | −20.8 | |
| National Front | Joseph Pearce | 547 | 1.8 | −0.2 | |
| Independent Liberal | Edward Larkin | 123 | 0.4 | N/A | |
| Ethnic Minority Candidate | Roy Sawh | 84 | 0.3 | N/A | |
| Democratic Monarchist | Bill Boaks | 66 | 0.2 | N/A | |
| COPS | Jitendra Bardwaj | 22 | 0.1 | N/A | |
| Computer Democrat | Christopher Farnsworth | 18 | 0.0 | N/A | |
| Majority | 4,274 | 14.0 | N/A | ||
| Turnout | 30,673 | 48.5 | -28.4 | ||
| Registered electors | 63,259 | ||||
| Conservative gain from Labour | Swing | +10.2 | |||
Elections in the 1970s
| Party | Candidate | Votes | % | ±% | |
|---|---|---|---|---|---|
| Labour | Bruce Douglas-Mann | 21,668 | 45.2 | −3.0 | |
| Conservative | D. Samuel | 21,050 | 43.9 | +9.0 | |
| Liberal | R. Locke | 4,258 | 8.9 | −7.1 | |
| National Front | J. Perryman | 966 | 2.0 | N/A | |
| Majority | 618 | 1.3 | -12.0 | ||
| Turnout | 47,942 | 76.9 | +5.9 | ||
| Registered electors | 62,365 | ||||
| Labour hold | Swing | −6.0 | |||
| Party | Candidate | Votes | % | ±% | |
|---|---|---|---|---|---|
| Labour | Bruce Douglas-Mann | 22,384 | 48.2 | +5.7 | |
| Conservative | D. Samuel | 16,193 | 34.9 | −1.3 | |
| Liberal | M. Simpson | 7,429 | 16.0 | −4.4 | |
| Communist | Sid French | 281 | 0.6 | −0.4 | |
| Independent | G. Giddins | 106 | 0.2 | N/A | |
| Air Road Public Safety White Resident | Bill Boaks | 68 | 0.2 | N/A | |
| Majority | 6,191 | 13.3 | +7.0 | ||
| Turnout | 46,461 | 71.0 | −8.0 | ||
| Registered electors | 65,398 | ||||
| Labour hold | Swing | +3.5 | |||
| Party | Candidate | Votes | % | ±% | |
|---|---|---|---|---|---|
| Labour | Bruce Douglas-Mann | 21,771 | 42.5 | N/A | |
| Conservative | David Harris | 18,546 | 36.2 | N/A | |
| Liberal | P. C. Spratling | 10,462 | 20.4 | N/A | |
| Communist | Sid French | 507 | 1.0 | N/A | |
| Majority | 3,225 | 6.3 | N/A | ||
| Turnout | 51,286 | 79.0 | N/A | ||
| Registered electors | 64,894 | ||||
| Labour win (new seat) | |||||
Notes and references
- Notes
- A borough constituency (for the purposes of election expenses and type of returning officer)
- As with all constituencies, the constituency elects one Member of Parliament (MP) by the first past the post system of election at least every five years.
- References
- "Electorate Figures - Boundary Commission for England". 2011 Electorate Figures. Boundary Commission for England. 4 March 2011. Archived from the original on 6 November 2010. Retrieved 13 March 2011.
- "General Election Results from the Electoral Commission".
- List of Labour MPs elected in 2015 by % majority UK Political.info. Retrieved 2017-01-29
- "Local statistics - Office for National Statistics". www.ons.gov.uk.
- "UKPollingReport Election Guide 2010 » Mitcham and Morden".
- "2011 census interactive maps". Archived from the original on January 29, 2016.
- Leigh Rayment's Historical List of MPs – Constituencies beginning with "M" (part 3)
- "Mitcham & Morden Parliamentary constituency". BBC News. BBC. Retrieved 23 November 2019.
- "Merton Council Statement of Persons Nominated Mitcham and Morden General Election 2017" (PDF). Merton Council. Retrieved 13 April 2017.
- "Mitcham & Morden parliamentary constituency". BBC News.
- http://researchbriefings.files.parliament.uk/documents/CBP-7979/CBP-7979.pdf
- "Election Data 2015". Electoral Calculus. Archived from the original on 17 October 2015. Retrieved 17 October 2015.
- Services, CS-Democracy (May 7, 2015). "Councillors". democracy.merton.gov.uk.
- "Election Data 2010". Electoral Calculus. Archived from the original on 26 July 2013. Retrieved 17 October 2015.
- "Election Data 2005". Electoral Calculus. Archived from the original on 15 October 2011. Retrieved 18 October 2015.
- "Mitcham & Morden". Electoral Commission. Retrieved 5 March 2017.
- "Election Data 2001". Electoral Calculus. Archived from the original on 15 October 2011. Retrieved 18 October 2015.
- "Election Data 1997". Electoral Calculus. Archived from the original on 15 October 2011. Retrieved 18 October 2015.
- "Politics Resources". Election 1997. Politics Resources. 1 May 1997. Retrieved 2010-12-25.
- C. Rallings & M. Thrasher, The Media Guide to the New Parliamentary Constituencies, p.120 (Plymouth: LGC Elections Centre, 1995)
- "'Mitcham and Morden', May 1997 -". ElectionWeb Project. Cognitive Computing Limited. Retrieved 18 May 2016.
- "Election Data 1992". Electoral Calculus. Archived from the original on 15 October 2011. Retrieved 18 October 2015.
- "Politics Resources". Election 1992. Politics Resources. 9 April 1992. Archived from the original on 24 July 2011. Retrieved 6 Dec 2010.
- "Election Data 1987". Electoral Calculus. Archived from the original on 15 October 2011. Retrieved 18 October 2015.
- "Election Data 1983". Electoral Calculus. Archived from the original on 15 October 2011. Retrieved 18 October 2015.
- Boothroyd, David. "Results of Byelections in the 1979-83 Parliament". United Kingdom Election Results. Retrieved 2015-09-19.
External links
- Politics Resources (Election results from 1922 onwards)
- Electoral Calculus (Election results from 1955 onwards)