Environmental Performance Index
The Environmental Performance Index (EPI) is a method of quantifying and numerically marking the environmental performance of a state's policies. This index was developed from the Pilot Environmental Performance Index, first published in 2002, and designed to supplement the environmental targets set forth in the United Nations Millennium Development Goals.[1]
.png.webp)
The EPI was preceded by the Environmental Sustainability Index (ESI), published between 1999 and 2005. Both indices were developed by Yale University (Yale Center for Environmental Law and Policy) and Columbia University (Center for International Earth Science Information Network) in collaboration with the World Economic Forum and the Joint Research Centre of the European Commission. The ESI was developed to evaluate environmental sustainability relative to the paths of other countries. Due to a shift in focus by the teams developing the ESI, the EPI uses outcome-oriented indicators, then working as a benchmark index that can be more easily used by policy makers, environmental scientists, advocates and the general public.[2] Other leading indices like the Global Green Economy Index (GGEI)[3] provide an integrated measure of the environmental, social and economic dynamics of national economies. The GGEI utilizes EPI data for the environmental dimension of the index while also providing a performance assessment of efficiency sectors (e.g. transport, buildings, energy), investment, green innovation and national leadership around climate change.
The Environmental Performance Index for the year 2020, rank 180 countries. The top 5 countries are Denmark, Luxembourg, Switzerland, United Kingdom and France.[4]
Methodology
EPI calculation variables change often as can be seen below. This should be taken into account when observing country performance through several reports, as it can lead to score and ranking changes founded just on methodology modification.
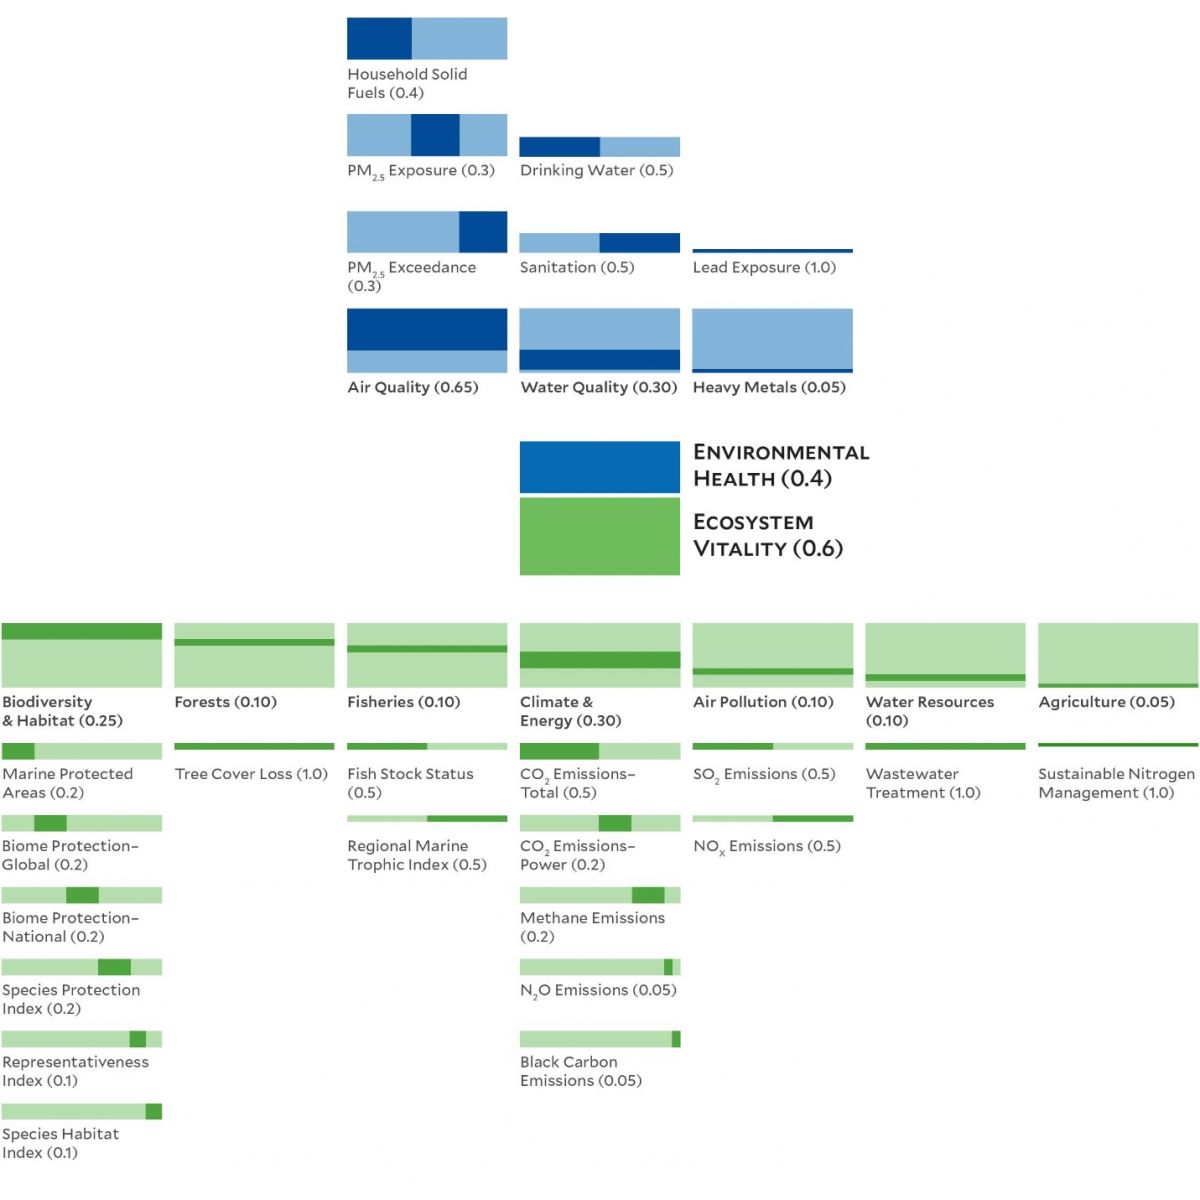
2018 variables
Are largely similar to those from 2016, but have changed in details and some weights. Notably environmental Health is now weighted at 40% and Ecosystem Vitality at 60%.[5]
2016 variables[6]
| EPI | Objective | Issue Category | Indicator |
|---|---|---|---|
| Environmental Performance Index (EPI) | Environmental health (40%) | Health Impacts (33%) | Environmental Risk Exposure (100%) |
| Air quality (33%) | Household Air Quality (30%) | ||
| Air pollution - Average Exposure to PM2.5 (30%) | |||
| Air pollution - PM2.5 Exceedance (30%) | |||
| Air pollution - Average Exposure to NO2 (10%) | |||
| Water and sanitation (33%) | Unsafe Sanitation (50%) | ||
| Drinking Water Quality (50%) | |||
| Ecosystem vitality (60%) | Water resources (25%) | Wastewater treatment (100%) | |
| Agriculture (10%) | Nitrogen use efficiency (75%) | ||
| Nitrogen balance (25%) | |||
| Forests (10%) | Change in forest cover (100%) | ||
| Fisheries (5%) | Fish stocks (100%) | ||
| Biodiversity and habitat (25%) | Terrestrial Protected Areas (National Biome Weights) (20%) | ||
| Terrestrial protected areas (Global Biome Weights) (20%) | |||
| Marine protected areas (20%) | |||
| Species protection (National) (20%) | |||
| Species protection (Global) (20%) | |||
| Climate and energy (25%) | Trend in carbon intensity (75%) | ||
| Trend in CO2 emissions per kWh (25%) |
2010 variables
Extended content | ||||||||||||||||||||||||||||||||||||||||||||||||||||||||||||||||||||||||||||||||||||||||
|---|---|---|---|---|---|---|---|---|---|---|---|---|---|---|---|---|---|---|---|---|---|---|---|---|---|---|---|---|---|---|---|---|---|---|---|---|---|---|---|---|---|---|---|---|---|---|---|---|---|---|---|---|---|---|---|---|---|---|---|---|---|---|---|---|---|---|---|---|---|---|---|---|---|---|---|---|---|---|---|---|---|---|---|---|---|---|---|---|
|
EPI scores
2020
The Environmental Performance Index for the year 2020, rank 180 countries. Canada, the Czech Republic and Italy have the same score, therefore, share the same place.[7]
Top 30 countries and score
 Denmark 82.5
 Luxembourg 82.3
 Switzerland 81.5
 United Kingdom 81.3
 France 80
 Austria 79.6
 Finland 78.9
 Sweden 78.7
 Norway 77.7
 Germany 77.2
 Netherlands 75.3
 Japan 75.1
.svg.png.webp) Australia 74.9
Australia 74.9 Spain 74.3
.svg.png.webp) Belgium 73.3
Belgium 73.3 Ireland 72.8
 Iceland 72.3
 Slovenia 72
 New Zealand 71.3
.svg.png.webp) Canada 71
Canada 71 Czech Republic 71
 Italy 71
 Malta 70.7
 United States of America 69.3
 Greece 69.1
 Slovakia 68.3
 Portugal 67
 South Korea 66.5
 Israel 65.8
 Estonia 65.3
 Cyprus 64.8
 Romania 64.7
2018
| Rank | Country | EPI score | Environmental Health (40% weight) |
Ecosystem Vitality (60% weight) |
|---|---|---|---|---|
| 1 | 87.42 | 93.57 | 83.32 | |
| 2 | 83.95 | 95.71 | 76.11 | |
| 3 | 81.60 | 98.20 | 70.53 | |
| 4 | 80.90 | 93.80 | 72.30 | |
| 5 | 80.51 | 94.41 | 71.24 | |
| 6 | 79.89 | 96.03 | 69.13 | |
| 7 | 79.12 | 95.07 | 68.48 | |
| 8 | 78.97 | 86.38 | 74.03 | |
| 9 | 78.77 | 95.92 | 67.34 | |
| 10 | 78.64 | 99.35 | 64.83 | |
| 11 | 78.57 | 98.41 | 65.34 | |
| 12 | 78.39 | 94.21 | 67.85 | |
| 13 | 78.37 | 88.68 | 71.50 | |
| 14 | 77.49 | 97.86 | 63.91 | |
| 15 | 77.38 | 89.37 | 69.39 | |
| 16 | 76.96 | 85.88 | 71.02 | |
| 17 | 75.96 | 95.96 | 62.63 | |
| 18 | 75.46 | 92.26 | 64.25 | |
| 19 | 75.01 | 94.14 | 62.25 | |
| 20 | 74.69 | 92.99 | 62.48 | |
| 21 | 74.12 | 97.95 | 58.23 | |
| 22 | 73.60 | 91.03 | 61.98 | |
| 23 | 72.84 | 69.85 | 74.83 | |
| 24 | 72.60 | 87.96 | 62.37 | |
| 25 | 72.18 | 97.51 | 55.29 | |
| 26 | 71.91 | 90.47 | 59.53 | |
| 27 | 71.19 | 93.91 | 56.04 | |
| 28 | 70.60 | 63.87 | 75.08 | |
| 29 | 69.33 | 72.57 | 67.18 | |
| 30 | 67.85 | 69.60 | 66.68 |
2016
On 23 January 2016, the 2016 Environmental Performance Index was released at the World Economic Forum, with 180 countries being ranked.[9]
Top 30 countries and score
- Finland 90.88
- Iceland 90.51
- Sweden 90.43
- Denmark 89.21
- Slovenia 88.98
- Spain 88.91
- Portugal 88.63
- Estonia 88.59
- Italy 88.48
- France 88.20
- New Zealand 88.00
- United Kingdom 87.38
- Australia 87.22
 Singapore 87.04
 Croatia 86.98
- Switzerland 86.93
- Norway 86.90
- Austria 86.64
- Ireland 86.60
- Luxembourg 86.58
- Greece 85.81
 Latvia 85.71
 Lithuania 85.49
- Slovakia 85.42
- Canada 85.06
- United States of America 84.72
- Czech Republic 84.67
 Hungary 84.60
- Malta 84.48
- Germany 84.25
2014
On 25 January 2014 Yale University and Columbia University released the 2014 Environmental Performance Index at the World Economic Forum ranking 178 countries.[10]
Top 30 countries and score
- Switzerland 87.67
- Luxembourg 83.29
- Australia 82.4
- Singapore 81.78
- Czech Republic 81.47
- Germany 80.47
- Spain 79.79
- Austria 78.32
- Sweden 78.09
- Norway 78.04
- Netherlands 77.75
- United Kingdom 77.35
- Denmark 76.92
- Iceland 76.5
- Slovenia 76.43
- New Zealand 76.41
- Portugal 75.8
- Finland 75.72
- Ireland 74.67
- Estonia 74.66
- Slovakia 74.45
- Italy 74.36
- Greece 73.28
- Canada 73.14
 United Arab Emirates 72.91
- Japan 72.35
- France 71.05
- Hungary 70.28
 Chile 69.93
 Poland 69.53
2012
On 25 January 2012 Yale University and Columbia University released the 2012 Environmental Performance Index at the World Economic Forum ranking 132 countries.[11] For this report, a new "Pilot Trend EPI" was developed to rank countries based on the environmental performance changes that occurred during the last decade, which allowed the establishment of which countries were improving and which were declining.[12]
Top 30 countries and score[11]
- Switzerland 76.69
- Latvia 70.37
- Norway 69.92
- Luxembourg 69.2
 Costa Rica 69.03
- France 69
- Austria 68.92
- Italy 68.9
- United Kingdom 68.82
- Sweden 68.82
- Germany 66.91
- Slovakia 66.62
- Iceland 66.28
- New Zealand 66.05
 Albania 65.85
- Netherlands 65.65
- Lithuania 65.5
- Czech Republic 64.79
- Finland 64.44
- Croatia 64.16
- Denmark 63.61
- Poland 63.47
- Japan 63.36
- Belgium 63.02
 Malaysia 62.51
 Brunei 62.49
 Colombia 62.33
- Slovenia 62.25
 Taiwan 62.23
 Brazil 60.9
|
Top 10 countries by Trend EPI[11][12] The EPI rank is shown in parentheses.
|
Worst 10 countries by Trend EPI[11][12] The EPI rank is shown in parentheses.
|
2010
On 28 January 2010 Yale University and Columbia University released the 2010 Environmental Performance Index at the World Economic Forum ranking 163 countries.[13] The top performer for 2010 is Iceland due to its high scores on environmental public health, gets virtually all of its power from renewable sources (hydropower and geothermal energy), and its control of greenhouse gas emissions. The United States fell to the 61st position, as compared to 39th in the 2008 EPI, Brazil ranks 62nd, Russia 69th, China 121st, and India ranks 123rd.[13][14]
Top 30 countries and score[13]
- Iceland 93.5
- Switzerland 89.1
- Costa Rica 86.4
- Sweden 86.0
- Norway 81.1
 Mauritius 80.6
- France 78.2
- Austria 78.1
 Cuba 78.1
- Colombia 76.8
- Malta 76.3
- Finland 74.7
- Slovakia 74.5
- United Kingdom 74.2
- New Zealand 73.4
- Chile 73.3
- Germany 73.2
- Italy 73.1
- Portugal 73.0
- Japan 72.5
- Latvia 72.5
- Czech Republic 71.6
- Albania 71.4
 Panama 71.4
- Spain 70.6
 Belize 69.9
 Antigua and Barbuda 69.8
- Singapore 69.6
 Serbia 69.4
 Ecuador 69.3
2008
On 23 January 2008 Yale University and Columbia University released the 2008 Environmental Performance Index at the World Economic Forum ranking 149 countries. The environmental experts at both universities concluded that "analysis of the drivers underlying the 2008 rankings suggests that wealth is a major determinant of environmental success".[15]
Top 30 countries and score[16]
- Switzerland 95.5
- Norway 93.1
- Sweden 93.1
- Finland 91.4
- Costa Rica 90.5
- Austria 89.4
- New Zealand 88.9
- Latvia 88.8
- Colombia 88.3
- France 87.8
- Iceland 87.6
- Canada 86.6
- Germany 86.3
- United Kingdom 86.3
- Slovenia 86.3
- Lithuania 86.2
- Slovakia 86.0
- Portugal 85.8
- Estonia 85.2
- Croatia 84.6
- Japan 84.5
- Ecuador 84.4
- Hungary 84.2
- Italy 84.2
- Albania 84.2
- Denmark 84.0
- Malaysia 84.0
 Russia 84.0
- Chile 83.9
- Spain 83.4
2006
On 26 January 2006 Yale (YCELP) and Columbia University (CIESIN) released the Pilot 2006 Environmental Performance Index at the World Economic Forum ranking 133 countries. It was done in collaboration with the World Economic Forum and the Joint Research Centre of the European Commission.
Top 30 countries and score[17]
- New Zealand 88.0
- Sweden 87.8
- Finland 87.0
- Czech Republic 86.0
- United Kingdom 85.6
- Austria 85.2
- Denmark 84.2
- Canada 84.0
- Malaysia 83.3
- Ireland 83.3
- Portugal 82.9
- France 82.5
- Iceland 82.1
- Japan 81.9
- Costa Rica 81.6
- Switzerland 81.4
- Colombia 80.4
- Norway 80.2
- Greece 80.2
- Australia 80.1
- Italy 79.8
- Germany 79.4
- Spain 79.2
- Taiwan 79.1
- Slovakia 79.1
- Chile 78.9
- Netherlands 78.7
- United States 78.5
- Cyprus 78.4
 Argentina 77.7
References
- Yale Center for Environmental Law & Policy, and Center for International Earth Science Information Network at Columbia University. "Environmental Performance Index". Retrieved 2008-03-16.
- Yale Center for Environmental Law & Policy / Center for International Earth Science Information Network at Columbia University. "2008 Environmental Performance Index Report" (PDF). Archived from the original (PDF) on 2008-04-09. Retrieved 2008-03-18. See Executive Summary, pp. 32-35 for a detailed comparison between the ESI 2005, the EPI 2006 and the EPI 2008.
- "2016 Global Green Economy Index (GGEI)" (PDF).
- "2020 EPI Results". Environmental Performance Index. Retrieved 22 November 2020.
- "EPI 2018 variables".
- "2016 EPI Raw Data". Yale University. 2016.
- "2020 EPI Results". Environmental Performance Index. Retrieved 22 November 2020.
- "2020 EPI Results". Environmental Performance Index. Retrieved 22 November 2020.
- "2016 EPI FULL REPORT" (PDF). Yale. Archived from the original (PDF) on 2017-10-04. Retrieved May 20, 2017.
- "Country Rankings". Yale. 25 January 2014. Archived from the original on 29 January 2014. Retrieved 2014-01-29.
- Yale Center for Environmental Law & Policy / Center for International Earth Science Information Network at Columbia University. "2010 EPI Rankings". Archived from the original on 2012-05-05. Retrieved 2012-01-25.
- Yale Center for Environmental Law & Policy / Center for International Earth Science Information Network at Columbia University. "EPI 2012: Summary for Policymakers" (PDF). EPI Yales. Archived from the original (PDF) on 2016-12-30. Retrieved 2012-01-27.
- Yale Center for Environmental Law & Policy / Center for International Earth Science Information Network at Columbia University. "2012 Environmental Performance Index". Archived from the original on 2010-02-04. Retrieved 2010-01-27. See also official Press release
- Elizabeth Rosenthal (2010-01-27). "Iceland Leads Environmental Index as U.S. Falls". The New York Times. Retrieved 2010-01-28.
- Yale Center for Environmental Law & Policy / Center for International Earth Science Information Network at Columbia University. "Switzerland Tops 2008 Environmental Scorecard at World Economic Forum". Archived from the original on 2008-02-03. Retrieved 2008-01-26.
- Yale Center for Environmental Law & Policy / Center for International Earth Science Information Network at Columbia University. "Environmental Performance Index 2008". Archived from the original on 2010-02-25. Retrieved 2010-01-28.
- Yale Center for Environmental Law & Policy / Center for International Earth Science Information Network at Columbia University. "Pilot 2006 Environmental Performance Index". Archived from the original on 2007-06-17. Retrieved 2007-06-17.
External links
- Yale University – EPI – A collaboration between Yale and Columbia Universities
- Yale University – YCELP – Yale Center for Environmental Law & Policy
- 2018 Environmental Performance Index
