Lattes, Hérault
Lattes is a commune in the Hérault département in the Occitanie region in southern France, located just on the outskirts of Montpellier.

Lattes | |
|---|---|
 The Place des Arcades in Maurin | |
.svg.png.webp) Coat of arms | |
Location of Lattes 
| |
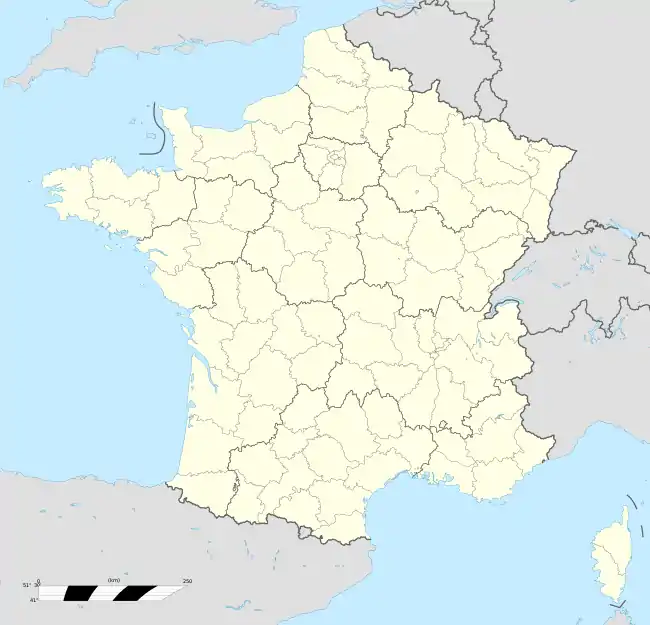 Lattes 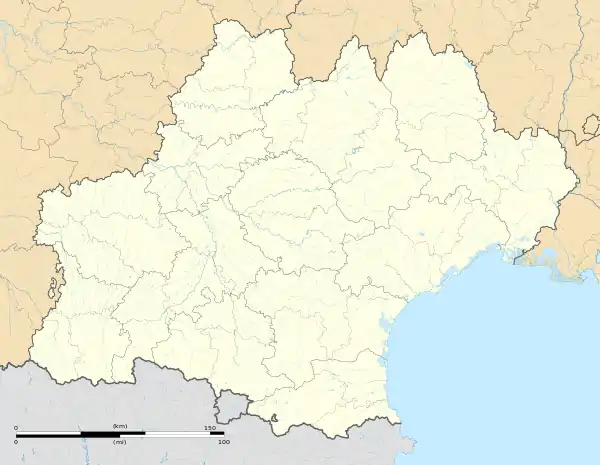 Lattes | |
| Coordinates: 43°34′12″N 3°54′34″E | |
| Country | France |
| Region | Occitanie |
| Department | Hérault |
| Arrondissement | Montpellier |
| Canton | Lattes |
| Intercommunality | Montpellier Méditerranée Métropole |
| Government | |
| • Mayor (2008–2014) | Cyril Meunier |
| Area 1 | 27.83 km2 (10.75 sq mi) |
| Population (2017-01-01)[1] | 16,564 |
| • Density | 600/km2 (1,500/sq mi) |
| Time zone | UTC+01:00 (CET) |
| • Summer (DST) | UTC+02:00 (CEST) |
| INSEE/Postal code | 34129 /34970 |
| Elevation | 0–26 m (0–85 ft) |
| 1 French Land Register data, which excludes lakes, ponds, glaciers > 1 km2 (0.386 sq mi or 247 acres) and river estuaries. | |
Geography
Lattes is located in the South of the prefecture of Montpellier in a plain split by the river Lez, that flows to the Mediterranean Sea at Palavas-les-Flots. Stretching from west to east, the hills announce the typical relief within the department.
The territory of the municipality is partially liable to flooding, when the level of the Lez rises. Areas near the river Lez and the [Mosson river] were protected by dykes. An environmental inspection report pointed the risk of three hundred dead in Lattes-Centre and other localities like les Marestelles and the necessity to provide accommodation.[2] A spillway has been built in 2010.
The majority of the city's inhabitants live in the left bank where most of the business takes place. The Lattes-Centre and the [Boirargues] district are still separated by some farms, unused field and important commercial areas on the road going from Carnon to Montpellier.
In the south of Lattes, toward the coastline, the Pond of Mejean is the main site of the nature reserve where it is possible to appreciate bird watching. The natural house is the right place, at the entrance, to get some information about the Méjean ornithological park.
Population
|
|
See also
References
- "Populations légales 2017". INSEE. Retrieved 6 January 2020.
- Rapport de juillet 2006 publié par Marianne n° 502, décembre 2006
External links
| Wikimedia Commons has media related to Lattes. |
| Authority control |
|---|