List of the largest trading partners of the United States
The 30 largest trade partners of the United States represent 87.9% of U.S. exports, and 87.4% of U.S. imports as of 2017. These figures do not include services or foreign direct investment.
The largest US partners with their total trade in goods (sum of imports and exports) in millions of US dollars for calendar year 2017 are as follows:[1]
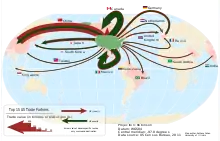
A flow map of the largest trade partners of the US
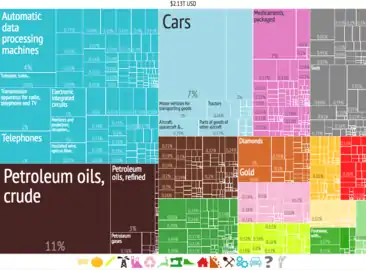
United States imported $2.13 trillion from other countries in 2014
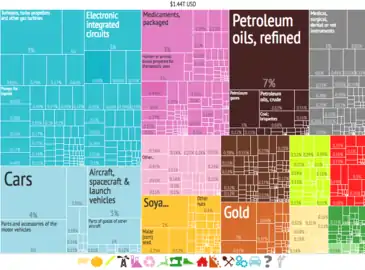
United States exported $1.44 trillion to other countries in 2014
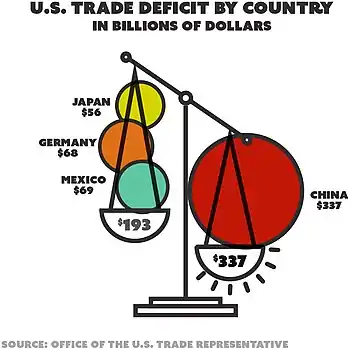
U.S. trade deficit (in billions, goods and services) by country in 2017
| Rank | Country/District | Exports | Imports | Total Trade | Trade Balance |
|---|---|---|---|---|---|
| - | World | 1,546,273 | 2,341,963 | 3,888,236 | -795,690 |
| - | 283,269 | 434,633 | 717,902 | -151,363 | |
| 1 | 129,894 | 505,470 | 635,364 | -375,576 | |
| 2 | 282,265 | 299,319 | 581,584 | -17,054 | |
| 3 | 243,314 | 314,267 | 557,581 | -70,953 | |
| 4 | 67,605 | 136,481 | 204,086 | -68,876 | |
| 5 | 53,897 | 117,575 | 171,472 | -63,678 | |
| 6 | 48,326 | 71,444 | 119,770 | -23,118 | |
| 7 | 56,258 | 53,060 | 109,318 | +3,198 | |
| 8 | 33,596 | 48,899 | 82,495 | -15,303 | |
| 9 | 25,689 | 48,603 | 74,292 | -22,914 | |
| 10 | 18,405 | 49,918 | 68,323 | -31,513 | |
| 11 | 25,730 | 42,462 | 68,192 | -16,732 | |
| 12 | 37,222 | 29,452 | 66,674 | +7,770 | |
| 13 | 41,510 | 17,785 | 59,295 | +23,725 | |
| 14 | 21,685 | 35,997 | 57,682 | -14,312 | |
| 15 | 10,708 | 48,797 | 59,505 | -38,089 | |
| 16 | 8,133 | 46,488 | 54,621 | -38,355 | |
| 17 | 12,964 | 37,396 | 50,360 | -24,432 | |
| 18 | 29,806 | 19,367 | 49,173 | +10,439 | |
| 19 | 39,939 | 7,376 | 47,315 | +32,563 | |
| 20 | 29,924 | 14,997 | 44,921 | +14,927 | |
| 21 | 10,992 | 31,152 | 42,144 | -20,160 | |
| 22 | 18,881 | 16,348 | 35,229 | +2,533 | |
| 23 | 24,527 | 10,045 | 34,572 | +14,482 | |
| 24 | 12,550 | 21,945 | 34,495 | -9,395 | |
| 25 | 6,684 | 20,209 | 27,073 | -13,525 | |
| 26 | 13,312 | 13,557 | 26,869 | -245 | |
| 27 | 11,064 | 15,645 | 26,709 | -4,581 | |
| 28 | 20,020 | 4,269 | 24,289 | +15,751 | |
| 29 | 13,605 | 10,551 | 24,156 | +3,054 | |
| 30 | 6,998 | 17,021 | 24,019 | -10,023 | |
| - | Top 30 | 1,359,143 | 2,046,186 | 3,405,329 | -687,043 |
| Country | Exports | Imports | Trade Deficit |
|---|---|---|---|
123,676 | 446,754 | 343,078 | |
276,142 | 418,754 | 142,059 | |
49,363 | 123,260 | 73,897 | |
66,827 | 134,004 | 67,117 | |
240,249 | 294,074 | 53,825 | |
312,421 | 347,798 | 35,377 | |
18,705 | 47,041 | 28,336 | |
7,806 | 33,956 | 26,150 | |
16,968 | 42,115 | 25,147 | |
44,471 | 69,518 | 25,047 | |
21,608 | 45,244 | 23,636 | |
13,068 | 30,420 | 17,352 | |
31,301 | 46,874 | 15,573 | |
11,810 | 27,123 | 15,313 | |
26,670 | 40,581 | 13,911 | |
22,176 | 31,191 | 9,015 | |
15,083 | 22,962 | 7,879 | |
53,823 | 54,392 | 569 |
| Balance of Trade 2014[5] | |||||||||
|---|---|---|---|---|---|---|---|---|---|
| China | Euro Area | Japan | Mexico | Pacific | Canada | Middle East | Lat. America | Total by Product | |
| Computer | -151.9 | 3.4 | -8.0 | -11.0 | -26.1 | 20.9 | 5.8 | 12.1 | -155.0 |
| Oil, Gas, Minerals | 1.9 | 6.4 | 2.4 | -20.8 | 1.1 | -79.8 | -45.1 | -15.9 | -149.7 |
| Transportation | 10.9 | -30.9 | -46.2 | -59.5 | -0.5 | -6.1 | 17.1 | 8.8 | -106.3 |
| Apparel | -56.3 | -4.9 | 0.6 | -4.2 | -6.3 | 2.5 | -0.3 | -1.1 | -69.9 |
| Electrical Equipment | -35.9 | -2.4 | -4.0 | -8.5 | -3.3 | 10.0 | 1.8 | 2.0 | -40.4 |
| Misc. Manufacturing | -35.3 | 4.9 | 2.7 | -2.8 | -1.4 | 5.8 | -1.5 | 1.8 | -25.8 |
| Furniture | -18.3 | -1.2 | 0.0 | -1.6 | -2.1 | 0.4 | 0.2 | 0.0 | -22.6 |
| Machinery | -19.9 | -27.0 | -18.8 | 3.9 | 7.6 | 18.1 | 4.5 | 9.1 | -22.4 |
| Primary Metals | -3.1 | 3.1 | -1.8 | 1.0 | 1.9 | -8.9 | -0.9 | -10.4 | -19.1 |
| Fabricated Metals | -17.9 | -5.9 | -3.5 | 2.8 | -4.3 | 7.3 | 1.2 | 1.9 | -18.5 |
| Plastics | -15.7 | -1.9 | -2.0 | 5.7 | -4.1 | 2.6 | -0.1 | 0.5 | -15.0 |
| Textile | -12.3 | -1.1 | -0.3 | 2.8 | -4.6 | 1.5 | -0.9 | 0.2 | -14.7 |
| Beverages, Tobacco | 1.3 | -9.9 | 0.6 | -3.3 | 0.0 | 1.0 | 0.2 | -0.6 | -10.6 |
| Nonmetallic Minerals | -6.1 | -1.9 | -0.4 | -1.2 | 0.1 | 1.9 | -0.5 | -0.8 | -8.9 |
| Paper | -2.7 | 1.2 | 1.1 | 4.3 | 1.2 | -9.8 | 0.9 | -1.9 | -5.8 |
| Chemical | -3.9 | -39.5 | -1.5 | 19.1 | 3.2 | 4.6 | -2.4 | 15.8 | -4.7 |
| Food | 0.7 | -3.6 | 6.1 | 4.9 | 0.9 | 0.1 | 1.4 | -1.1 | 9.5 |
| Agriculture | 17.8 | 6.2 | 7.3 | -3.0 | 5.7 | -0.8 | 2.8 | -6.5 | 29.5 |
| Petroleum | 0.6 | -1.2 | 0.1 | 16.6 | -2.0 | -0.1 | 0.6 | 18.3 | 32.9 |
| Total by Country/Area | -346.1 | -106.1 | -65.6 | -54.9 | -33.0 | -29.0 | -15.1 | 32.3 | |
Countries of which United States is the largest trading partner
The United States is also the primary export or import partner of several countries. The percentages on these tables are based on 2016 data as shown on the CIA World Factbook.
See also
- Economy of the United States
- List of imports of the United States
- Value added tax trade criticism
- List of the largest trading partners of Australia
- List of the largest trading partners of Canada
- List of the largest trading partners of China
- List of the largest trading partners of the European Union
- List of the largest trading partners of India
- List of the largest trading partners of Russia
- List of the largest trading partners of United Kingdom
References
- "Top U.S. Trade Partners Ranked by 2017 U.S. Total Export Value for Goods (in millions of U.S. dollars)" (PDF). International Trade Administration. Archived from the original (PDF) on 13 July 2018. Retrieved 13 July 2018.
- "2016 : U.S. trade in goods with European Union". United States Census Bureau. Retrieved 2017-03-20.
- "Top US Exports".
- "United States Top 10 Imports". 4 November 2016.
- http://www.businessinsider.com/balance-of-goods-us-trading-partners-from-goldman-sachs-2017-5
- "Exports - partners". World Fact Book, Central Intelligence Agency.
- "Imports - partners". World Fact Book, Central Intelligence Agency.
| Terminology |
| ||||||||||
|---|---|---|---|---|---|---|---|---|---|---|---|
Organizations and policies | |||||||||||
| Political economy | |||||||||||
| Regional organizations |
| ||||||||||
| Exports by product | |||||||||||
| |||||||||||
This article is issued from Wikipedia. The text is licensed under Creative Commons - Attribution - Sharealike. Additional terms may apply for the media files.