1924 United States presidential election in Illinois
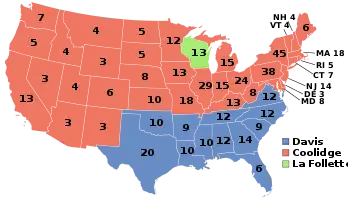
The 1924 United States presidential election in Illinois took place on November 4, 1924, as part of the 1924 United States presidential election. State voters chose 29 representatives, or electors, to the Electoral College, who voted for president and vice president.
| |||||||||||||||||||||||||||||||||
All 29 Illinois votes to the Electoral College | |||||||||||||||||||||||||||||||||
|---|---|---|---|---|---|---|---|---|---|---|---|---|---|---|---|---|---|---|---|---|---|---|---|---|---|---|---|---|---|---|---|---|---|
| |||||||||||||||||||||||||||||||||
 County Results
| |||||||||||||||||||||||||||||||||
| |||||||||||||||||||||||||||||||||
| Elections in Illinois |
|---|
 |
Election information
The primaries and general elections coincided with those for other federal offices (Senate and House), as well as those for state offices.[1]
Background
A strongly Democratic state during the Second Party System, Illinois became Republican-leaning after the American Civil War due to a combination of strong Free Soil Party heritage amongst its Yankee northern counties with the wartime conversion of some Virginian-settled rock-ribbed Democratic Southern Illinois counties[2] to Unionist Republicanism[3] à la Appalachia.[4] Between the Civil War and World War I, partisanship in Illinois – like in the Border States – largely re-fought the war, with the result that although the Democratic Party gained at least 43 percent of the statewide vote via Southern and German Catholic support in every election up to 1900, they never gained an absolute majority and carried the state's electoral votes only in 1892.[5]
Due to the Democratic Party's growing Populist and prohibitionist leanings, a decline in Democratic support after 1900 in its German Central Illinois strongholds transformed Illinois into a powerfully Republican state at all levels.[6] Even Woodrow Wilson in 1912 when the GOP was mortally divided carried the state by only a very narrow margin, and in 1920 hostility to the League of Nations and the perceived anti-German bias of both outgoing President Wilson and new Democratic nominee and former Ohio Governor James M. Cox – the latter of whom had banned German-language instruction in Ohio schools[7] – meant Harding carried Illinois by over 42 percentage points and the state was his sixth strongest in a national landslide. German Catholic Clinton County, and twelve southern-settled counties in the Illinois River valley and southward, went Republican for the first time.[8]
Primaries
Both major parties held non-binding state-run preferential primaries on April 8.[1]
Democratic
| ||||||||||||||||
| ||||||||||||||||
The 1924 Illinois Democratic presidential primary was held on April 8, 1924 in the U.S. state of Illinois as one of the Democratic Party's state primaries ahead of the 1924 presidential election.
The preference vote was a non-binding "beauty contest". Delegates were instead elected by direct votes by congressional district on delegate candidates.[1] Delegate candidates either were listed on the ballot with their preference on for a particular presidential candidate, or were listed as expressing no preference.[1]
The preference vote was near unanimously won by the only name on the ballot, former United States Secretary of the Treasury William Gibbs McAdoo.[1]
| Candidate | Votes | % |
|---|---|---|
| William Gibbs McAdoo | 180,544 | 98.93 |
| William E. Dever (write-in) | 1,574 | 0.86 |
| Al Smith (write-in) | 235 | 0.13 |
| James Reed (write-in) | 84 | 0.05 |
| Scattering | 66 | 0.04 |
| Total | 182,503 | 100 |
Republican
| ||||||||||||||||
| ||||||||||||||||
The 1924 Illinois Republican presidential primary was held on April 8, 1924 in the U.S. state of Illinois as one of the Republican Party's state primaries ahead of the 1924 presidential election.
The preference vote was a "beauty contest". Delegates were instead selected by direct-vote in each congressional districts on delegate candidates.[1] Delegate candidates either were listed on the ballot with their preference on for a particular presidential candidate, or were listed as expressing no preference.[1]
| Candidate | Votes | % |
|---|---|---|
| Calvin Coolidge (incumbent) | 533,193 | 58.01 |
| Hiram W. Johnson | 385,590 | 41.95 |
| Robert La Follette (write-in) | 278 | 0.03 |
| Scattering | 21 | 0.00 |
| Total | 919,082 | 100 |
General election
During the Republican National Convention, Illinosian Charles G. Dawes easily won the Vice-Presidential nomination ahead of fellow state resident Frank Lowden.[9]
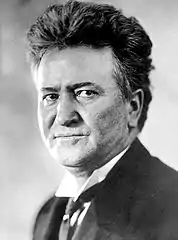
The first campaign in Illinois was not by Coolidge or Davis, but by radical third-party nominee, veteran Wisconsin Senator Robert M. La Follette, who on July 4 confirmed his previous plan to run a third-party campaign when nominated by the “Conference for Progressive Political Action”.[10] La Follette on Labor Day, August 22, said he hoped to carry Illinois because he believed gubernatorial candidate Len Small would not aid the Coolidge ticket.[11] Democratic nominee John W. Davis, a conservative Southern Democrat from West Virginia, spent four days in Chicago conferring with party leaders from half-a-dozen other states,[12] but did not campaign downstate. Coolidge was urged to campaign in the state[13] after suspicions La Follette would be a severe threat in Chicago and other German-American communities.[14] Coolidge did not respond, and Dawes was viciously criticised by La Follette's running mate, Montana Senator Burton K. Wheeler, for being associated with the Central Trust Company and Lorimer Street State Savings Bank.[15]
At the beginning of the campaign it was considered possible that Davis could carry Illinois if there was a strong enough vote for La Follette.[16] However, as early as mid-August it was thought that the Coolidge-Dawes ticket was certain of carrying Illinois,[17] and in mid-September it seemed likely Coolidge was a clear first with La Follette running ahead of Davis,[18] a result that would be repeated in a survey during the second week of October.[19]
After polls in mid-October suggested a trend toward him, Davis intended to campaign downstate, but never did so. As election day neared, it became clearer that Coolidge would carry Illinois, although at the beginning of the fourth week of October it was thought he would win by only half Harding's 1920 margin, even with La Follette abandoning his campaigns in the Corn Belt.[20] Polls on October 29 further confirmed Illinois as in Coolidge's hands,[21]
Ultimately Coolidge won by substantially more than the mid-October predictions, although by less than Harding had in 1920. Davis did regain seven of the thirteen counties that defected to the GOP for the first time in 1920, but still did worse than any other major party nominee in Illinois presidential election history except William Howard Taft in 1912.[5] La Follette ran third below Davis, running far below his performance in his adjacent home state of Wisconsin and other states to the northwest, but nonetheless performed extremely well for a third party in German Catholic precincts and in industrial areas of the Upper Mississippi Valley adjacent to Iowa. The Wisconsin Senator did carry one county – German Catholic Clinton – which was the nation's southeasternmost county to vote for La Follette.
Coolidge maintained the dominance that Warren Harding had enjoyed in 1920, despite losing substantial German Catholic and Mississippi Valley industrial support to La Folette.[22]
Results
| Presidential Candidate | Running Mate | Party | Electoral Vote (EV) | Popular Vote (PV)[1] | |
|---|---|---|---|---|---|
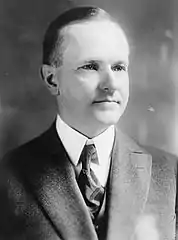
| Calvin Coolidge of Massachusetts (incumbent) | Charles G. Dawes | Republican | 29 | 1,453,321 | 58.84% |
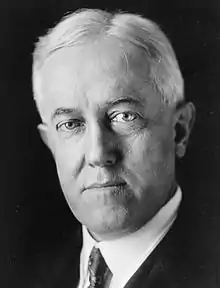
| John W. Davis | Charles W. Bryan | Democratic | 0 | 576,975 | 23.36% |
| Robert M. La Follette | Burton K. Wheeler | Progressive | 0 | 432,027 | 17.49% |
| William Z. Foster | Benjamin Gitlow | Workers’ Party America | 0 | 2,622 | 0.11% |
| Herman P. Faris | Marie C. Brehm | Prohibition | 0 | 2,367 | 0.10% |
| Frank T. Johns | Verne L. Reynolds | Socialist Labor | 0 | 2,334 | 0.09% |
| William Wallace | John C. Lincoln | Commonwealth Land | 0 | 421 | 0.02% |
Results by county
| County | John Calvin Coolidge Republican |
John William Davis Democratic |
Robert Marion La Follette, Sr. Progressive |
Various candidates Other parties |
Margin | Total votes cast[23] | |||||
|---|---|---|---|---|---|---|---|---|---|---|---|
| # | % | # | % | # | % | # | % | # | % | ||
| Adams | 9,985 | 40.92% | 8,628 | 35.35% | 5,693 | 23.33% | 98 | 0.40% | 1,357 | 5.56% | 24,404 |
| Alexander | 4,465 | 58.10% | 2,639 | 34.34% | 573 | 7.46% | 8 | 0.10% | 1,826 | 23.76% | 7,685 |
| Bond | 3,644 | 56.88% | 2,143 | 33.45% | 585 | 9.13% | 35 | 0.55% | 1,501 | 23.43% | 6,407 |
| Boone | 4,872 | 75.37% | 348 | 5.38% | 1,235 | 19.11% | 9 | 0.14% | 3,637[lower-alpha 1] | 56.27% | 6,464 |
| Brown | 1,637 | 41.49% | 2,149 | 54.46% | 139 | 3.52% | 21 | 0.53% | -512 | -12.98% | 3,946 |
| Bureau | 9,457 | 60.38% | 1,995 | 12.74% | 4,169 | 26.62% | 42 | 0.27% | 5,288[lower-alpha 1] | 33.76% | 15,663 |
| Calhoun | 1,136 | 48.12% | 1,115 | 47.23% | 100 | 4.24% | 10 | 0.42% | 21 | 0.89% | 2,361 |
| Carroll | 4,559 | 60.93% | 603 | 8.06% | 2,301 | 30.75% | 19 | 0.25% | 2,258[lower-alpha 1] | 30.18% | 7,482 |
| Cass | 3,139 | 41.23% | 2,909 | 38.21% | 1,547 | 20.32% | 18 | 0.24% | 230 | 3.02% | 7,613 |
| Champaign | 14,244 | 62.81% | 5,221 | 23.02% | 3,149 | 13.89% | 63 | 0.28% | 9,023 | 39.79% | 22,677 |
| Christian | 7,398 | 46.08% | 5,826 | 36.29% | 2,741 | 17.07% | 91 | 0.57% | 1,572 | 9.79% | 16,056 |
| Clark | 4,731 | 51.55% | 4,203 | 45.79% | 211 | 2.30% | 33 | 0.36% | 528 | 5.75% | 9,178 |
| Clay | 3,432 | 49.60% | 2,987 | 43.17% | 479 | 6.92% | 21 | 0.30% | 445 | 6.43% | 6,919 |
| Clinton | 2,358 | 29.69% | 1,693 | 21.32% | 3,876 | 48.80% | 15 | 0.19% | -1,518[lower-alpha 1] | -19.11% | 7,942 |
| Coles | 8,342 | 54.90% | 5,544 | 36.49% | 1,275 | 8.39% | 33 | 0.22% | 2,798 | 18.42% | 15,194 |
| Cook | 688,973 | 61.87% | 226,141 | 20.31% | 196,149 | 17.61% | 2,389 | 0.21% | 462,832 | 41.56% | 1,113,652 |
| Crawford | 4,830 | 51.25% | 4,223 | 44.81% | 364 | 3.86% | 8 | 0.08% | 607 | 6.44% | 9,425 |
| Cumberland | 2,698 | 51.09% | 2,384 | 45.14% | 190 | 3.60% | 9 | 0.17% | 314 | 5.95% | 5,281 |
| De Witt | 5,173 | 58.77% | 2,752 | 31.27% | 846 | 9.61% | 31 | 0.35% | 2,421 | 27.51% | 8,802 |
| DeKalb | 10,500 | 76.40% | 1,540 | 11.20% | 1,654 | 12.03% | 50 | 0.36% | 8,846[lower-alpha 1] | 64.36% | 13,744 |
| Douglas | 4,046 | 55.65% | 2,315 | 31.84% | 874 | 12.02% | 35 | 0.48% | 1,731 | 23.81% | 7,270 |
| DuPage | 16,917 | 72.81% | 1,893 | 8.15% | 4,378 | 18.84% | 45 | 0.19% | 12,539[lower-alpha 1] | 53.97% | 23,233 |
| Edgar | 6,297 | 52.31% | 5,222 | 43.38% | 500 | 4.15% | 18 | 0.15% | 1,075 | 8.93% | 12,037 |
| Edwards | 2,750 | 69.59% | 1,047 | 26.49% | 140 | 3.54% | 15 | 0.38% | 1,703 | 43.09% | 3,952 |
| Effingham | 3,159 | 39.18% | 3,814 | 47.30% | 1,070 | 13.27% | 20 | 0.25% | -655 | -8.12% | 8,063 |
| Fayette | 5,010 | 48.43% | 4,668 | 45.13% | 627 | 6.06% | 39 | 0.38% | 342 | 3.31% | 10,344 |
| Ford | 4,672 | 70.53% | 1,093 | 16.50% | 849 | 12.82% | 10 | 0.15% | 3,579 | 54.03% | 6,624 |
| Franklin | 6,779 | 39.59% | 5,791 | 33.82% | 4,304 | 25.14% | 247 | 1.44% | 988 | 5.77% | 17,121 |
| Fulton | 8,664 | 48.35% | 5,011 | 27.96% | 4,150 | 23.16% | 96 | 0.54% | 3,653 | 20.38% | 17,921 |
| Gallatin | 1,792 | 39.16% | 2,385 | 52.12% | 368 | 8.04% | 31 | 0.68% | -593 | -12.96% | 4,576 |
| Greene | 3,527 | 39.73% | 4,648 | 52.35% | 687 | 7.74% | 16 | 0.18% | -1,121 | -12.63% | 8,878 |
| Grundy | 4,337 | 63.97% | 742 | 10.94% | 1,681 | 24.79% | 20 | 0.29% | 2,656[lower-alpha 1] | 39.17% | 6,780 |
| Hamilton | 2,659 | 44.02% | 3,168 | 52.44% | 200 | 3.31% | 14 | 0.23% | -509 | -8.43% | 6,041 |
| Hancock | 6,678 | 51.83% | 5,189 | 40.27% | 963 | 7.47% | 55 | 0.43% | 1,489 | 11.56% | 12,885 |
| Hardin | 1,378 | 49.06% | 1,358 | 48.34% | 70 | 2.49% | 3 | 0.11% | 20 | 0.71% | 2,809 |
| Henderson | 2,879 | 72.87% | 803 | 20.32% | 257 | 6.50% | 12 | 0.30% | 2,076 | 52.54% | 3,951 |
| Henry | 13,159 | 72.39% | 1,944 | 10.69% | 3,027 | 16.65% | 49 | 0.27% | 10,132[lower-alpha 1] | 55.73% | 18,179 |
| Iroquois | 7,498 | 64.07% | 2,303 | 19.68% | 1,873 | 16.01% | 28 | 0.24% | 5,195 | 44.39% | 11,702 |
| Jackson | 6,424 | 49.30% | 4,707 | 36.12% | 1,845 | 14.16% | 54 | 0.41% | 1,717 | 13.18% | 13,030 |
| Jasper | 3,030 | 47.37% | 3,144 | 49.15% | 201 | 3.14% | 22 | 0.34% | -114 | -1.78% | 6,397 |
| Jefferson | 5,406 | 44.57% | 6,258 | 51.59% | 436 | 3.59% | 30 | 0.25% | -852 | -7.02% | 12,130 |
| Jersey | 2,460 | 44.44% | 2,723 | 49.19% | 335 | 6.05% | 18 | 0.33% | -263 | -4.75% | 5,536 |
| Jo Daviess | 4,864 | 50.36% | 1,477 | 15.29% | 3,279 | 33.95% | 39 | 0.40% | 1,585[lower-alpha 1] | 16.41% | 9,659 |
| Johnson | 2,468 | 60.59% | 1,408 | 34.57% | 188 | 4.62% | 9 | 0.22% | 1,060 | 26.03% | 4,073 |
| Kane | 32,717 | 76.34% | 3,517 | 8.21% | 6,517 | 15.21% | 107 | 0.25% | 26,200[lower-alpha 1] | 61.13% | 42,858 |
| Kankakee | 12,462 | 67.47% | 2,488 | 13.47% | 3,438 | 18.61% | 83 | 0.45% | 9,024[lower-alpha 1] | 48.85% | 18,471 |
| Kendall | 3,513 | 79.68% | 432 | 9.80% | 455 | 10.32% | 9 | 0.20% | 3,058[lower-alpha 1] | 69.36% | 4,409 |
| Knox | 12,968 | 65.89% | 2,617 | 13.30% | 4,044 | 20.55% | 51 | 0.26% | 8,924[lower-alpha 1] | 45.35% | 19,680 |
| Lake | 18,229 | 75.48% | 2,008 | 8.31% | 3,671 | 15.20% | 242 | 1.00% | 14,558[lower-alpha 1] | 60.28% | 24,150 |
| LaSalle | 21,417 | 60.47% | 6,216 | 17.55% | 7,686 | 21.70% | 98 | 0.28% | 13,731[lower-alpha 1] | 38.77% | 35,417 |
| Lawrence | 4,607 | 51.50% | 4,103 | 45.87% | 167 | 1.87% | 68 | 0.76% | 504 | 5.63% | 8,945 |
| Lee | 8,363 | 69.36% | 2,367 | 19.63% | 1,289 | 10.69% | 38 | 0.32% | 5,996 | 49.73% | 12,057 |
| Livingston | 9,695 | 64.53% | 2,911 | 19.37% | 2,387 | 15.89% | 32 | 0.21% | 6,784 | 45.15% | 15,025 |
| Logan | 7,063 | 57.16% | 3,708 | 30.01% | 1,537 | 12.44% | 48 | 0.39% | 3,355 | 27.15% | 12,356 |
| Macon | 16,458 | 60.22% | 6,670 | 24.40% | 4,120 | 15.07% | 83 | 0.30% | 9,788 | 35.81% | 27,331 |
| Macoupin | 8,571 | 39.24% | 6,134 | 28.08% | 6,959 | 31.86% | 177 | 0.81% | 1,612[lower-alpha 1] | 7.38% | 21,841 |
| Madison | 19,926 | 47.61% | 12,863 | 30.74% | 8,965 | 21.42% | 97 | 0.23% | 7,063 | 16.88% | 41,851 |
| Marion | 5,889 | 44.01% | 4,768 | 35.63% | 2,671 | 19.96% | 53 | 0.40% | 1,121 | 8.38% | 13,381 |
| Marshall | 3,776 | 58.41% | 1,836 | 28.40% | 823 | 12.73% | 30 | 0.46% | 1,940 | 30.01% | 6,465 |
| Mason | 3,522 | 52.72% | 2,536 | 37.96% | 604 | 9.04% | 18 | 0.27% | 986 | 14.76% | 6,680 |
| Massac | 3,227 | 71.44% | 920 | 20.37% | 350 | 7.75% | 20 | 0.44% | 2,307 | 51.07% | 4,517 |
| McDonough | 7,505 | 60.99% | 4,016 | 32.63% | 746 | 6.06% | 39 | 0.32% | 3,489 | 28.35% | 12,306 |
| McHenry | 8,751 | 67.24% | 1,372 | 10.54% | 2,864 | 22.01% | 28 | 0.22% | 5,887[lower-alpha 1] | 45.23% | 13,015 |
| McLean | 16,550 | 55.95% | 6,826 | 23.07% | 6,132 | 20.73% | 74 | 0.25% | 9,724 | 32.87% | 29,582 |
| Menard | 2,931 | 56.18% | 1,954 | 37.45% | 319 | 6.11% | 13 | 0.25% | 977 | 18.73% | 5,217 |
| Mercer | 5,618 | 68.30% | 1,699 | 20.66% | 890 | 10.82% | 18 | 0.22% | 3,919 | 47.65% | 8,225 |
| Monroe | 2,390 | 48.35% | 1,369 | 27.70% | 1,173 | 23.73% | 11 | 0.22% | 1,021 | 20.66% | 4,943 |
| Montgomery | 8,022 | 47.26% | 5,622 | 33.12% | 3,225 | 19.00% | 106 | 0.62% | 2,400 | 14.14% | 16,975 |
| Morgan | 8,223 | 55.40% | 5,721 | 38.54% | 877 | 5.91% | 23 | 0.15% | 2,502 | 16.86% | 14,844 |
| Moultrie | 3,001 | 53.10% | 2,403 | 42.52% | 225 | 3.98% | 23 | 0.41% | 598 | 10.58% | 5,652 |
| Ogle | 8,449 | 71.61% | 1,591 | 13.48% | 1,727 | 14.64% | 32 | 0.27% | 6,722[lower-alpha 1] | 56.97% | 11,799 |
| Peoria | 25,243 | 58.55% | 6,343 | 14.71% | 11,306 | 26.22% | 220 | 0.51% | 13,937[lower-alpha 1] | 32.33% | 43,112 |
| Perry | 3,693 | 39.76% | 3,007 | 32.37% | 2,536 | 27.30% | 53 | 0.57% | 686 | 7.39% | 9,289 |
| Piatt | 3,799 | 64.31% | 1,733 | 29.34% | 354 | 5.99% | 21 | 0.36% | 2,066 | 34.98% | 5,907 |
| Pike | 4,989 | 45.59% | 5,424 | 49.57% | 481 | 4.40% | 49 | 0.45% | -435 | -3.98% | 10,943 |
| Pope | 2,161 | 66.51% | 978 | 30.10% | 106 | 3.26% | 4 | 0.12% | 1,183 | 36.41% | 3,249 |
| Pulaski | 3,355 | 61.57% | 1,700 | 31.20% | 390 | 7.16% | 4 | 0.07% | 1,655 | 30.37% | 5,449 |
| Putnam | 1,364 | 61.50% | 260 | 11.72% | 586 | 26.42% | 8 | 0.36% | 778[lower-alpha 1] | 35.08% | 2,218 |
| Randolph | 4,527 | 41.61% | 3,734 | 34.32% | 2,591 | 23.81% | 28 | 0.26% | 793 | 7.29% | 10,880 |
| Richland | 3,082 | 50.07% | 2,749 | 44.66% | 295 | 4.79% | 29 | 0.47% | 333 | 5.41% | 6,155 |
| Rock Island | 20,563 | 57.69% | 3,631 | 10.19% | 11,320 | 31.76% | 133 | 0.37% | 9,243[lower-alpha 1] | 25.93% | 35,647 |
| Saline | 6,084 | 47.03% | 4,037 | 31.21% | 2,743 | 21.20% | 73 | 0.56% | 2,047 | 15.82% | 12,937 |
| Sangamon | 23,443 | 51.58% | 12,640 | 27.81% | 9,054 | 19.92% | 309 | 0.68% | 10,803 | 23.77% | 45,446 |
| Schuyler | 2,729 | 46.21% | 2,860 | 48.43% | 298 | 5.05% | 19 | 0.32% | -131 | -2.22% | 5,906 |
| Scott | 2,227 | 50.49% | 1,994 | 45.21% | 180 | 4.08% | 10 | 0.23% | 233 | 5.28% | 4,411 |
| Shelby | 5,605 | 48.13% | 5,265 | 45.21% | 717 | 6.16% | 59 | 0.51% | 340 | 2.92% | 11,646 |
| St. Clair | 23,380 | 45.85% | 14,921 | 29.26% | 12,468 | 24.45% | 225 | 0.44% | 8,459 | 16.59% | 50,994 |
| Stark | 2,698 | 71.07% | 784 | 20.65% | 310 | 8.17% | 4 | 0.11% | 1,914 | 50.42% | 3,796 |
| Stephenson | 8,638 | 53.27% | 2,452 | 15.12% | 5,088 | 31.38% | 38 | 0.23% | 3,550[lower-alpha 1] | 21.89% | 16,216 |
| Tazewell | 7,488 | 52.11% | 3,375 | 23.49% | 3,470 | 24.15% | 37 | 0.26% | 4,018[lower-alpha 1] | 27.96% | 14,370 |
| Union | 2,579 | 39.16% | 3,783 | 57.44% | 216 | 3.28% | 8 | 0.12% | -1,204 | -18.28% | 6,586 |
| Vermilion | 17,822 | 54.64% | 6,424 | 19.70% | 8,073 | 24.75% | 296 | 0.91% | 9,749[lower-alpha 1] | 29.89% | 32,615 |
| Wabash | 2,564 | 45.61% | 2,442 | 43.44% | 589 | 10.48% | 26 | 0.46% | 122 | 2.17% | 5,621 |
| Warren | 6,912 | 65.07% | 2,440 | 22.97% | 1,225 | 11.53% | 46 | 0.43% | 4,472 | 42.10% | 10,623 |
| Washington | 3,444 | 56.43% | 1,717 | 28.13% | 917 | 15.03% | 25 | 0.41% | 1,727 | 28.30% | 6,103 |
| Wayne | 4,937 | 52.70% | 4,247 | 45.34% | 164 | 1.75% | 20 | 0.21% | 690 | 7.37% | 9,368 |
| White | 3,780 | 44.71% | 4,377 | 51.77% | 278 | 3.29% | 19 | 0.22% | -597 | -7.06% | 8,454 |
| Whiteside | 11,532 | 74.04% | 1,957 | 12.56% | 2,057 | 13.21% | 30 | 0.19% | 9,475[lower-alpha 1] | 60.83% | 15,576 |
| Will | 22,780 | 64.16% | 4,707 | 13.26% | 7,902 | 22.26% | 116 | 0.33% | 14,878[lower-alpha 1] | 41.90% | 35,505 |
| Williamson | 9,366 | 45.27% | 6,117 | 29.57% | 5,114 | 24.72% | 92 | 0.44% | 3,249 | 15.70% | 20,689 |
| Winnebago | 21,978 | 71.32% | 2,228 | 7.23% | 6,434 | 20.88% | 174 | 0.56% | 15,544[lower-alpha 1] | 50.44% | 30,814 |
| Woodford | 4,290 | 57.48% | 1,828 | 24.49% | 1,326 | 17.77% | 20 | 0.27% | 2,462 | 32.98% | 7,464 |
| Totals | 1,453,321 | 58.84% | 576,975 | 23.36% | 432,027 | 17.49% | 7,744 | 0.31% | 876,346 | 35.48% | 2,470,067 |
Notes
- In this county where La Follette ran second ahead of Davis, margin given is Coolidge vote minus La Follette vote and percentage margin Coolidge percentage minus La Follette percentage.
References
- "OFFICIAL VOTE OF THE STATE OF ILLINOIS CAST AT THE GENERAL ELECTION, November 4, 1924 JUDICIAL ELECTIONS, 1923-1924 SPECIAL ELECTIONS 1923-1924 PRIMARY ELECTION GENERAL PRIMARY, April 8, 1924 PRESIDENTIAL PREFERENCE, APRIL 8, 1924" (PDF). Illinois State Board of Elections. Retrieved 5 August 2020.
- Phillips, Kevin P.; The Emerging Republican Majority, pp. 341-344 ISBN 978-0-691-16324-6
- Wells, Damon; Stephen Douglas: The Last Years, 1857–1861, p. 285 ISBN 0292776357
- Copeland, James E.; ‘Where Were the Kentucky Unionists and Secessionists’; The Register of the Kentucky Historical Society, volume 71, no. 4 (October, 1973), pp. 344-363
- "Presidential General Election Results Comparison – Illinois". Dave Leip’s U.S. Election Atlas.
- Schattschneider, Elmer Eric; The Semisovereign People: A Realist's View of Democracy in America, pp. 76-84 ISBN 0030133661
- Hough, Jerry F.; Changing Party Coalitions: The Mystery of the Red State-Blue State Alignment, pp. 86-87 ISBN 0875864090
- Menendez, Albert J.; The Geography of Presidential Elections in the United States, 1868-2004, p. 52 ISBN 0786422173
- ‘Dawes Wins on 3rd Ballot: Gets 682 1/2 to 234 1/2 for Hoover on Opening of Night Session’; New York Times, June 13, 1924, p. 1
- Richardson, Danny G.; Others: “Fighting Bob” La Follette and the Progressive Movement: Third-Party Politics in the 1920s, p. 180 ISBN 0595481264
- ‘La Follette Opens Drive on Labor Day: Campaign Will Start With a Radio Speech From Washington. Hope to Carry Illinois: Leaders Say Small Won’t Support Coolidge – To Talk Finances Today’; New York Times, August 23, 1924, p. 1
- ‘Davis Optimistic as He Departs on Tour in the West: Situation in Illinois, Kansas, Nebraska and Iowa Better Than Figured’; The Washington Post, September 6, 1924, p. 2
- Price, Harry N.; ‘Middle West Trips Urged on Coolidge by Close Adversers: Sentiment for La Follette Is Growing There’; The Washington Post, September 13, 1924, p. 4
- Bohn, Frank; ‘Forecast of Election in All the States: Political Analyst Asserts That La Follette Vote Will Be Decisive Factor in Large Cities of North and West – Predicts Victory for Davis’; New York Times, September 14, 1924, p. XX4
- ‘Wheeler Assails Dawes in Chicago: Goes Into Rival's Connection With Lorimer and Bank That Failed’; New York Times, September 21, 1924, p. 3
- ‘Electoral Arthmetic’, New York Times, July 13, 1924, p. E2
- ‘Republicans Admit Their “Sure” States Fail of Majority: Those Now Counted as Certain for Coolidge Have Only 206 Electoral Votes’; New York Times, August 11, 1924, p. 1
- ‘Coolidge Is Leading in a Test Ballot: First 25,000 in Literary Digest Poll Puts Davis Third. La Follette Now Second; But It Is Explained the Returns Thus Far Are Too Scattered to Be Typical’; New York Times, September 19, 1924, p. 3
- ‘Davis Percentage Increases in Poll: But Coolidge Still Leads With 808,340 Out of Total of 1,451,591 Votes. La Follette Is Second: Democratic Candidate Has 10 States Thus Far, Coolidge 31 and La Follette Only 1’; New York Times, October 10, 1924, p. 3
- ‘Illinois Is Likely to Go to Coolidge: Davis Seems to Have Greater Hold on Farmers Than La Follette’; New York Times, October 22, 1924, p. 2
- Lawrence, David; ‘Decisive Victory for Coolidge Predicted: David Lawrence Tells What He Learned in Journey Through All Northern and Western States’; Boston Daily Globe; October 31, 1924, p. 1A
- Menendez; The Geography of Presidential Elections in the United States, p. 59
- Illinois State Board of Elections; Official Vote of the State of Illinois Cast at the General Election November 4, 1924 (highest elector for each slate)
.jpg.webp)
.jpg.webp)
.jpg.webp)
