Clay County, Illinois
Clay County is a county in the U.S. state of Illinois. As of the 2010 United States Census, the population was 13,815.[1] Since 1842, its county seat has been Louisville, in the center of the county's area.[2]
Clay County | |
|---|---|
 Clay County Courthouse in Louisville | |
 Location within the U.S. state of Illinois | |
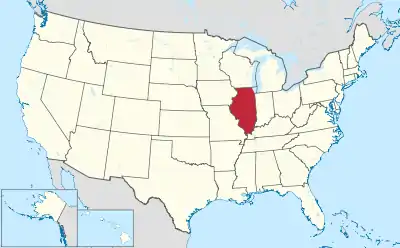 Illinois's location within the U.S. | |
| Coordinates: 38°46′N 88°29′W | |
| Country | |
| State | |
| Founded | 23 December 1824 (created) 8 March 1825 (organized) |
| Named for | Henry Clay |
| Seat | Louisville |
| Largest city | Flora |
| Area | |
| • Total | 469.59 sq mi (1,216.2 km2) |
| • Land | 468.32 sq mi (1,212.9 km2) |
| • Water | 1.28 sq mi (3.3 km2) 0.3% |
| Population (2010) | |
| • Total | 13,815 |
| • Estimate (2018) | 13,253 |
| • Density | 28.3/sq mi (10.9/km2) |
| Congressional district | 15th |
| Website | claycountyillinois |
In 1950, the U.S. Census Bureau placed the mean center of U.S. population in Clay County.[3]
History
The future Clay County had been inhabited for thousands of years by indigenous people (the remains of an Indian village's burial ground are still visible west of Ingraham). White explorers used or cleared a trail between the future settlements of Saint Louis in Missouri, to Vincennes in Indiana; this became a mail route in 1805. The first white settler (McCauley, from Kentucky) built a cabin in 1809 near this road at its intersection with a trail from Vandalia to Mt. Carmel. He was driven out by the Indians, but had returned by 1819, by which time other cabins had been constructed in the area, which was originally called Habbardsville. The Indians were removed from the area in 1828.[4]
Clay County was authorized by act of the state legislature on 23 December 1824, by partitioning portions of Wayne, Crawford, and Fayette counties.[4] It was named for American statesman Henry Clay,[5] a member of the United States Senate from Kentucky and United States Secretary of State. Clay was a candidate for president in 1824.
The first appointed commissioners met on 8 March 1825 to organize the county government. Land for county building purposes was donated near Habbardsville. The commissioners accepted the offer, renamed it Maysville, and had a two-room courthouse erected on the property by the end of the year.[6] The seat remained at that location (about a mile south of the present community of Clay City) through 1841, and in 1842 the county government began functioning in Louisville, being at the center of the county's area.[4]
The first railroad line through Clay County was laid between 1850 and 1854, the Ohio and Mississippi Line.[4] By 1855-56, the Illinois Central Railroad had also been constructed across the northwest corner of the county.
Geography
 Clay County from the time of its creation to 1831
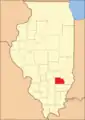 Clay County between 1831 and 1841
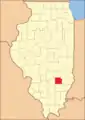 Clay County was reduced to its current size in 1841 by the creation of Richland County.
The low rolling hills of Clay County are devoted to agricultural production. The various drainage areas are still largely wooded. The Little Wabash River flows southeastward through the center of the county, while Muddy Creek drains the eastern portion (the meanders of Little Muddy delineate a portion of the county's east border with Richland County). Buck Creek, in the south part of the county, flows eastward and joins the Little Wabash above Clay City. Raccoon Creek flows southeastward from the lower part of the county into Wayne County.[7] The highest point on the terrain (646 feet/197 meters ASL) is a small point along the western border with Marion County.[8]
The county produced excellent timber during the nineteenth century, and some sandstone and limestone. The soil is light and not considered adapted to farming on a large scale.[4]
According to the U.S. Census Bureau, the county has a total area of 470 square miles (1,200 km2), of which 468 square miles (1,210 km2) is land and 1.3 square miles (3.4 km2) (0.3%) is water.[9]
Adjacent counties
- Effingham County - north
- Jasper County - northeast
- Richland County - east
- Wayne County - south
- Marion County - west
- Fayette County - northwest
Protected areas
- Martin T Snyder Memorial Nature Preserve[10]
Cities
Villages
- Clay City
- Iola
- Louisville (seat)
- Sailor Springs
- Xenia
Unincorporated communities
Climate and weather
| Louisville, Illinois | ||||||||||||||||||||||||||||||||||||||||||||||||||||||||||||
|---|---|---|---|---|---|---|---|---|---|---|---|---|---|---|---|---|---|---|---|---|---|---|---|---|---|---|---|---|---|---|---|---|---|---|---|---|---|---|---|---|---|---|---|---|---|---|---|---|---|---|---|---|---|---|---|---|---|---|---|---|
| Climate chart (explanation) | ||||||||||||||||||||||||||||||||||||||||||||||||||||||||||||
| ||||||||||||||||||||||||||||||||||||||||||||||||||||||||||||
| ||||||||||||||||||||||||||||||||||||||||||||||||||||||||||||
In recent years, average temperatures in the county seat of Louisville have ranged from a low of 21 °F (−6 °C) in January to a high of 89 °F (32 °C) in July, although a record low of −25 °F (−32 °C) was recorded in January 1904 and a record high of 111 °F (44 °C) was recorded in July 1936. Average monthly precipitation ranged from 2.49 inches (63 mm) in February to 4.34 inches (110 mm) in June.[11]
Demographics
| Historical population | |||
|---|---|---|---|
| Census | Pop. | %± | |
| 1830 | 755 | — | |
| 1840 | 3,228 | 327.5% | |
| 1850 | 4,289 | 32.9% | |
| 1860 | 9,336 | 117.7% | |
| 1870 | 15,875 | 70.0% | |
| 1880 | 16,192 | 2.0% | |
| 1890 | 16,772 | 3.6% | |
| 1900 | 19,553 | 16.6% | |
| 1910 | 18,661 | −4.6% | |
| 1920 | 17,684 | −5.2% | |
| 1930 | 16,155 | −8.6% | |
| 1940 | 18,947 | 17.3% | |
| 1950 | 17,445 | −7.9% | |
| 1960 | 15,815 | −9.3% | |
| 1970 | 14,735 | −6.8% | |
| 1980 | 15,283 | 3.7% | |
| 1990 | 14,460 | −5.4% | |
| 2000 | 14,560 | 0.7% | |
| 2010 | 13,815 | −5.1% | |
| 2018 (est.) | 13,253 | [12] | −4.1% |
| US Decennial Census[13] 1790-1960[14] 1900-1990[15] 1990-2000[16] 2010-2013[1] | |||
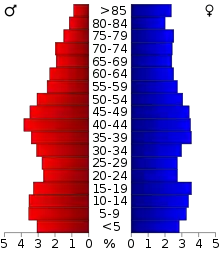
2010 census
As of the 2010 United States Census, there were 13,815 people, 5,697 households, and 3,790 families in the county.[17] The population density was 29.5 inhabitants per square mile (11.4/km2). There were 6,404 housing units at an average density of 13.7 per square mile (5.3/km2).[9] The racial makeup of the county was 97.7% white, 0.5% Asian, 0.3% black or African American, 0.2% American Indian, 0.5% from other races, and 0.8% from two or more races. Those of Hispanic or Latino origin made up 1.1% of the population.[17] In terms of ancestry, 21.7% were German, 14.6% were American, 12.6% were Irish, and 8.6% were English.[18]
Of the 5,697 households, 29.5% had children under the age of 18 living with them, 52.1% were married couples living together, 9.4% had a female householder with no husband present, 33.5% were non-families, and 28.9% of all households were made up of individuals. The average household size was 2.37 and the average family size was 2.89. The median age was 42.2 years.[17]
The median income for a household in the county was $38,016 and the median income for a family was $48,659. Males had a median income of $38,191 versus $27,347 for females. The per capita income for the county was $20,802. About 11.2% of families and 16.3% of the population were below the poverty line, including 21.4% of those under age 18 and 14.7% of those age 65 or over.[19]
Education
- Clay City Community Unit District 10
- Dieterich Community Unit School District 30
- Effingham Community Unit School District 40
- Flora Community Unit School District 35
- Jasper County Community Unit School District 1
- North Clay Community Unit School District 25
- South Central Community Unit School District 401
- West Richland Community Unit School District 2
Politics
As part of Upper Southern-leaning Southern Illinois, Clay County is powerfully Republican. No Democratic presidential nominee has won a majority in Clay County since Lyndon Johnson’s 1964 landslide, and typically for the region recent presidential elections have seen dramatic declines in Democratic support due to disagreement with liberal positions on social issues.[20]
| Year | Republican | Democratic | Third parties |
|---|---|---|---|
| 2016 | 79.1% 5,021 | 16.1% 1,020 | 4.9% 309 |
| 2012 | 70.9% 4,190 | 26.8% 1,584 | 2.3% 134 |
| 2008 | 60.7% 3,926 | 37.5% 2,425 | 1.8% 115 |
| 2004 | 67.4% 4,416 | 32.1% 2,101 | 0.6% 37 |
| 2000 | 61.8% 3,789 | 36.1% 2,212 | 2.2% 134 |
| 1996 | 43.4% 2,703 | 44.2% 2,750 | 12.4% 775 |
| 1992 | 37.2% 2,471 | 44.5% 2,962 | 18.3% 1,219 |
| 1988 | 55.7% 3,494 | 44.0% 2,761 | 0.4% 24 |
| 1984 | 64.2% 4,562 | 35.5% 2,524 | 0.3% 18 |
| 1980 | 61.2% 4,447 | 35.6% 2,587 | 3.2% 232 |
| 1976 | 49.9% 3,860 | 49.6% 3,837 | 0.4% 32 |
| 1972 | 64.9% 5,283 | 35.0% 2,844 | 0.1% 11 |
| 1968 | 55.5% 4,429 | 36.0% 2,878 | 8.5% 679 |
| 1964 | 44.6% 3,665 | 55.4% 4,551 | |
| 1960 | 60.1% 5,134 | 39.8% 3,394 | 0.1% 10 |
| 1956 | 58.7% 5,079 | 41.1% 3,553 | 0.2% 16 |
| 1952 | 60.4% 5,254 | 39.4% 3,432 | 0.2% 15 |
| 1948 | 53.2% 3,782 | 44.5% 3,160 | 2.3% 166 |
| 1944 | 55.3% 4,484 | 43.5% 3,531 | 1.2% 95 |
| 1940 | 50.7% 5,185 | 48.3% 4,934 | 1.0% 103 |
| 1936 | 48.3% 4,528 | 50.6% 4,752 | 1.1% 104 |
| 1932 | 41.8% 3,373 | 56.6% 4,565 | 1.6% 126 |
| 1928 | 65.2% 4,522 | 34.8% 2,418 | 0.0% 0 |
| 1924 | 49.6% 3,432 | 43.2% 2,987 | 7.2% 500 |
| 1920 | 59.9% 3,683 | 38.4% 2,358 | 1.8% 108 |
| 1916 | 50.4% 3,879 | 46.5% 3,574 | 3.1% 239 |
| 1912 | 37.4% 1,622 | 44.4% 1,926 | 18.3% 793 |
| 1908 | 49.5% 2,250 | 47.4% 2,152 | 3.1% 141 |
| 1904 | 53.2% 2,408 | 42.7% 1,935 | 4.1% 184 |
| 1900 | 49.5% 2,356 | 48.2% 2,295 | 2.4% 113 |
| 1896 | 47.9% 2,155 | 50.5% 2,272 | 1.6% 73 |
| 1892 | 45.6% 1,774 | 41.3% 1,604 | 13.1% 509 |
References
- "State & County QuickFacts". US Census Bureau. Archived from the original on July 8, 2011. Retrieved July 4, 2014.
- "Find a County". National Association of Counties. Archived from the original on 31 May 2011. Retrieved 7 June 2011.
- "Mean Center of Population for the United States: 1790 to 2000" (PDF). US Census Bureau. Archived from the original (PDF) on 3 November 2001. Retrieved 17 September 2011.
- "A History of Southern Illinois". The USGenWeb Project. 1912. pp. 439–442. Retrieved 24 October 2020.
- Gannett, Henry (1905). The Origin of Certain Place Names in the United States. Govt. Print. Off. p. 83.
- "Larry Brant - Village of Clay City". Archived from the original on 28 February 2009. Retrieved 24 October 2020.
- Clay County IL (Google Maps, accessed 24 October 2020)
- Clay County High Point IL (PeakBagger.com, accessed 24 October 2020)
- "Population, Housing Units, Area, and Density: 2010 - County". US Census Bureau. Archived from the original on February 12, 2020. Retrieved 11 July 2015.
- Martin T Snyder Nature Preserve, Flora IL (Google Maps, accessed 24 October 2020)
- "Monthly Averages for Louisville, Illinois". The Weather Channel. Retrieved 27 January 2011.
- "Population and Housing Unit Estimates". Retrieved November 7, 2019.
- "US Decennial Census". US Census Bureau. Retrieved July 4, 2014.
- "Historical Census Browser". University of Virginia Library. Retrieved July 4, 2014.
- "Population of Counties by Decennial Census: 1900 to 1990". US Census Bureau. Retrieved July 4, 2014.
- "Census 2000 PHC-T-4. Ranking Tables for Counties: 1990 and 2000" (PDF). US Census Bureau. Retrieved July 4, 2014.
- "Profile of General Population and Housing Characteristics: 2010 Demographic Profile Data". US Census Bureau. Archived from the original on February 13, 2020. Retrieved 11 July 2015.
- "Selected Social Characteristics in the US – 2006-2010 American Community Survey 5-Year Estimates". US Census Bureau. Archived from the original on February 13, 2020. Retrieved 11 July 2015.
- "Selected Economic Characteristics – 2006-2010 American Community Survey 5-Year Estimates". US Census Bureau. Archived from the original on February 13, 2020. Retrieved 11 July 2015.
- Cohn, Nate; ‘Demographic Shift: Southern Whites’ Loyalty to G.O.P. Nearing That of Blacks to Democrats’, The New York Times, April 24, 2014
- Leip, David. "Atlas of US Presidential Elections". uselectionatlas.org. Retrieved 31 October 2018.
External links
Places adjacent to Clay County, Illinois | ||||||||||
|---|---|---|---|---|---|---|---|---|---|---|
| ||||||||||
Municipalities and communities of Clay County, Illinois, United States | ||
|---|---|---|
| City | Map of Illinois highlighting Clay County | |
| Villages | ||
| Townships | ||
| Unincorporated communities | ||
| Ghost town | ||
| Footnotes | ‡This populated place also has portions in an adjacent county or counties | |
| ||

| Counties |  | |
|---|---|---|
| Mid-sized cities (25,000+) | ||
| Small Cities (10,000-25,000) | ||
| Small Cities (5,000-10,000) | ||
| Interstates | ||
| Airports/Military bases |
| |
| Universities | ||
| Colleges | ||
| Sports teams based in the Southern Illinois | ||
| Authority control |
|---|