Pope County, Illinois
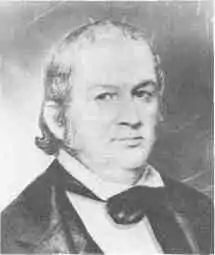
Pope County is a county located in the U.S. state of Illinois. According to the 2010 census, it had a population of 4,470,[1] making it the second-least populous county in Illinois. Its county seat is Golconda.[2] The county was organized in 1816 from portions of Gallatin and Johnson counties and named after Nathaniel Pope, a politician and jurist from the Illinois Territory and State of Illinois.
Pope County | |
|---|---|
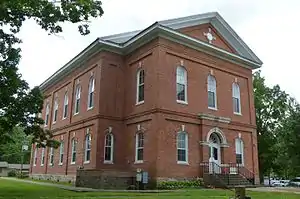 Pope County Courthouse in Golconda | |
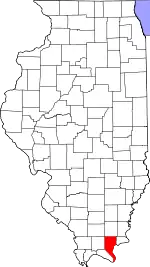 Location within the U.S. state of Illinois | |
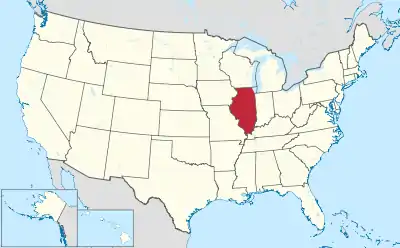 Illinois's location within the U.S. | |
| Coordinates: 37°25′N 88°34′W | |
| Country | |
| State | |
| Founded | 1816 |
| Named for | Nathaniel Pope |
| Seat | Golconda |
| Largest city | Golconda |
| Area | |
| • Total | 374 sq mi (970 km2) |
| • Land | 369 sq mi (960 km2) |
| • Water | 5.5 sq mi (14 km2) 1.5% |
| Population (2010) | |
| • Total | 4,470 |
| • Estimate (2018) | 4,212 |
| • Density | 12/sq mi (4.6/km2) |
| Time zone | UTC−6 (Central) |
| • Summer (DST) | UTC−5 (CDT) |
| Congressional district | 15th |
| Website | www |
History
The first permanent settlement in future Pope County was established in 1798 at the modern-day site of Golconda, then a part of the Northwest Territory which operated as a ferry point across the Ohio River. The county was formed in 1816 from portions of Gallatin and Johnson Counties.
 Pope County from the time of its creation in 1816 to 1839
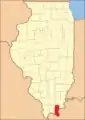 Pope County between 1839 and 1843
 Pope County between 1843 and 1847
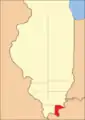
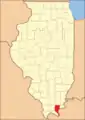 In 1847, Pope's border with Hardin County was adjusted, bringing both to their present borders
Geography
According to the U.S. Census Bureau, the county has a total area of 374 square miles (970 km2), of which 369 square miles (960 km2) is land and 5.5 square miles (14 km2) (1.5%) is water.[3]
The entire county is hilly and during rainy weather rivulets cascade down the hills in the park forming waterfalls of varying sizes and heights. The county contains Dixon Springs State Park, one of many state parks in the Illinois Shawnee Hills, and is part of the Shawnee National Forest. It is bordered to the south and east by the Ohio River, which marks the state's border with Kentucky.
Climate and weather
| Golconda, Illinois | ||||||||||||||||||||||||||||||||||||||||||||||||||||||||||||
|---|---|---|---|---|---|---|---|---|---|---|---|---|---|---|---|---|---|---|---|---|---|---|---|---|---|---|---|---|---|---|---|---|---|---|---|---|---|---|---|---|---|---|---|---|---|---|---|---|---|---|---|---|---|---|---|---|---|---|---|---|
| Climate chart (explanation) | ||||||||||||||||||||||||||||||||||||||||||||||||||||||||||||
| ||||||||||||||||||||||||||||||||||||||||||||||||||||||||||||
| ||||||||||||||||||||||||||||||||||||||||||||||||||||||||||||
In recent years, average temperatures in the county seat of Golconda have ranged from a low of 21 °F (−6 °C) in January to a high of 87 °F (31 °C) in July, although a record low of −22 °F (−30 °C) was recorded in January 1994 and a record high of 104 °F (40 °C) was recorded in August 2007. Average monthly precipitation ranged from 3.22 inches (82 mm) in October to 5.02 inches (128 mm) in May.[4]
Major highways
Adjacent counties
- Saline County - north
- Hardin County - east
- Livingston County, Kentucky - southeast
- Massac County - southwest
- Johnson County - west
- Williamson County - northwest
National protected area
- Shawnee National Forest (part)
Demographics
| Historical population | |||
|---|---|---|---|
| Census | Pop. | %± | |
| 1820 | 2,610 | — | |
| 1830 | 3,316 | 27.0% | |
| 1840 | 4,094 | 23.5% | |
| 1850 | 3,975 | −2.9% | |
| 1860 | 6,742 | 69.6% | |
| 1870 | 11,437 | 69.6% | |
| 1880 | 13,256 | 15.9% | |
| 1890 | 14,016 | 5.7% | |
| 1900 | 13,585 | −3.1% | |
| 1910 | 11,215 | −17.4% | |
| 1920 | 9,625 | −14.2% | |
| 1930 | 7,996 | −16.9% | |
| 1940 | 7,999 | 0.0% | |
| 1950 | 5,779 | −27.8% | |
| 1960 | 4,061 | −29.7% | |
| 1970 | 3,857 | −5.0% | |
| 1980 | 4,404 | 14.2% | |
| 1990 | 4,373 | −0.7% | |
| 2000 | 4,413 | 0.9% | |
| 2010 | 4,470 | 1.3% | |
| 2018 (est.) | 4,212 | [5] | −5.8% |
| U.S. Decennial Census[6] 1790-1960[7] 1900-1990[8] 1990-2000[9] 2010-2017[1] | |||
As of the 2010 census, there were 4,470 people, 1,829 households, and 1,209 families living in the county.[10] The population density was 12.1 inhabitants per square mile (4.7/km2). There were 2,491 housing units at an average density of 6.8 per square mile (2.6/km2).[3] The racial makeup of the county was 91.7% white, 6.0% black or African American, 0.6% American Indian, 0.2% Asian, 0.5% from other races, and 0.9% from two or more races. Those of Hispanic or Latino origin made up 1.4% of the population.[10] In terms of ancestry, 31.8% were German, 19.1% were Irish, 11.4% were English, and 5.4% were American.[11]
Of the 1,829 households, 23.9% had children under the age of 18 living with them, 53.9% were married couples living together, 7.8% had a female householder with no husband present, 33.9% were non-families, and 29.8% of all households were made up of individuals. The average household size was 2.23 and the average family size was 2.72. The median age was 46.6 years.[10]
The median income for a household in the county was $39,672 and the median income for a family was $51,500. Males had a median income of $45,865 versus $28,519 for females. The per capita income for the county was $20,134. About 6.6% of families and 12.4% of the population were below the poverty line, including 18.4% of those under age 18 and 9.1% of those age 65 or over.[12]
Politics
In its early days Pope County, being strongly Southern in its culture and opposed to Northern Illinois, was powerfully Democratic, giving a majority to that party in every pre-war Presidential election.
However, during the Civil War, under the influence of Congressman John A. Logan, this region of dubious initial loyalty was to provide a number of Union soldiers rivalled on a per capita basis only by a few fiercely Unionist counties in Appalachia.[13][14]
Stephen A. Douglas in 1860 remains the last Democrat to win a majority of the county’s vote, although Bill Clinton won pluralities in both 1992 and 1996 due to Ross Perot siphoning votes from Republican opponents George Bush senior and Bob Dole. Hillary Clinton in 2016 fared extremely poorly, carrying fewer than eighteen percent of Pope County’s votes.[15]
| Year | Republican | Democratic | Third parties |
|---|---|---|---|
| 2016 | 78.3% 1,678 | 17.5% 375 | 4.2% 89 |
| 2012 | 68.1% 1,512 | 29.3% 650 | 2.7% 60 |
| 2008 | 60.2% 1,343 | 37.9% 845 | 1.9% 43 |
| 2004 | 61.6% 1,500 | 37.7% 918 | 0.7% 18 |
| 2000 | 57.8% 1,346 | 39.8% 927 | 2.5% 57 |
| 1996 | 41.4% 850 | 44.6% 915 | 14.1% 289 |
| 1992 | 39.4% 951 | 44.1% 1,063 | 16.5% 397 |
| 1988 | 54.4% 1,202 | 45.1% 996 | 0.5% 10 |
| 1984 | 62.0% 1,545 | 37.7% 940 | 0.3% 7 |
| 1980 | 61.1% 1,501 | 35.9% 880 | 3.0% 74 |
| 1976 | 52.2% 1,187 | 47.0% 1,070 | 0.8% 18 |
| 1972 | 64.9% 1,440 | 34.9% 773 | 0.2% 5 |
| 1968 | 57.6% 1,307 | 32.3% 732 | 10.1% 229 |
| 1964 | 54.3% 1,329 | 45.7% 1,117 | |
| 1960 | 63.4% 1,689 | 36.4% 971 | 0.2% 5 |
| 1956 | 66.6% 1,842 | 33.4% 922 | 0.0% 1 |
| 1952 | 67.5% 1,947 | 32.4% 933 | 0.1% 3 |
| 1948 | 65.4% 1,764 | 34.0% 916 | 0.6% 16 |
| 1944 | 73.0% 2,305 | 25.7% 813 | 1.3% 40 |
| 1940 | 65.8% 2,914 | 33.8% 1,499 | 0.4% 17 |
| 1936 | 61.3% 2,787 | 38.0% 1,728 | 0.7% 33 |
| 1932 | 53.9% 2,011 | 45.5% 1,697 | 0.6% 24 |
| 1928 | 74.1% 2,004 | 25.1% 679 | 0.9% 23 |
| 1924 | 66.5% 2,161 | 30.1% 978 | 3.4% 110 |
| 1920 | 77.4% 2,486 | 21.4% 687 | 1.2% 38 |
| 1916 | 70.1% 2,924 | 27.8% 1,158 | 2.1% 87 |
| 1912 | 45.8% 1,099 | 27.7% 664 | 26.6% 636 |
| 1908 | 67.8% 1,706 | 29.7% 748 | 2.5% 64 |
| 1904 | 68.6% 1,744 | 26.6% 676 | 4.8% 123 |
| 1900 | 66.0% 1,817 | 33.0% 908 | 1.0% 27 |
| 1896 | 63.0% 1,852 | 36.5% 1,074 | 0.5% 16 |
| 1892 | 58.5% 1,629 | 29.3% 816 | 12.2% 340 |
Communities
City
Village
Unincorporated communities
- Brownfield
- Dixon Springs
- Hamletsburg
- Herod
- Lusk's Ferry
- McCormick
- Rosebud
- Temple Hill
Notable people
- James Lusk Alcorn (1816-1894), born near Golconda, American Civil War general in the Confederate Army
- John R. Hodge (1893-1963), born in Golconda; Military Governor of South Korea preceding the Korean War and Commanding General of the U.S. Third Army
- C. L. McCormick (1919-1987), born in McCormick, Illinois state representative and businessman
- Green B. Raum (1820-1909), born in Golconda, American Civil War general in the Union Army
- James A. Rose (1850-1912), born in Golconda, Illinois Secretary of State
- Mason Ramsey (2006-), born in Golconda, star of viral video “Walmart Kid Singing” and country singer
- William C. Reed (1989-), born in Paducah, KY, and raised near Eddyville. Professional engineer specialized in hydrologic and hydraulic modeling, wastewater treatment design, and private development design. Licensed in Texas, Florida, and Kentucky.
See also
References
- "State & County QuickFacts". United States Census Bureau. Archived from the original on December 8, 2015. Retrieved July 8, 2014.
- "Find a County". National Association of Counties. Retrieved June 7, 2011.
- "Population, Housing Units, Area, and Density: 2010 - County". United States Census Bureau. Archived from the original on February 13, 2020. Retrieved July 12, 2015.
- "Monthly Averages for Golconda, Illinois". The Weather Channel. Retrieved January 27, 2011.
- "Population and Housing Unit Estimates". Retrieved November 3, 2019.
- "U.S. Decennial Census". United States Census Bureau. Retrieved July 8, 2014.
- "Historical Census Browser". University of Virginia Library. Retrieved July 8, 2014.
- "Population of Counties by Decennial Census: 1900 to 1990". United States Census Bureau. Retrieved July 8, 2014.
- "Census 2000 PHC-T-4. Ranking Tables for Counties: 1990 and 2000" (PDF). United States Census Bureau. Retrieved July 8, 2014.
- "DP-1 Profile of General Population and Housing Characteristics: 2010 Demographic Profile Data". United States Census Bureau. Archived from the original on February 13, 2020. Retrieved July 12, 2015.
- "DP02 SELECTED SOCIAL CHARACTERISTICS IN THE UNITED STATES – 2006-2010 American Community Survey 5-Year Estimates". United States Census Bureau. Archived from the original on February 13, 2020. Retrieved July 12, 2015.
- "DP03 SELECTED ECONOMIC CHARACTERISTICS – 2006-2010 American Community Survey 5-Year Estimates". United States Census Bureau. Archived from the original on February 13, 2020. Retrieved July 12, 2015.
- Wells, Damon; Stephen Douglas: The Last Years, 1857–1861, p. 285 ISBN 0292776357
- Copeland, James E.; ‘Where Were the Kentucky Unionists and Secessionists’; The Register of the Kentucky Historical Society, volume 71, no. 4 (October, 1973), pp. 344-363
- Cohn, Nate; ‘Demographic Shift: Southern Whites’ Loyalty to G.O.P. Nearing That of Blacks to Democrats’, New York Times, April 24, 2014
- Leip, David. "Dave Leip's Atlas of U.S. Presidential Elections". uselectionatlas.org. Retrieved November 11, 2018.
External links
Places adjacent to Pope County, Illinois | ||||||||||
|---|---|---|---|---|---|---|---|---|---|---|
| ||||||||||
Municipalities and communities of Pope County, Illinois, United States | ||
|---|---|---|
| City | Map of Illinois highlighting Pope County | |
| Village | ||
| Precincts | ||
| Unincorporated communities |
| |
| ||
| Counties | 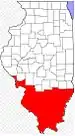 | |
|---|---|---|
| Mid-sized cities (25,000+) | ||
| Small Cities (10,000-25,000) | ||
| Small Cities (5,000-10,000) | ||
| Interstates | ||
| Airports/Military bases |
| |
| Universities | ||
| Colleges | ||
| Sports teams based in the Southern Illinois | ||
| Authority control |
|---|